

Abstract
Rationale
In Time‐of‐Flight Secondary Ion Mass Spectrometry (TOF‐SIMS), pulsed and focused primary ion beams enable mass spectrometry imaging, a method which is particularly useful to map various small molecules such as lipids at the surface of biological samples. When using TOF‐SIMS instruments, the focusing modes of the primary ion beam delivered by liquid metal ion guns can provide either a mass resolution of several thousand or a sub‐µm lateral resolution, but the combination of both is generally not possible.
Methods
With a TOF‐SIMS setup, a delayed extraction applied to secondary ions has been studied extensively on rat cerebellum sections in order to compensate for the effect of long primary ion bunches.
Results
The use of a delayed extraction has been proven to be an efficient solution leading to unique features, i.e. a mass resolution up to 10000 at m/z 385.4 combined with a lateral resolution of about 400 nm. Simulations of ion trajectories confirm the experimental determination of optimal delayed extraction and allow understanding of the behavior of ions as a function of their mass‐to‐charge ratio.
Conclusions
Although the use of a delayed extraction has been well known for many years and is very popular in MALDI, it is much less used in TOF‐SIMS. Its full characterization now enables secondary ion images to be recorded in a single run with a submicron spatial resolution and with a mass resolution of several thousand. This improvement is very useful when analyzing lipids on tissue sections, or rare, precious, or very small size samples. © 2015 The Authors. Rapid Communications in Mass Spectrometry published by John Wiley & Sons Ltd.
Secondary Ion Mass Spectrometry (SIMS) is based on the emission of secondary ions after the impact on a surface of keV energy primary ions. The possibility of tightly focusing the primary ion beam makes SIMS well suited for the generation of high spatial resolution ion images. In the early 1960s, Castaing and Slodzian described a process for producing an image based on the SIMS principle.1 Many improvements have been made over several decades. Among them, liquid metal ion guns (LMIG), delivering focused polyatomic ion beams, and reflectron time‐of‐flight (TOF) analyzers, permit ion images of a sample surface to be generated with sub‐micrometric spatial resolution and high mass resolution.2, 3, 4
The use of clusters allows the study of lipid composition in biological systems involved in Fabry's disease,5 Duchene muscular dystrophy,6 non‐alcoholic fatty liver disease,7 Alzheimer's disease,8 as well as natural substances in vegetal specimens,9, 10 and microbiology,11 or organic and mineral compounds attributed to pigments in painting samples.12, 13 In some cases it is possible to record images of a single cell.14, 15 Furthermore, TOF‐SIMS is used in diverse areas, such as cosmo‐chemistry,16 and for the study of cultural heritage samples.17, 18 Compared with other molecular mass spectrometry imaging methods, e.g. Matrix‐Assisted Laser Desorption/Ionization (MALDI),19 TOF‐SIMS is often criticized for its lower sensitivity and lower mass range.20 However, with the current state of the art, cluster TOF‐SIMS is the biological mass spectrometry imaging method offering the best spatial resolution, ranging from a few hundreds of nanometers to a few microns. Nano‐SIMS offers significantly higher spatial resolution, but can detect only small mass fragments or elements.21, 22
In TOF‐SIMS two prominent ion beam focusing modes have been described.23, 24, 25 The so‐called Burst Alignment (BA) is a mode which produces a very narrow beam diameter, well below one micron, using a pair of electrostatic lenses. The disadvantage of this method is the time width of the primary ion pulses, several tens of nanoseconds on the sample plane, which typically results in unit mass resolution. Another disadvantage is the low current of primary ions that necessitates long analysis times. The alternative High Current Bunched (HCBU) mode consists of using three electrostatic lenses and a primary ion buncher system to be produced, thus enabling very short pulses of less than one nanosecond. In this case, high mass resolution is achieved. The drawback is a larger beam diameter resulting in moderate spatial resolution of around a few microns. When analyzing samples such as tissue sections, high mass resolution and sufficient mass accuracy are needed in order to assign ion peaks, such as those of lipid species, with minimum ambiguity. Thus, the HCBU mode is mandatory. If better spatial resolution is needed, some authors have first recorded high‐resolution mass spectra using the HCBU mode, before acquiring secondary ion images using the BA mode.26, 27, 28 Nevertheless this method is not fully satisfactory because, to reconstruct the ion images, the peak selection in the mass spectra is related to the time burst and consequently the mass separation is not sufficient to avoid the selection of quasi‐isobaric species. Therefore, an operating mode combining both a high spatial resolution and high mass resolution is needed.
A method of combining these two features is to use a 'burst' mode, where the ion beam has a series of short pulses. In this case, long pulses provided by the BA mode are cut into a burst of successive short ion pulses, resulting in both high mass and high spatial resolutions.29 The disadvantage of this mode is that each of the short primary ion pulses generates its own secondary ion mass spectrum, separated in time by only 25 ns. This mode is acceptable for samples which only contain a few different species or when only low‐mass ions are to be analyzed. For real biological samples, which require the analysis of heavier species such as lipids, the mass spectrum becomes too complex. In addition, the authors29 indicated that the primary ion current is much lower than in BA mode, thus increasing the time needed for data acquisition. Another method which also combines high mass resolution and high spatial resolution for TOF‐SIMS instrumentation has recently been published for accurate measurement of isotopic abundances.30, 31 In that case the primary ions focusing, termed " collimated burst alignment" , enables a beam size of ~100 nm to be produced with a mass resolution of several thousands. However, this approach also results in very low primary ion currents, well adapted to avoid dead times in secondary ion detection, but it requires long acquisition times, incompatible with the analysis of lipid species on tissue sections.
An entirely different way which has been investigated is to adapt or build instruments other than the usual reflectron‐type mass spectrometers. The concept is to use non‐pulsed primary ion beams in order to circumvent the disadvantage in having to choose between mass and spatial resolution. An example of such an approach uses a fullerene ion source fitted to a commercial quadrupole time‐of‐flight (QTOF) instrument.32, 33, 34, 35 A second new instrument has been designed, in which secondary ions generated by a DC primary ion beam are sampled using a buncher before being mass analyzed by a specially designed TOF analyzer.33, 34, 35, 36
An alternative method to maintain the mass resolution with high spatial resolution is to extract secondary ions from the sample surface with a certain delay after the arrival of primary ions. Delayed extraction was first demonstrated by Wiley and McLaren37 and is used in MALDI. The Wiley and MacLaren device uses a simple technique which compensates by means of pulsed extraction for the ion time‐of‐flight differences induced by distributions of either initial ion velocity or ion position (but not for both simultaneously). In MALDI, spatial and velocity distributions are correlated and it is possible to find a good set of delay times and strength fields to correct for the initial velocity distribution of ions.38, 39 In TOF‐SIMS it can also be used to compensate for the departure time of secondary ions when using long primary ion bunches as in the present case of the BA mode if the ion velocity distribution is not too large. Several authors have mentioned the use of a delayed extraction: in the case of ions produced after ion/surface collisions,40 in depth profiling of Langmuir‐Blodgett41 and of peptides films,42 in the analysis of eukaryotic cells preserved in trehalose,43 in the analysis of human skin remains,17 in the depth profiling of nanostructured layers,44 in sputtering of silicate glasses,45 and in the study of topographic and field effects.46
Although already used by several authors,17, 40, 41, 42, 43, 44, 45, 46 the effect of a delayed extraction on the resulting mass spectra has never been fully described, much less so in the case of biological tissue imaging. In the present work, a detailed study of the different primary ion beam focusing modes of a TOF‐SIMS instrument has been performed, with extensive comparisons of mass and spatial resolutions on rat cerebellum sections, and with the aim of obtaining with delayed extraction the best compromise between mass resolution, spatial resolution, and acquisition time.
Experimental
Rat cerebellum sections
Rat cerebellum sections (16 µm thick) were cut at −20 °C in a CM3050‐S cryostat (Leica Microsystèmes SAS, Nanterre, France) and immediately deposited on silicon wafers (2 in. diameter polished silicon wafers; ACM, Villiers‐Saint‐Frédéric, France). The sections were then dried under vacuum for 10 min before analysis.
TOF‐SIMS
Experiments were performed using a TOF‐SIMS IV mass spectrometer (see Fig. 1; ION‐TOF GmbH, Münster, Germany), located at the Institut de Chimie des Substances Naturelles (CNRS, Gif‐sur‐Yvette, France). This instrument is equipped with a LMIG which delivers a Bin q+ (with n = 1–7 and q = 1 or 2) pulsed cluster ion beam. Primary ions impact the sample with a kinetic energy of 25 qkeV at an incidence angle of 45°. All the experiments presented were carried out with Bi3 +. The emitted secondary ions were accelerated to a kinetic energy of 2 keV (2 kV extraction) toward a field‐free region and a single‐stage reflectron (first‐order compensation). Secondary ions were post‐accelerated to a kinetic energy of 10 keV before hitting the detector composed of a micro‐channel plate, a scintillator and a photomultiplier. Between two successive primary ion pulses, a low energy (~20 eV) electron flood gun was used to neutralize the sample surface. Pulsed primary ion currents were measured with a Faraday cup located on the grounded sample holder. For HCBU focusing mode, three lenses were used. For the BA focusing mode, only two lenses were used. Typically, the diameter of the beam in HCBU is 2–5 µm and 400 nm in BA mode.47
Figure 1.

Schematic view of a TOF‐SIMS IV instrument. VDP: Variable drift path.
Protocol for optimization of mass and spatial resolutions using a delayed extraction
To improve the mass resolution, a delayed extraction approach, already existing in the TOF‐SIMS setup, can be used. The extraction voltage is set to 2 kV, the rise time to 40 ns and the delay is adjustable between −5 µs and +20 µs in steps of 5 ns. The delayed extraction was tuned by measuring both the spatial resolution (‘knife edge method') and the mass resolution.
On the surface of a rat cerebellum section, images in positive and negative ion mode with an analyzed area of 100 µm × 100 µm and with a pixel size of 0.78 µm were recorded with a fluence of 2.25 × 10¹¹ ions⋅cm−2. The mass resolution of lipid ion peaks was measured for each image from a square (50 µm × 50 µm) in the center of the image. Step‐by‐step, the extraction delay was increased and for each new extraction delay the settings of the mass spectrometer were optimized. This included adjusting the voltages applied to the X and Y analyzer deflection plates, the voltage on the analyzer lens, and the variable drift path (VDP) voltage (Fig. 1). These optimizations ensured that the secondary ions are correctly collected and time focused on the detector allowing for high transmission and high mass resolution.48 Furthermore, the delayed extraction voltage modifies the beam raster area. Thus, the voltages applied to the so‐called X and Y sensitivity plates (not shown) need also to be adjusted. Each measurement was performed in triplicate.
In order to measure the spatial resolution, images with a fluence of 2 × 10¹² ions⋅cm−2 in both positive and negative ion mode with an analyzed area of 100 µm × 100 µm and a pixel size of 0.2 µm for HCBU and 0.1 µm for BA were recorded on the grounded 1000 lines per inch grid located on the sample holder. Line scans were performed perpendicular to the ion beam axis. Scanning the primary ion beam along a straight edge object allows the beam diameter to be measured, provided that the measurement step, which is defined by the pixel size, is much smaller.49, 50
Mass spectrometry imaging
On a rat cerebellum section, images in both negative and positive ion mode were acquired to evaluate each acquisition mode. The desired result is to distinguish Purkinje cells, which are very small structures present in the tissue.26, 51, 52, 53 An analyzed area of 400 µm × 400 µm and a pixel size of 0.4 µm were used in BA and in BA plus delayed extraction (BA+DE). In the HCBU operating mode, an analyzed area of 500 µm × 500 µm and a pixel size of 1.9 µm were chosen. The images were recorded with fluence of 5 × 10¹¹ ions⋅cm−2 in HCBU and of 2 × 10¹² ions⋅cm−2 in BA mode. Due to the very low initial kinetic energy distribution of the secondary ions,54 the relationship between the time of flight and the square root of the m/z value is always linear over the whole mass range. The mass calibration was always internal, and signals used for initial calibration were those of H+, H2 +, H3 +, C+, CH+, CH2 +, CH3 +, C2H3 + and C2H5 + for the positive ion mode in HCBU and BA acquisition and those of C−, CH−, CH2 −, C2 −, C3 − and C4H− for the negative polarity in HCBU and BA acquisition mode. As lighter ions (below m/z 20) in BA+DE acquisition mode are poorly collected by the mass spectrometer, the calibration was still internal with these settings but the signals used were those of C8H19PNO4 + (m/z 224.11), C27H45 + (m/z 369.35), C27H45O+ (m/z 385.35) and C29H50O2 +• (m/z 430.38) for the positive ion mode, and those of C16H31O2 − (m/z 255.23), C18H33O2 − (m/z 281.25), C18H35O2 − (m/z 283.26), C27H45O− (m/z 385.35) and C29H49O2 − (m/z 429.37) in negative ion mode.
Simulation
The ion trajectories and their TOFs were calculated by computer modeling using SIMION 8.1.1.32‐2013‐05‐20 (Scientific Instrument Services Inc., Ringoes, NJ, USA). The generated ions are evenly distributed from 0 to 100 ns in order to simulate the primary ion pulse duration. The ions are generated at a distance of 1.5 mm from the extraction cone, which is the same as in the instrument. The angular emittance of the ions is ±7° from a Gaussian distribution. The extraction voltage is 2 kV and the initial kinetic energies varied from 0.1 to 1.0 eV.
Results and Discussion
Delayed extraction optimization
The delayed extraction (DE) was tuned by measuring the mass resolution of several secondary ions detected from the surface of a rat cerebellum section. The optimum delay is determined by a compromise between the mass resolution and the total ion count rate, the peak shape being preserved. In the negative ion mode, mass resolutions of 10000 and 9000 are obtained for the palmitate [C16H31O2]− (m/z 255.2) and cholesterol [M–H]− (m/z 385.4) ions, respectively (Fig. 2(a)). In positive ion mode, mass resolutions of 10000 for both the cholesterol [M+H–H2O]+ ion (m/z 369.4) and the vitamin E [M]+• ion (m/z 430.4) were measured (Fig. 2(b)). Without DE being applied and in both positive and negative ion mode, the peaks at m/z 255.2, 369.4, 385.4 and 430.4 exhibit a width (FWHM) of ~100 ns, which corresponds to the pulse duration of the primary ions (See Supplementary Fig. S‐1, Supporting Information). This parameter strongly limits the mass resolution and the use of DE allows this physical limitation to be overcome.
Figure 2.
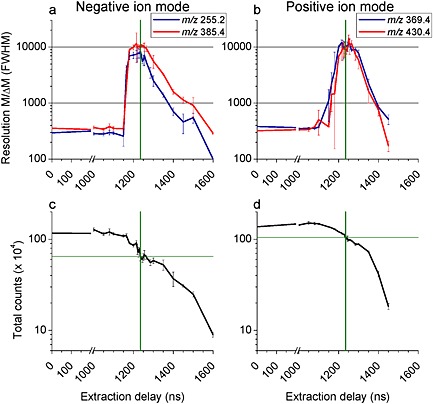
Mass resolutions (FWHM) measured for different secondary ions (a, b) and total ion count as a function of the extraction delay in negative (a, c) and positive (b, d) ion mode. Green lines are to guide the eye and show the optimum extraction delay of 1235 ns and the total ion count measured at this value. Pulse duration was 100 ns.
Another important parameter is the peak shape (Fig. 3). This allows for the exclusion of extraction delays for which a higher mass resolution is obtained but with asymmetric peaks.
Figure 3.

Overlays of four parts of negative ion mass spectra showing the cholesterol [M–H]− ion peak at m/z 385.4 acquired with different extraction delays.
The drawback of DE is a lower secondary ion transmission. As shown in Figs. 2(c) and 2(d), the ion peak intensities are half of those obtained without DE. This will be discussed further in the following section.
After optimization, the spatial resolution of each mode has been measured according to the knife edge method (see Supplementary Fig. S‐2, Supporting Information). The results are summarized in Table 1. A clear decrease in the beam diameter is observed when comparing HCBU and BA modes. However, a similar beam diameter of ~0.4 µm was measured in BA mode with or without the DE indicating that the DE is fully compatible with high lateral resolution. It must be also noted that there is no significant modification of the mass resolution caused by using the DE in the HCBU focusing mode (data not shown).
Table 1.
Main features of the three setting modes and consequent optimum parameters for data acquisition
| Focusing mode | HCBU | BA | BA+DE |
|---|---|---|---|
| Mass resolutiona (M/ΔM, Full Width at Half Maximum [FWHM]) | 5340 | 324 | 9270 |
| Beam size (µm) | 2.9 ± 0.2 | 0.45 ± 0.06 | 0.46 ± 0.07 |
| Extraction delay (ns) | 0 | 0 | 1235 |
| Pulsed primary ion currentb (pA) | 0.28 | 0.088 | 0.088 |
| Image size (µm) | 500 × 500 | 400 × 400 | 400 × 400 |
| Number of pixels and pixel size (µm) | 256 × 256 (1.95) | 1024 × 1024 (0.39) | 1024 × 1024 (0.39) |
| Primary ion dose (ions·cm−2) | 5 × 10¹¹ | 2 × 10¹² | 4 × 10¹² |
| Acquisition time (h) | ¼ | 2 | 4 |
Mass resolutions have been measured in a center square region of interest of 50 µm × 50 µm, in negative mode on the m/z 385.4 ion peak.
Primary ion current has been measured at a frequency of 10 kHz.
Simulation
Simulations of secondary ion trajectories were performed with the SIMION software. Figure 4 shows the normalized intensity as a function of the calculated TOF for ions with an m/z of 400 (time bin of 2 ns) with different extraction delays (50 ns, 100 ns, 150 ns, and 200 ns). For an extraction delay of 50 ns, the first emitted ions are well grouped in time, unlike the ions emitted after the extraction potential is applied. This means that the DE only groups the ions emitted during the first 50 ns, as the other ions are shifted as a function of the emission time. If the extraction delay corresponds exactly to the duration of ion production, all the ions are grouped together and a high resolution peak is obtained. Without an accelerating potential during the arrival of the primary ion pulse, the initial axial velocity of the ions leads to a distribution in the acceleration region and subsequently a distribution in TOF. This distribution in time and distance from the sample seems to be compensated for during the TOF. The compensation is related to the energy fixed by the potential corresponding to their position when the extraction potential is applied and the use of the reflectron. For example, for ions emitted normal to the surface at time zero with an initial energy of 0.5 eV, after 100 ns when the extraction voltage is applied: a m/z 1 ion will be ~1 mm from the surface and the potential at this distance is 1333 V, for a m/z 10 ion this distance will be ~300 µm with a potential of 410 V, and for a m/z 400 ion we obtain a distance of ~50 µm from the surface which would correspond to a potential of 66 V. If the extraction delay is longer than the primary pulse time, the dispersion in position induces a larger difference in energy which does not permit good time compensation, and leads to a tail towards longer TOFs.
Figure 4.
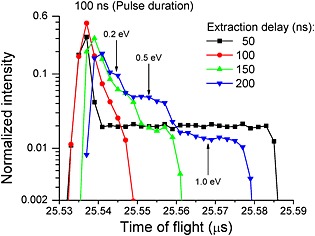
Simulated mass spectra of m/z 400 ions with different initial kinetic energy values (0.1, 0.2, 0.5 and 1.0 eV), produced during a burst length of 100 ns and extracted after a delay of 50 ns (black), 100 ns (red), 150 ns (green), and 200 ns (blue), respectively. Vertical arrows indicate, for 200 ns extraction delay, the groups of ions having initial kinetic energies of 0.2, 0.5, and 1.0 eV, respectively.
The optimum values of the DE, as revealed by these simulations, are significantly smaller than those obtained in the experimental measurements. This is because the instrumental delayed extraction times are calculated using time zero as the pulsation of the primary ions (chopper); the primary ion TOF from the chopper to the sample is thus incorporated into the extraction delay time, while the simulations do not incorporate this time. Therefore, the offset of the experimental extraction delay relative to the simulation values is the summation of the primary ion TOF and the rise time of the extraction pulse.
To determine this offset, the extraction delay was increased step‐by‐step until the peak of H− ion started to shift in time. This phenomenon appears between 1095 and 1100 ns (see Supplementary Fig. S‐3, Supporting Information). A linear regression was used to confirm the linear relation between the optimum extraction delay and the primary ion pulse duration. The offset value determined with this method is 1137 ± 8 ns (see Fig. 5). The difference of about 40 ns between these two values could correspond to the rise time of the extraction pulse. Using the value of 1137 ns as the offset between the experiment and the simulation, we find that the simulation would give an optimal delayed extraction time of 1237 ns for a pulse duration of 100 ns. Recalling that the optimum delayed extraction time determined experimentally was 1235 ns, we find excellent agreement between the simulation and the experiment.
Figure 5.

Optimum secondary ion extraction delay as a function of the pulse duration of primary ions burst. Equation of the calculated linear regression (solid line), with Ed, Extraction delay; Pd, Pulse duration; and R, coefficient of correlation.
Another simulation to investigate the effect of secondary ion initial kinetic energy on mass resolution was performed, where the analyzer acts as a kinetic energy filter. Supplementary Fig. S‐4 (Supporting Information) shows the arrival position of secondary ions on the surface of the micro‐channel plate (MCP). The ions with an m/z of 400 and a kinetic energy of 0.1 and 0.2 eV are well focused on the center of the MCP. On the contrary, the ions with larger kinetic energies of 0.5 and 1.0 eV have a larger spot size which is displaced from the center. The increased spot size and modified trajectory are a consequence of the higher initial velocity of these species, which have larger energy deficit due to their position when the extraction potential is applied. This phenomenon could be responsible for the observed decrease in total ion counts, although the secondary ion optics were optimized to maximize the total ion count rate.
Finally, the trajectories of ions at different mass‐to‐charge ratios with same kinetic energy of 0.1 eV were studied in BA+DE mode and with the optimum value of the extraction delay. Supplementary Fig. S‐5 (Supporting Information) shows that trajectories of ions with low mass‐to‐charge ratio are displaced from the center of the MCP. This result is similar to the previous case as the ions with higher initial velocities have larger energy deficits and thus their trajectories exiting the reflectron are displaced relative to lower kinetic energy ions. This result could explain why lighter ions (lower than m/z 20) are poorly detected with the DE as even low kinetic energy species obtain large energy deficits.
These low‐mass ions are usually used in TOF‐SIMS for the calibration of the mass spectra. Since the DE induces a kinetic energy deficit depending on the mass‐to‐charge ratio of the ions, the relationship between the measured TOF and the square root of the m/z is then not linear, especially for light ions, and thus the spectra could not be calibrated using these light mass ions. To obtain a sufficient mass accuracy (usually ~20–50 ppm for TOF‐SIMS analysis of tissue samples) for ions of interest, it is better to surround the peaks of interest with peaks of known masses, and adding an internal standard should be considered in future experiments.
Application to lipid imaging on rat cerebellum sections
Secondary ion images of the surface of rat cerebellums were recorded for all acquisition modes; the settings are detailed in Table 1. Figure 6 illustrates the differences in mass resolution between HCBU, BA and BA+DE modes in a selected region of the mass spectra, showing sulfatide ion peaks. The isotope peaks for the sulfatide ions cannot be resolved using the BA settings but are well separated in BA+DE mode. Similar results for fatty acids in negative ion mode and cholesterol and vitamin E in positive ion mode are shown in Supplementary Figs. S‐6 and S‐7 (Supporting Information), respectively.
Figure 6.
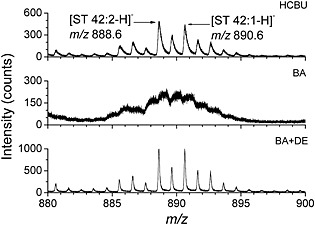
Part of the TOF‐SIMS negative ion mass spectra recorded at the surface of a rat cerebellum section, using HCBU, BA, and BA+DE setting modes and showing sulfatide ion peaks.
In order to illustrate the lateral resolution performances of each focusing mode, special attention was paid on the localization of Purkinje cells, which are localized in the gray matter.55, 56 These cells have an average size of about 20 µm and exhibit a specific lipid composition. Figure 7 shows three‐color overlays of ion images obtained for the [C18:0–H]− ion (m/z 283.3) in red, the [C16:0–H]− ion (m/z 255.2) in green, and the cholesterol [M–H]− ion (m/z 385.4) in blue, acquired in the three different modes. In Fig. 7(a) (HCBU), while it is possible to distinguish the different histological areas of the cerebellum, the Purkinje cells, defined by a higher intensity of the [C18:0–H]− ion signal in red, are poorly resolved. In the zoom of Fig. 7(a) (shown in Fig. 7(d)), individual pixels are clearly visible. Figures 7(b) and 7(c) show the images recorded using the BA and BA+DE modes, respectively. Under these conditions, the Purkinje cells are well defined and fine details of the tissue structure can be distinguished, due to a sub‐µm lateral resolution.
Figure 7.

TOF‐SIMS negative ion images recorded at the surface of a rat cerebellum and with different setting modes, showing three color overlays between three different secondary ions: [C18:0–H]− m/z 283.3 (red), [C16:0–H]− m/z 255.2 (green), and cholesterol [M–H]− m/z 385.4 (blue). (a) HCBU, (b) BA, (c) BA+DE. (d, e, and f) zooms of the 100 µm × 100 µm center part of a, b, and c ion images, respectively. Arrows in the images show some Purkinje cells. Analyzed area and number of pixels according to Table 1. The ion image in HCBU has been cropped at a dimension of 400 µm × 400 µm to be directly compared with the other ion images.
Conclusions
Although the use of a delayed extraction has been known for many years and is very popular in MALDI, it has been used much less in TOF‐SIMS. Its utilization now enables secondary ion images of molecule‐related ions to be recorded with submicron spatial resolution and a mass resolution of several thousand in a single run. Simulation shows that the optimal extraction delay needs to be equal to the primary ion pulse duration, and an excellent agreement is found by experiment. However, the use of the BA+DE setting mode requires a larger primary ion dose density in order to obtain ion images with intensity scales comparable with those recorded with the other modes, such as HCBU.
Another way to obtain high mass resolution and spatial resolution together is to acquire HCBU and BA images on the same area, successively.15, 28 However, switching from one mode to another takes significant time, especially if a large number of acquisitions is needed, and often the mass assignment is not precise enough with the poor mass resolution obtained in BA mode. In such cases the use of delayed extraction is a better choice, particularly when analyzing rare, precious, or very small samples, such as archeological samples or painting cross‐sections.
Supporting information
Supporting info item
Acknowledgements
Felix Kollmer (ION‐TOF GmbH) is gratefully acknowledged for fruitful discussions. This work has benefited from an 'Investissement d'Avenir' grant managed by Agence Nationale de la Recherche (CEBA, ref. ANR‐10‐LABX‐25‐01). Q.P.V. is indebted to the Fondation pour le développement de la chimie des substances naturelles et ses applications for a PhD research fellowship. M.J.E. would like to thank P2IO LabEx for financing his post‐doctoral fellowship in the framework of the Andromede project (ANR‐13‐EQPX‐10).
Vanbellingen, Q. P. , Elie, N. , Eller, M. J. , Della‐Negra, S. , Touboul, D. , and Brunelle, A. (2015), Time‐of‐flight secondary ion mass spectrometry imaging of biological samples with delayed extraction for high mass and high spatial resolutions. Rapid Commun. Mass Spectrom., 29, 1187–1195. doi: 10.1002/rcm.7210.
References
- 1. Castaing R., Slodzian G.. Microanalyse par émission secondaire. J. Microsc. 1962, 1, 395. [Google Scholar]
- 2. Touboul D., Laprévote O., Brunelle A.. Medical and biological applications of cluster ToF‐SIMS, in TOF‐SIMS: Materials Analysis by Mass Spectrometry, (2nd edn), (Eds: Vickerman J. C., Briggs D.). IM Publications, Chichester, 2013, pp. 583–612. [Google Scholar]
- 3. Winograd N.. Imaging mass spectrometry on the nanoscale with cluster ion beams. Anal. Chem. 2015, 87, 328. [DOI] [PMC free article] [PubMed] [Google Scholar]
- 4. Bich C., Touboul D., Brunelle A.. Cluster TOF‐SIMS imaging as a tool for micrometric histology of lipids in tissue. Mass Spectrom. Rev. 2014, 33, 442. [DOI] [PubMed] [Google Scholar]
- 5. Touboul D., Roy S., Germain D. P., Chaminade P., Brunelle A., Laprévote O.. MALDI‐TOF and cluster‐TOF‐SIMS imaging of Fabry disease biomarkers. Int. J. Mass Spectrom. 2007, 260, 158. [Google Scholar]
- 6. Touboul D., Brunelle A., Halgand F., De La Porte S., Laprévote O.. Lipid imaging by gold cluster time‐of‐flight ‐ secondary ion mass spectrometry: application to Duchenne muscular dystrophy. J. Lipid Res. 2005, 46, 1388. [DOI] [PubMed] [Google Scholar]
- 7. Debois D., Bralet M. P., Le Naour F., Brunelle A., Laprévote O.. In situ lipidomic analysis of non‐alcoholic fatty liver by cluster TOF‐SIMS imaging. Anal. Chem. 2009, 81, 2823. [DOI] [PubMed] [Google Scholar]
- 8. Solé‐Domènech S., Sjövall P., Vukojević V., Fernando R., Codita A., Salve S., Bogdanović N., Mohammed H. A., Hammarström P., Nilsson K. P. R., LaFerla M. F., Jacob S., Berggren P. O., Giménez‐Llort L., Schalling M., Terenius L., Johansson B.. Localization of cholesterol, amyloid and glia in Alzheimer's disease transgenic mouse brain tissue using time‐of‐flight secondary ion mass spectrometry (ToF‐SIMS) and immunofluorescence imaging. Acta Neuropathol. 2013, 125, 145. [DOI] [PubMed] [Google Scholar]
- 9. Seyer A., Einhorn J., Brunelle A., Laprévote O.. Localization of flavonoids in seeds by cluster time‐of‐flight secondary ion mass spectrometry imaging. Anal. Chem. 2010, 82, 2326. [DOI] [PubMed] [Google Scholar]
- 10. Saito K., Mitsutani T., Imai T., Matsushita Y., Fukushima K.. Discriminating the indistinguishable sapwood from heartwood in discolored ancient wood by direct molecular mapping of specific extractives using time‐of‐flight secondary ion mass spectrometry. Anal. Chem. 2008, 80, 1552. [DOI] [PubMed] [Google Scholar]
- 11. Debois D., Hamze K., Guérineau V., Le Caër J. P., Holland I. B., Lopes P., Ouazzani J., Séror S. J., Brunelle A., Laprévote O.. In situ localization and quantification of surfactins in a Bacillus subtilis swarming community by imaging mass spectrometry. Proteomics 2008, 8, 3682. [DOI] [PubMed] [Google Scholar]
- 12. Richardin P., Mazel V., Walter P., Laprévote O., Brunelle A.. Identification of different copper green pigments in Renaissance paintings by cluster‐TOF‐SIMS imaging analysis. J. Am. Soc. Mass Spectrom. 2011, 22, 1729. [DOI] [PubMed] [Google Scholar]
- 13. Mazel V., Richardin P., Touboul D., Brunelle A., Richard C., Laval E., Walter P., Laprévote O.. Animal urine as painting materials in African rock art revealed by cluster ToF‐SIMS mass spectrometry imaging. J. Mass Spectrom. 2010, 45, 944. [DOI] [PubMed] [Google Scholar]
- 14. Sjövall P., Lausmaa J., Nygren H., Carlsson L., Malmberg P.. Imaging of membrane lipids in single cells by imprint‐imaging time‐of‐flight secondary ion mass spectrometry. Anal. Chem. 2003, 75, 3097. [DOI] [PubMed] [Google Scholar]
- 15. Leefmann T., Heim C., Kryvenda A., Siljeström S., Sjövall P., Thiel V.. Biomarker imaging of single diatom cells in a microbial mat using time‐of‐flight secondary ion mass spectrometry (ToF‐SIMS). Org. Geochem. 2013, 57, 23. [Google Scholar]
- 16. Stephan T., Jessberger E. K., Heiss C. H., Rost D.. TOF‐SIMS analysis of polycyclic aromatic hydrocarbons in Allan Hills 84001. Meteorit. Planet. Sci. 2003, 38, 109. [Google Scholar]
- 17. Cersoy C., Richardin P., Walter P., Brunelle A.. Cluster TOF‐SIMS imaging of human skin remains: analysis of a South‐Andean mummy sample. J. Mass Spectrom. 2012, 47, 338. [DOI] [PubMed] [Google Scholar]
- 18. Mazel V., Richardin P., Debois D., Touboul D., Cotte M., Brunelle A., Walter P., Laprévote O.. Identification of ritual blood in African artifacts using TOF‐SIMS and synchrotron radiation microspectroscopies. Anal. Chem. 2007, 79, 9253. [DOI] [PubMed] [Google Scholar]
- 19. McDonnell L. A., Heeren R. M. A.. Imaging mass spectrometry. Mass Spectrom. Rev. 2007, 26, 606. [DOI] [PubMed] [Google Scholar]
- 20. Spengler B.. Mass spectrometry imaging of biomolecular information. Anal. Chem. 2015, 87, 64. [DOI] [PubMed] [Google Scholar]
- 21. Lechene C. P., Luyten Y., McMahon G., Distel D. L.. Quantitative imaging of nitrogen fixation by individual bacteria within animal cells. Science 2007, 317, 1563. [DOI] [PubMed] [Google Scholar]
- 22. Zhang D. S., Piazza V., Perrin B. J., Rzadzinska A. K., Poczatek J. C., Wang M., Prosser H. M., Ervasti J. M., Corey D. P., Lechene C. P.. Multi‐isotope imaging mass spectrometry reveals slow protein turnover in hair‐cell stereocilia. Nature 2012, 481, 520. [DOI] [PMC free article] [PubMed] [Google Scholar]
- 23. Sodhi R. N. S.. Time‐of‐flight secondary ion mass spectrometry (TOF‐SIMS): versatility in chemical and imaging surface analysis. Analyst 2004, 129, 483. [DOI] [PubMed] [Google Scholar]
- 24. Touboul D., Kollmer F., Niehuis E., Brunelle A., Laprévote O.. Improvement of biological TOF‐SIMS imaging with a bismuth cluster ion source. J. Am. Soc. Mass Spectrom. 2005, 16, 1608. [DOI] [PubMed] [Google Scholar]
- 25. Brunelle A., Touboul D., Laprévote O.. Biological tissue imaging with time‐of‐flight secondary ion mass spectrometry and cluster ion sources. J. Mass Spectrom. 2005, 40, 985. [DOI] [PubMed] [Google Scholar]
- 26. Nygren H., Malmberg P., Kriegeskotte C., Arlinghaus H. F.. Bioimaging TOF‐SIMS: localization of cholesterol in rat kidney sections. FEBS Lett. 2004, 566, 291. [DOI] [PubMed] [Google Scholar]
- 27. Nygren H., Börner K., Hagenhoff B., Malmberg P., Månsson J. E.. Localization of cholesterol, phosphocholine and galactosylceramide in rat cerebellar cortex with imaging TOF‐SIMS equipped with a bismuth cluster ion source. Biochim. Biophys. Acta 2005, 1737, 102. [DOI] [PubMed] [Google Scholar]
- 28. Pernber Z., Richter K., Mansson J. E., Nygren H.. Sulfatide with different fatty acids has unique distributions in cerebellum as imaged by time‐of‐flight secondary ion mass spectrometry (TOF‐SIMS). Biochim. Biophys. Acta 2007, 1771, 202. [DOI] [PubMed] [Google Scholar]
- 29. Brison J., Robinson M. A., Benoit D. S. W., Muramoto S., Stayton P. S., Castner D. G.. TOF‐SIMS 3D imaging of native and non‐native species within HeLa cells. Anal. Chem. 2013, 85, 10869. [DOI] [PMC free article] [PubMed] [Google Scholar]
- 30. Holzlechner G., Kubicek M., Hutter H., Fleig J.. A novel ToF‐SIMS operation mode for improved accuracy and lateral resolution of oxygen isotope measurements on oxides. J. Anal. Atom. Spectrom. 2013, 28, 1080. [Google Scholar]
- 31. Kubicek M., Holzlechner G., Opitz A. K., Larisegger S., Hutter H., Fleig J.. A novel ToF‐SIMS operation mode for sub 100 nm lateral resolution: Application and performance. Appl. Surf. Sci. 2014, 289, 407. [DOI] [PMC free article] [PubMed] [Google Scholar]
- 32. Carado A., Passarelli M. K., Kozole J., Wingate J. E., Winograd N., Loboda A. V.. C60 secondary ion mass spectrometry with a hybrid‐quadrupole orthogonal time‐of‐flight mass spectrometer. Anal. Chem. 2008, 80, 7921. [DOI] [PMC free article] [PubMed] [Google Scholar]
- 33. Fletcher J. S., Vickerman J. C.. A new SIMS paradigm for 2D and 3D molecular imaging of bio‐systems. Anal. Bioanal. Chem. 2010, 396, 85. [DOI] [PubMed] [Google Scholar]
- 34. Fletcher J. S., Lockyer N. P., Vickerman J. C.. Developments in molecular SIMS depth profiling and 3D imaging of biological systems using polyatomic primary ions. Mass Spectrom. Rev. 2011, 30, 142. [DOI] [PubMed] [Google Scholar]
- 35. Fletcher J. S., Vickerman J. C.. Secondary ion mass spectrometry: characterizing complex samples in two and three dimensions. Anal. Chem. 2013, 85, 610. [DOI] [PubMed] [Google Scholar]
- 36. Fletcher J. S., Rabbani S., Henderson A., Blenkinsopp P., Thompson S. P., Lockyer N. P., Vickerman J. C.. A new dynamic in mass spectral imaging of single biological cells. Anal. Chem. 2008, 80, 9058. [DOI] [PubMed] [Google Scholar]
- 37. Wiley W. C., McLaren I. H.. Time‐of‐flight mass spectrometer with improved resolution. Rev. Sci. Instrum. 1955, 26, 1150. [Google Scholar]
- 38. Vestal M. L., Juhasz P., Martin S. A.. Delayed extraction matrix‐assisted laser desorption time‐of‐flight mass spectrometry. Rapid Commun. Mass Spectrom. 1995, 9, 1044. [Google Scholar]
- 39. Juhasz P., Vestal M. L., Martin S. A.. On the initial velocity of ions generated by matrix‐assisted laser desorption ionization and its effect on the calibration of delayed extraction time‐of‐flight mass spectra. J. Am. Soc. Mass Spectrom. 1997, 8, 209. [Google Scholar]
- 40. Hanay L. L., Riederer D. E.. Delayed extraction for improved resolution of ion/surface collision products by time‐of‐flight mass spectrometry. Anal. Chim. Acta 1999, 397, 225. [Google Scholar]
- 41. Sostarecz A. G., McQuaw C. M., Wucher A., Winograd N.. Depth profiling of Langmuir‐Blodgett films with a buckminsterfullerene probe. Anal. Chem. 2004, 76, 6651. [DOI] [PubMed] [Google Scholar]
- 42. Cheng J., Winograd N.. Depth profiling of peptide films with TOF‐SIMS and a C60 probe. Anal. Chem. 2005, 77, 3651. [DOI] [PubMed] [Google Scholar]
- 43. Parry S., Winograd N.. High‐resolution TOF‐SIMS imaging of eukaryotic cells preserved in a trehalose matrix. Anal. Chem. 2005, 77, 7950. [DOI] [PubMed] [Google Scholar]
- 44. Baryshev S. V., Zinovev A. V., Tripa C. E., Pellin M. J., Peng Q., Elam J. W., Veryovkin I. V.. High‐resolution secondary ion mass spectrometry depth profiling of nanolayers. Rapid Commun. Mass Spectrom. 2012, 26, 2224. [DOI] [PubMed] [Google Scholar]
- 45. King A., Henkel T., Rost D., Lyon I. C.. Determination of relative sensitivity factors during secondary ion sputtering of silicate glasses by Au+, Au2 + and Au3 + ions. Rapid Commun. Mass Spectrom. 2010, 24, 15. [DOI] [PubMed] [Google Scholar]
- 46. Lee J. L. S., Gilmore I. S., Seah M. P., Fletcher I. W.. Topography and field effects in secondary ion mass spectrometry – Part I: Conducting samples. J. Am. Soc. Mass Spectrom. 2011, 22, 1718. [DOI] [PubMed] [Google Scholar]
- 47. Noun M.. Interaction agrégats‐surface. Spectrométrie de masse par temps de vol et application analytique à des études sur des médicaments et sur la météorite Paris. PhD Dissertation [Online], Université Paris Sud – Paris XI, November, 2013. https://tel.archives‐ouvertes.fr/tel‐00906791 (accessed Feb 9, 2015)
- 48. Guilhaus M.. Principles and instrumentation in time‐of‐flight mass spectrometry. J. Mass. Spectrom. 1995, 30, 1519. [Google Scholar]
- 49. Senoner M., Wirth T., Unger W. E. S.. Imaging surface analysis: Lateral resolution and its relation to contrast and noise. J. Anal. At. Spectrom. 2010, 25, 1440. [Google Scholar]
- 50. Ishii Y., Isoya A., Kojima T., Arakawa K.. Estimation of keV submicron ion beam width using a knife‐edge method. Nucl. Instrum. Methods Phys. Res., Sect. B 2003, 211, 415. [Google Scholar]
- 51. Benabdellah F., Seyer A., Quinton L., Touboul D., Brunelle A., Laprévote O.. Mass spectrometry imaging of rat brain sections: nanomolar sensitivity with MALDI versus nanometre resolution by TOF‐SIMS. Anal. Bioanal. Chem. 2010, 396, 151. [DOI] [PubMed] [Google Scholar]
- 52. Richter K., Nygren H., Malmberg P., Hagenhoff B.. Localization of fatty acids with selective chain length by imaging time‐of‐flight secondary ion mass spectrometry. Microsc. Res. Tech. 2007, 70, 640. [DOI] [PubMed] [Google Scholar]
- 53. Sugiura Y., Konishi Y., Zaima N., Kajihara S., Nakanishi H., Taguchi R., Setou M.. Visualization of the cell‐selective distribution of PUFA‐containing phosphatidylcholines in mouse brain by imaging mass spectrometry. J. Lipid Res. 2009, 50, 1776. [DOI] [PMC free article] [PubMed] [Google Scholar]
- 54. Veryovkin I. V., Belykh S. F., Adriaens A., Zinovev A. V., Adams F.. On the trends in kinetic energies of secondary ions produced by polyatomic ion bombardment. Appl. Surf. Sci. 2004, 231/232, 101. [Google Scholar]
- 55. Sjövall P., Lausmaa J., Johansson B.. Mass spectrometric imaging of lipids in brain tissue. Anal. Chem. 2004, 76, 4271. [DOI] [PubMed] [Google Scholar]
- 56. Nygren H., Börner K., Malmberg P., Hagenhoff B.. Localization of cholesterol in rat cerebellum with imaging TOF‐SIMS: Effect of tissue preparation. Appl. Surf. Sci. 2006, 252, 6975. [Google Scholar]
Associated Data
This section collects any data citations, data availability statements, or supplementary materials included in this article.
Supplementary Materials
Supporting info item