

Abstract
Aims
The aim of this study was to examine the relationship between a specific glycated haemoglobin (HbA1c) measurement and a pharmaceutical dispensings‐based measure of adherence calculated over the 90 days before each HbA1c measure among patients who have newly initiated metformin therapy.
Methods
We identified 3109 people with type 2 diabetes who initiated metformin as their first‐ever antihyperglycaemic drug, analysing all 9918 HbA1c measurements that were taken over the next 2 years. We used an adaptation of the ‘proportion of days covered’ method for assessing medication adherence that corresponded to an ∼90‐day interval preceding an HbA1c measurement, terming the adaptation the ‘biological response‐based proportion of days covered’ (BRB‐PDC). To account for multiple observations per patient, we analysed the association between HbA1c and BRB‐PDC within the generalized estimating equation framework. Analyses were stratified by HbA1c level before metformin initiation using a threshold of 8% (64 mmol/mol).
Results
After multivariable adjustment using 0% adherence as the reference category, BRB‐PDC in the range 50–79% was associated with HbA1c values lower by −0.113 [95% confidence interval (CI) −0.202, −0.025] among patients with pre‐metformin HbA1c <8%, and by −0.247 (95% CI −0.390, −0.104) among those with HbA1c ≥8% at metformin initiation. Full adherence (≥80%) was associated with HbA1c values lower by −0.175% (95% CI −0.257, −0.093) and by −0.453% (95% CI −0.586, −0.320).
Conclusions
Using this novel short‐interval approach that more closely associates adherence with the expected biological response, the association between better adherence and HbA1c levels was considerably stronger than has been previously reported; however, the strength of the impact was dependent upon the HbA1c level before initiating metformin.
Keywords: glycaemic control, metformin, observational study, pharmaco‐epidemiology
Introduction
Type 2 diabetes usually requires pharmacological therapy to manage hyperglycaemia. Indeed, the American Diabetes Association recommends initiation of metformin at the time of diagnosis 1. The effectiveness of any pharmacotherapy requires that the patient take the drug as prescribed, yet people with diabetes often do not adhere to their treatment regimen, with estimates of adherence ranging from 36 to 93% 2. A number of methods of measuring adherence using electronic prescription refill data have been proposed, almost all of which calculate mean prescription refill behaviour over a 6–12 month period, and validate the measure through association with a biological response to the medication, such as glycated haemoglobin (HbA1c) level, typically expressed as a mean over the same period of observation 3. As a result, most previous studies of the impact of adherence on glycaemic control report small effects, with every 10% increase in adherence associated with a decrease of 0.1–0.3% in HbA1c levels 4.
This approach ignores the clinical reality that both adherence and HbA1c may vary substantially over time. Furthermore, adherence measures calculated over extended time periods may be of limited use to the practising clinician because they are not readily interpretable at the point of care, when the clinician and patient are generally focused on recent behaviour and glycaemic control. A more limited time frame for estimating adherence could even allow the clinician to perform a rapid mental calculation to inform therapeutic adjustment. Moreover, because HbA1c is a measure of exposure to glycaemia over the life of the red blood cell, an HbA1c typically represents the glycaemic level over a 90‐day period 5; thus, an adherence measure based on an interval that is more directly related to the biological response to therapy is intuitively appealing. To our knowledge, only one previous study has examined the effect of adherence to antihyperglycaemic medication over the same ∼90‐day period represented by an HbA1c value 6. That study found a small, albeit significant, relationship between adherence and HbA1c, but may have been confounded by the inclusion of multiple oral antihyperglycaemic agents used alone or in combination. The aim of the present study, therefore, was to examine the relationship between a specific HbA1c measurement and a measure of adherence calculated over the preceding 90 days among patients who newly initiated metformin therapy.
Materials and Methods
We conducted a retrospective cohort study of patients with type 2 diabetes within the Kaiser Permanente Northwest (KPNW) integrated health system. KPNW provides comprehensive medical care to ∼480 000 individuals in and around the Portland, Oregon service area. Since 1996, all medical utilization, including inpatient admissions, outpatient visits, laboratory values and pharmaceutical prescription fills, have been captured in electronic medical records.
For the present study, we identified patients with type 2 diabetes who initiated metformin as their first ever antihyperglycaemic drug between 1 January 2007 and 31 December 2011, and who had at least one HbA1c measurement taken <6 months before metformin initiation and a second HbA1c measurement taken between 6 and 12 months after metformin initiation. We defined the pre‐metformin HbA1c level as the baseline HbA1c. To allow time for metformin to become therapeutically effective, each patient's observation period began with the first HbA1c measurement after 6 months of newly initiated metformin monotherapy and continued for up to 2 years, with censoring if the patient died, disenrolled from the health plan or initiated additional antihyperglycaemic therapy. For each of the 3109 individuals who met these criteria, we included all 9918 HbA1c values that were taken >3 months apart during the 18‐month period of observation. Thus, patients with no filled prescriptions of metformin after the initial fill were still included, unless they initiated another agent, and all patients could contribute multiple observations to the analyses.
Modification of the Adherence Measure
We calculated adherence to metformin over the ∼90‐day period preceding each eligible HbA1c observation using a modification of the proportion of days covered (PDC) method using pharmacy prescription fill data. The traditional PDC method measures the average of the proportion of prescribed days' supply obtained from all medication fills during a defined interval with a maximum allowable value of 100% 3. We adapted the PDC method to time intervals that corresponded to an ∼90‐day interval preceding an HbA1c measurement, terming the adaptation the ‘biological response‐based proportion of days covered’ (BRB‐PDC). Figure 1 is a hypothetical depiction of two HbA1c measurements for a single individual that graphically portrays the calculation of PDC by the traditional method and by the BRB‐PDC method. In the traditional PDC calculation, this hypothetical individual would contribute a single observation over the year‐long period to an analysis of the association between mean PDC and mean HbA1c. In the example, PDC calculated over the entire year was 81% with a mean HbA1c calculated from the two measurements of 7.4%. By contrast, using the BRB‐PDC method, the individual in the example would contribute two observations to the analysis. The first would be a BRB‐PDC value equal to 100% based on the ∼90‐day period before the April HbA1c measurement of 6.4%, and the second would be a BRB‐PDC of 25%, based on the ∼90‐day period before the September HbA1c of 8.4%. This hypothetical example shows that the temporary but substantial drop in adherence was associated with a clinically expected increase in HbA1c, a relationship not captured by the traditional approach to calculating the PDC/HbA1c association.
Figure 1.
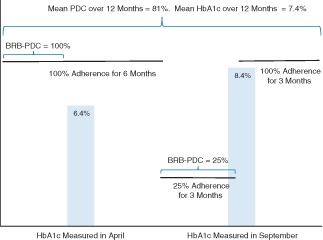
Example of the calculation of the proportion of days covered (PDC) method compared with the biological response‐based proportion of days covered (BRB‐PDC) method for a hypothetical patient with two glycated haemoglobin (HbA1c) measurements in a calendar year.
Calculating Adherence
Because pharmaceutical refills and HbA1c measurements rarely occur simultaneously or at precise 90‐day intervals, accurately capturing days' supply to include in the BRB‐PDC calculation required that we extend the 90‐day interval to include the days' supply of all prescription fills that began or ended in the 90 days preceding an included HbA1c measurement. We therefore included prescription fills and days' supply of any prescription that occurred >90 days before the HbA1c measurement if the days' supply extended into the HbA1c period. In addition, we included the days' supply of the last dispensing before the HbA1c measurement that extended beyond the HbA1c measurement date. These methods allowed us to include all gaps in supply during BRB‐PDC estimates that began or ended during the HbA1c period. As a result, the period used for calculating BRB‐PDC values ranged from 90 to 370 days, but the mean number of days used in the BRB‐PDC estimates was 127 days and 90% of the values were ≤180 days.
Statistical Analyses
The distribution of the BRB‐PDC variable was highly concentrated on the extreme values (Figure S1), making it ill‐suited for analysis as a continuous measure; therefore, we analysed BRB‐PDC as a categorical and/or dichotomous variable. In our primary analysis, we considered four categories of BRB‐PDC: 0, 1–49, 50–79 and ≥80% (full adherence using the PDC method is typically defined as ≥80% 3). To further explore the discrete effects of adherence, we re‐categorized BRB‐PDC into 10% intervals from 50 to 90%, using 0–49% as the reference group. All analyses were performed with sas, version 9.3 (SAS Institute, Cary, NC, USA) using proc genmod with either an identity or logit link function to account for multiple observations within patients. We found a strong interaction between BRB‐PDC and HbA1c before metformin initiation, suggesting that this relationship varied by pre‐treatment level of HbA1c. We therefore stratified the analyses by prior HbA1c using a threshold of 8%. There were 1770 patients with HbA1c <8% before initiating metformin, and these patients had 5896 HbA1c measurements used in the analyses. There were 1330 patients with HbA1c ≥8% before initiating metformin, and these patients had 4022 HbA1c measurements used in the analyses.
Potential covariates included HbA1c before metformin initiation, as well as demographic and clinical characteristics that could be associated with HbA1c. Although it was theoretically possible to re‐assess the covariates at every HbA1c measurement, we found little variation in the relationships from measurement to measurement. We thus measured covariates at baseline during the 6 months preceding the beginning of the observation period. We tested the baseline relationships between HbA1c and the covariates univariately and included the variables as fixed effects in the final model if they were significant at p < 0.10.
Results
We identified 3109 people who met the study criteria. The mean (standard deviation) age of the study population was 58.5 (11.7) years and 54% were men (Table 1). As new metformin initiators, more than half (55.6%) had a duration of diabetes <1 year. The mean HbA1c before initiating metformin was 8.2%. All covariates were significantly associated with HbA1c levels except smoking, systolic blood pressure <130 mmHg, presence of ischaemic heart disease, heart failure and retinopathy, and use of angiotensin‐converting enzyme inhibitors or angiotensin receptor blockers. A total of 9918 HbA1c values for the 3109 patients were included in the analyses. The mean (range) number of HbA1c values per patient was 3.2 (1–8).
Table 1.
Mean (standard deviation) values or percentages and univariate associations of baseline characteristics of individuals (n = 3109) with all observed HbA1c measurements (n = 9918)
| Baseline characteristic | Mean (s.d.) or % | Estimate | 95% CI | p |
|---|---|---|---|---|
| Age | 58.5 (11.7) | −0.172 | −0.205, −0.139 | <0.001 |
| % male | 54.0 | 0.227 | 0.153, 0.301 | <0.001 |
| % non‐white | 12.7 | −0.249 | −0.354, −0.144 | <0.001 |
| Duration of diabetes | 2.0 (2.8) | 0.018 | 0.006, 0.030 | 0.003 |
| Duration of diabetes <1 year | 55.6 | −0.195 | −0.269, −0.121 | <0.001 |
| HbA1c at metformin initiation | 8.2% (1.7) | 0.188 | 0.157, 0.219 | <0.001 |
| Months since first metformin dispense | 8.7 (1.8) | 0.055 | 0.034, 0.076 | <0.001 |
| Current smoker | 12.7 | 0.044 | −0.072, 0.160 | 0.463 |
| Systolic blood pressure (per 10 mmHg) | 131 (16) | 0.047 | 0.029, 0.065 | <0.001 |
| Systolic blood pressure <130 mmHg | 41.0 | −0.022 | −0.098, 0.054 | 0.565 |
| LDL cholesterol (per 0.26 mmol/l) | 2.7 (0.9) | 0.029 | 0.020, 0.039 | <0.001 |
| LDL cholesterol <2.6 mmol/l | 43.6 | −0.147 | −0.221, −0.073 | <0.001 |
| Ischaemic heart disease | 13.7 | −0.036 | −0.136, 0.064 | 0.475 |
| Heart failure | 4.8 | −0.069 | −0.227, 0.089 | 0.394 |
| Depression | 28.9 | −0.117 | −0.197, −0.037 | 0.004 |
| Retinopathy | 1.8 | 0.13 | −0.091, 0.351 | 0.252 |
| Neuropathy | 8.1 | −0.157 | −0.280, −0.034 | 0.013 |
| Chronic kidney disease | 6.6 | −0.264 | −0.378, −0.150 | <0.001 |
| ACE/ARB use | 63.9 | −0.019 | −0.099, 0.061 | 0.652 |
| β‐blocker use | 35.5 | −0.183 | −0.257, −0.109 | <0.001 |
| Other antihypertensive use | 39.9 | −0.233 | −0.306, −0.160 | <0.001 |
| Statin use | 66.7 | −0.073 | −0.156, 0.010 | 0.087 |
| Total number of medication classes | 8.5 (4.1) | −0.033 | −0.042, −0.024 | <0.001 |
| Total number of medication classes ≥5 | 85.1 | −0.237 | −0.354, −0.120 | <0.001 |
| Body mass index* | 35.7 (7.8) | 0.007 | 0.002, 0.012 | 0.008 |
ACE, angiotensin‐converting enzyme; ARB, angiotensin receptor blocker; CI, confidence interval; HbA1c, glycated haemoglobin; s.d., standard deviation.
Data missing for 107 individuals and 323 observations.
Table 2 shows the results of stratified models of the association between HbA1c values and their corresponding BRB‐PDC values. The estimate column represents the difference in HbA1c between 0% adherence (reference) and other categories of adherence. For example, among patients with a pre‐metformin HbA1c of <8% (n = 1770), there were 3529 HbA1c measurements with an associated BRB‐PDC of ≥80%. The mean HbA1c values for those observations were 0.175% lower [estimate −0.175; 95% confidence interval (CI) −0.257, −0.093] than the 1089 HbA1c values with an associated 0% adherence (reference category). Note that these are absolute percentage point values, e.g. 7 versus 7.175%. Thus, adherence between 1 and 49% was not significantly associated with HbA1c, regardless of pre‐metformin HbA1c. Adherence of 50–79% was associated with HbA1c values that were 0.113% lower (−0.113; 95% CI −0.202, −0.025) among patients with pre‐metformin HbA1c <8%, and 0.247% lower (−0.247; 95% CI −0.390, −0.104) among those with HbA1c ≥8% at metformin initiation. The largest difference was seen among patients with pre‐metformin HbA1c ≥8% (n = 1330) and their 2514 HbA1c values that were preceded by adherence ≥80%, where mean HbA1c was 0.453% lower than the reference category (−0.453; 95% CI −0.586, −0.320). Estimates of the covariates are shown in Table S1. Older age and shorter duration of diabetes were significantly associated with lower HbA1c values, while male sex and longer time since the first metformin dispense were significantly associated with higher HbA1c values.
Table 2.
Results of generalized estimating equation models of the association between the biological response‐based proportion of days covered and glycated haemoglobin (HbA1c) level, stratified by HbA1c level before metformin initiation, adjusted for covariates
| Pre‐metformin HbA1c <8% (1770 patients) | Pre‐metformin HbA1c >8% (1330 patients) | |||||||
|---|---|---|---|---|---|---|---|---|
| HbA1c values | Estimate | 95% CI | p | HbA1c values | Estimate | 95% CI | p | |
| BRB‐PDC | ||||||||
| 0% | 1089 | Reference | — | — | 585 | Reference | — | — |
| 1–49% | 336 | −0.107 | −0.225, 0.011 | 0.077 | 240 | 0.043 | −0.149, 0.236 | 0.659 |
| 50–79% | 942 | −0.113 | −0.202, −0.025 | 0.012 | 683 | −0.247 | −0.390, −0.104 | <0.001 |
| ≥80% | 3529 | −0.175 | −0.257, −0.093 | <0.001 | 2514 | −0.453 | −0.586, −0.320 | <0.001 |
BRB‐PDC, biological response‐based proportion of days covered; CI, confidence interval; HbA1c, glycated haemoglobin.
The results of re‐categorizing adherence into 10% bands of BRB‐PDC using 0–49% as the reference category are shown in Table 3. HbA1c values associated with BRB‐PDC 50–59% were not significantly different from those associated with BRB‐PDC 0–49%. Among patients with HbA1c <8% at metformin initiation (n = 1770), all HbA1c values that corresponded to higher BRB‐PDC results were significantly associated with lower HbA1c values. The 2913 HbA1c values that were preceded by BRB‐PDC >90% were associated with 0.151% lower HbA1c values (−0.151; 95% CI −0.216, −0.087) compared with BRB‐PDC in the range 0–49%. Larger effects were seen among the 1330 patients with pre‐metformin HbA1c ≥ 8%, where the 478 HbA1c values with a BRB‐PDC in the range 80–89% were associated with HbA1c values that were 0.534% lower (−0.534; 95% CI −0.666, −0.403) than the reference category. All covariates performed similarly to those reported in the Table S1.
Table 3.
Results of generalized estimating equation models of the association between glycated haemoglobin (HbA1c) and various levels of the biological‐response based proportion of days covered, stratified by HbA1c before metformin initiation, adjusted for covariates
| Pre‐metformin HbA1c <8% (1770 patients) | Pre‐metformin HbA1c >8% (1330 patients) | |||||||
|---|---|---|---|---|---|---|---|---|
| HbA1c values | Estimate | 95% CI | p | HbA1c values | Estimate | 95% CI | p | |
| BRB‐PDC | ||||||||
| 0–49% | 1425 | Reference | — | — | 825 | Reference | — | — |
| 50–59% | 271 | 0.009 | −0.094, 0.112 | 0.859 | 221 | −0.129 | −0.297, 0.039 | 0.133 |
| 60–69% | 300 | −0.102 | −0.190, −0.014 | 0.024 | 197 | −0.278 | −0.450, −0.106 | 0.002 |
| 70–79% | 371 | −0.124 | −0.206, −0.042 | 0.003 | 265 | −0.373 | −0.518, −0.227 | <0.001 |
| 80–89% | 616 | −0.127 | −0.200, −0.053 | <0.001 | 478 | −0.534 | −0.666, −0.403 | <0.001 |
| ≥90% | 2913 | −0.151 | −0.216, −0.087 | <0.001 | 2036 | −0.456 | −0.572, −0.340 | <0.001 |
BRB‐PDC, biological response‐based proportion of days covered; CI, confidence interval; HbA1c, glycated haemoglobin.
The probability of a given HbA1c being <7% was 19% higher if the corresponding PDC was ≥80% among patients who initiated metformin when HbA1c was <8% (adjusted odds ratio 1.19; 95% CI 1.06, 1.34), and 28% higher among those with pre‐metformin HbA1c ≥8% (adjusted odds ratio 1.28; 1.12, 1.46; data not shown).
Discussion
In this novel observational cohort study of 3109 patients with diabetes and 9918 HbA1c measurements, we found that better medication adherence to metformin was associated with lower HbA1c levels; however, the impact of adherence on glycaemic control was dependent on the level of glycaemic control before initiating metformin. Although we chose the threshold of 8% because it was the approximate median pre‐treatment HbA1c in the present study, it also represents a clinically meaningful level at which pharmacological treatment and adherence to it becomes essential. Importantly, our results show a considerably stronger association between adherence and HbA1c than has been previously reported.
Although these findings seem intuitive, they may clarify why previous studies found that adherence had a smaller effect on glycaemic control. For example, in a study of 257 metformin users, non‐adherence defined as >20% using the continuous measure of medication gaps method (essentially an inverse of PDC) was associated with a 0.14 percentage point increase in HbA1c value, with both measures averaged over 3 years 7. In another study that used 1‐year averages, each 10% increase in PDC was associated with a 0.1% decrease in HbA1c 8. As shown in Figure 1 and suggested by our findings, values of adherence and HbA1c estimated over extended periods of time may obfuscate the short‐term impact that adherence has on glycaemic control. We developed a method that allowed us to associate glycaemic control with adherence behaviour that most closely preceded a given HbA1c measurement. A similar method was suggested by Bryson et al. 9, using 30‐ and 90‐day intervals that associated blood pressure with antihypertensive use and LDL cholesterol with simvastatin use. They also concluded that their method performed better at measuring biological responses than traditional methods. Our findings extend that conclusion to HbA1c and metformin, and our proposed measure may be more clinically useful than other adherence measures.
One recent study found a stronger relationship between adherence and HbA1c than had been previously reported, with adherent patients having a 1‐year adjusted HbA1c 0.65% lower than non‐adherent patients 10. Several key differences in study design may explain those findings. First, adherence in taking medications (vs filling prescriptions) was measured using a medication container with a lid containing an electronic device that recorded its opening. This is both a more precise measure of medication consumption than the present method, which assumes dispensed medications are taken as prescribed, and links adherence behaviour to clinical outcome even more closely in time. Second, the data were extracted from a clinical trial which may have selected highly adherent patients. Indeed, baseline adherence among participants was 75.5%. Third, and perhaps most importantly, patients were not new initiators of metformin. The present study included an inception cohort of new initiators, some of whom subsequently had a single prescription fill of metformin. These patients have been termed ‘early‐stage non‐persistent’ 3, and in the present study, would have had an BRB‐PDC of 0%. A previous study of metformin initiation reported that such patients were more likely to have baseline HbA1c levels <8% compared with patients who continued metformin therapy 11. In the present study, the impact of adherence was much lower among patients with better glycaemic control at baseline. Taken together, these data suggest that in studies that include initially non‐adherent patients, the relationship between adherence and HbA1c might be expected to be smaller in magnitude than in studies using only patients with multiple metformin dispenses who are by definition more adherent.
The present results suggest that levels of adherence that do not reach the customary threshold of 80% may provide some clinical benefit, with significantly lower HbA1c levels associated with BRB‐PDC as low as 60%. Nevertheless, the results also suggest that the 80% threshold, which is used to define full adherence for research studies and for quality improvement programmes, such as Medicare STARS 12, may adequately represent the maximum attainable benefit of adherence. The present study was not designed to identify the minimum level of adherence as defined by BRB‐PDC that maximizes the biological benefit. Although we observed differences between intervals of BRB‐PDC, the confidence intervals overlapped and the sample size in successive bands of BRB‐PDC may have been too small to simultaneously analyse 10% intervals. Understanding how much adherence is necessary to attain the desired therapeutic response and how much additional benefit can be realized by relatively small changes in BRB‐PDC is an important area for future research.
An important strength of the present study was its relatively large sample size, which allowed us to focus our analyses on initiation of a single first‐line antihyperglycaemic agent, thus removing any potential bias from studying an established therapy or adherence patterns that might carry over from a previous antihyperglycaemic medication. Our results were further strengthened by the method itself, which more closely links adherence to the drug and the anticipated biological response of using the drug than previously studied methods. Because the BRB‐PDC can be calculated from a single dispensing of a medication, it extends the ability to assess associations between adherence estimates and HbA1c for early non‐persistent patients who constitute 15–20% of those who newly initiate metformin 11, 13; such patients would be excluded from the usual measure of PDC and other similar methods that require at least two dispenses to calculate 3.
The present study also has some important limitations. The data were derived from an integrated health system that has substantial information technology tools, including electronic medical records and alerts that notify clinicians when HbA1c levels are not optimal. These tools may override the effects of non‐adherence that might be otherwise observed. Although we included nearly 10 000 observations of HbA1c and their corresponding BRB‐PDC, there were an insufficient number of observations between 10 and 70% to study the effects on HbA1c of BRB‐PDC within discrete bands over the entire range.
In conclusion, the present study used a novel modification of the PDC method to correlate the expected biological response to newly initiated metformin with adherence to the medication assessed over the same interval represented by an HbA1c measurement. We observed the greatest impact of high adherence on glycaemic control among patients who initiated metformin at higher HbA1c levels. Metformin is most effective as monotherapy when initiated at diabetes diagnosis when HbA1c levels are still low 11, 14. For the patient with a higher initial HbA1c level, a high level of adherence appears to be nearly as effective in lowering HbA1c as the addition of a second antihyperglycaemic agent 1, but without the concomitant safety concerns 15.
Conflict of Interest
This study was funded by Merck & Co. Inc., and K. T. and P. M. are employees of Merck. K. K. is a fellow sponsored by Merck. G. A. N. currently receives other grant funding from AstraZeneca, Novartis Pharmaceuticals, Incyte Corporation, and Boehringer‐Ingelheim for other unrelated research projects.
G. A. N. contributed to the study conception, design, and interpretation of results, and developed the first draft of the manuscript. A. G. R. contributed to the study design, analyzed the data and reviewed/edited the manuscript. T. M. K. researched the data and reviewed/edited the manuscript. K. T. and K. K. contributed to the study conception and design and the interpretation of the results, and reviewed/edited the manuscript. P. M. contributed to the study conception and design, reviewed the statistical analyses, and reviewed/edited the manuscript. J. F. S. contributed to the interpretation of the results, contributed to the discussion, and reviewed/edited the manuscript. The final draft for submission was approved by all authors. G. A. N. is the guarantor of this work and, as such, had full access to all the data in the study and takes responsibility for the integrity of the data and accuracy of the data analysis.
Supporting information
Figure S1. Distribution of 9918 observations for 3109 patients by level of biological response‐based proportion of days covered.
Table S1. Results of generalized estimating equation models of the association between the covariates measured at baseline and all glycated haemoglobin (HbA1c) levels, stratified by HbA1c before metformin initiation.
References
- 1. Inzucchi SE, Bergenstal RM, Buse JB et al. Management of hyperglycemia in type 2 diabetes: a patient‐centered approach. Diabetes Care 2012; 35: 1364–1379. [DOI] [PMC free article] [PubMed] [Google Scholar]
- 2. Cramer JA. A systematic review of adherence with medications for diabetes. Diabetes Care 2004; 27: 1218–1224. [DOI] [PubMed] [Google Scholar]
- 3. Raebel MA, Schmittdiel J, Karter AJ, Konieczny J, Steiner JF. Standardizing terminology and definitions of medication adherence and persistence in research employing electronic databases. Med Care 2013; 51: S11–21. [DOI] [PMC free article] [PubMed] [Google Scholar]
- 4. Asche C, LaFleur J, Conner CA. Review of diabetes treatment adherence and the association with clinical and economic outcomes. Clin Ther 2011; 33: 74–109. [DOI] [PubMed] [Google Scholar]
- 5. Sacks DB, John WG. Interpretation of hemoglobin A1c values. JAMA 2014; 311: 2271–2272. [DOI] [PubMed] [Google Scholar]
- 6. Adams AS, Trinacty CM, Zhang F et al. Medication adherence and racial differences in A1C control. Diabetes Care 2008; 31: 916–921. [DOI] [PMC free article] [PubMed] [Google Scholar]
- 7. Pladevell M, Williams LK, Potts LA, Divine G, Xi H, Elston Lafata J. Clinical outcomes and adherence to medications measured by claims data in patients with diabetes. Diabetes Care 2004; 27: 2800–2805. [DOI] [PMC free article] [PubMed] [Google Scholar]
- 8. Rozenfeld Y, Hunt JS, Plauschinat C, Wong KS. Oral antidiabetic medication adherence and glycemic control in managed care. Am J Manag Care 2008; 14: 71–75. [PubMed] [Google Scholar]
- 9. Bryson CL, Au DH, Young B, McDonnell MB, Fihn SD. A refill adherence algorithm for multiple short intervals to estimate refill complicance (ReComp). Med Care 2007; 45: 497–504. [DOI] [PubMed] [Google Scholar]
- 10. Nagrebetsky A, Griffin S, Kinmonth AL, Sutton S, Craven A, Farmer A. Predictors of suboptimal glycaemic control in type 2 diabetes patients: the role of medication adherence and body mass index in the relationship between glycaemia and age. Diabetes Res Clin Pract 2012; 96: 119–128. [DOI] [PubMed] [Google Scholar]
- 11. Nichols GA, Conner C, Brown JB. Initial nonadherence, primary failure and therapeutic success of metformin monotherapy in clinical practice. Curr Med Res Opin 2010; 26: 2127–2135. [DOI] [PubMed] [Google Scholar]
- 12. Schmittdiel JA, Nichols GA, Dyer W, Steiner JF, Karter AJ, Raebel MA. Medicare STAR excludes diabetes patients with poor CVD risk factor control. Am J Manag Care 2014; 20: e581–e589. [PMC free article] [PubMed] [Google Scholar]
- 13. Karter AJ, Parker MM, Moffet HH, Ahmed AT, Schmittdiel JA, Selby JV. New prescription medication gaps: a comprehensive measure of adherence to new prescriptions. Health Serv Res 2009; 44: 1640–1661. [DOI] [PMC free article] [PubMed] [Google Scholar]
- 14. Brown JB, Conner C, Nichols GA. Secondary failure of metformin monotherapy in clinical practice. Diabetes Care 2010; 33: 501–506. [DOI] [PMC free article] [PubMed] [Google Scholar]
- 15. Cefalu WT, Buse JB, Del Prato S et al. Beyond metformin: safety considerations in the decision‐making process for selecting a second medication for type 2 diabetes management: reflections from a diabetes care editors' forum. Diabetes Care 2014; 37: 2647–2659. [DOI] [PMC free article] [PubMed] [Google Scholar]
Associated Data
This section collects any data citations, data availability statements, or supplementary materials included in this article.
Supplementary Materials
Figure S1. Distribution of 9918 observations for 3109 patients by level of biological response‐based proportion of days covered.
Table S1. Results of generalized estimating equation models of the association between the covariates measured at baseline and all glycated haemoglobin (HbA1c) levels, stratified by HbA1c before metformin initiation.