Abstract
The modular software MOLSIM for all‐atom molecular and coarse‐grained simulations is presented with focus on the underlying concepts used. The software possesses four unique features: (1) it is an integrated software for molecular dynamic, Monte Carlo, and Brownian dynamics simulations; (2) simulated objects are constructed in a hierarchical fashion representing atoms, rigid molecules and colloids, flexible chains, hierarchical polymers, and cross‐linked networks; (3) long‐range interactions involving charges, dipoles and/or anisotropic dipole polarizabilities are handled either with the standard Ewald sum, the smooth particle mesh Ewald sum, or the reaction‐field technique; (4) statistical uncertainties are provided for all calculated observables. In addition, MOLSIM supports various statistical ensembles, and several types of simulation cells and boundary conditions are available. Intermolecular interactions comprise tabulated pairwise potentials for speed and uniformity and many‐body interactions involve anisotropic polarizabilities. Intramolecular interactions include bond, angle, and crosslink potentials. A very large set of analyses of static and dynamic properties is provided. The capability of MOLSIM can be extended by user‐providing routines controlling, for example, start conditions, intermolecular potentials, and analyses. An extensive set of case studies in the field of soft matter is presented covering colloids, polymers, and crosslinked networks. © 2015 The Authors. Journal of Computational Chemistry Published by Wiley Periodicals, Inc.
Keywords: molecular simulation, software, all‐atom model, coarse‐grained model, Monte Carlo simulation, molecular dynamics, Brownian dynamics, ensembles, boundary conditions, Ewald sum
Introduction
Simulations of complex model systems constitute an integrated part in nearly all aspects of science. Besides providing essentially exact properties of a given model system, simulations are used to plan and evaluate experiments and to assess accuracy of theories. Advances in molecular biology, novel materials and processes, and new experimental techniques currently challenge the corresponding development of simulation methods and tools. For example, the ability to experimentally characterize systems over many orders of magnitude in space and time has triggered the concept of multiscale modeling with as seamless transitions as possible between models of different degree of details. Also the growth in computer power has grossly influenced the development of simulation techniques. Currently, the increase in the computational power is largely driven by increased multithreading.
The field of classical molecular simulation is placed in between the fields of quantum mechanics and continuum mechanics.1 The interfaces between the fields are not sharp, and hybrid methods are developed in between. Central to classical molecular simulation is the choice of (i) object to be treated such as molecules or aggregates of molecules, and (ii) their interaction potentials. Here, quantum mechanics constitutes one source of obtaining interaction potentials, complementing empirical (knowledge‐based) potentials. At the other length‐scale end, results of molecular simulation provide essential input to continuum models.
In more detail, molecular simulations2, 3, 4, 5 are performed in virtually all molecular sciences, ranging from molecular biology, different subfields of chemistry, condensed matter physics, to parts of geology, and astronomy. Although the largest factor for the growing impact of molecular simulation lies in the increased availability of computer power, theoretical and methodological advances should not be overlooked. Since the advent of molecular simulation, now more than 50 years ago, developments are still flourishing in terms of potential development, methods to handle long‐range interactions, new approaches for free energy evaluation, and coherent models describing systems at different degrees of coarse graining.
The development in molecular simulation is also reflected by growing number of major and general academic software packages such as Amber,6 Charmm,7 DL_POLY,8 Espresso,9 Gromacs,10 GROMOS,11 and LAMMPS.12 On the commercial side, a solidification phase has passed, and the most significant commercial software is now likely Material Studios by Biova (former Accelrys).
The aim of this article is to provide a conceptual description of MOLSIM—a modular MOLecular SIMulation software for classical simulation of all‐atom and coarse‐grained models using molecular dynamics (MD), Monte Carlo (MC), and Brownian dynamics (BD) methods. The present description is focused on main organization and fundamental ideas of the software rather than on performance, and it contains also a set of case studies in the field of soft matter to demonstrate its abilities.
MOLSIM has its roots from mid‐1980s, and has since then been primarily developed as a response to the simulation needs at Lund University and collaborating research groups. MOLSIM is currently written in Fortran 95 and was during the 1990s extended to parallel computation using the message passing interface (MPI) protocol. The software is subjected to continuous development in response to new scientific advances. Some of the characteristic features of the software are compiled in Table 1. In complement to this article, a reference manual of MOLSIM is available through the web portal at www.physchem.lu.se/sm, where several sample input files are available and test executions can be performed. The software runs on all major architectures/operating systems and is freely available for academic use.
Table 1.
Unique and other characteristic features of the software MOLSIM.
| Unique features |
| • United software for molecular dynamic, Monte Carlo, and Brownian dynamics simulations |
| • Objects from simple noble gas atoms and none‐spherical particles to hierarchal polymers and cross‐linked networks |
| • Interaction sites may possess charges, point dipoles, and/or anisotropic dipole polarizabilities with the long‐range interaction evaluated using the standard Ewald sum, the Smooth Particle Mesh Ewald sum, and the reaction‐field method |
| • Statistical uncertainties are provided for all calculated observables |
| Other characteristic features |
| • Lookup table for pairwise interaction potentials for speed and uniformity |
| • A large set of static and dynamic analysis routines |
| • Possibilities to add user‐provided routines for extending capability |
| • Double precision numeric and binary storage for maximal accuracy |
The strength of MOLSIM lies in its ability to handle complex systems and its modular construction without sacrificing efficiency, enabling new extensions in a simple manner. The software has been developed to particularly handle systems comprising (i) all‐atom models of small molecules, in particular possessing atoms containing charges, dipoles, and dipole polarizabilities, and (ii) coarse‐grain models in the field of soft matter. Hence, it is not the optimal software for all‐atom hydrocarbon, protein, and nucleotide simulations or simulations of solid materials. MOLSIM has been ported to most major operating systems and compilers. It has been distributed to over 20 academic groups and has been used in the research appearing in O(102−103) publications.
The article is organized as follows: First, the MOLSIM Main Structure section is presented. Thereafter, the Stages section provides a more extended presentation of simulation stages, and Tasks section of simulation tasks, two central concepts provides important concepts of MOLSIM and how they are related. In the Other Topics section, other general topics of MOLSIM are presented. The capacity of the software is illustrated in the Case Studies section by providing descriptions of some model systems, which have been investigated using MOLSIM.
MOLSIM Main Structure
In this section, we will (i) discuss the synchronization between generation of new positions of the objects and evaluation of properties, (ii) introduce the concepts stage and task, and (iii) briefly discuss the evaluation of averages.
Top organization
A complete simulation can be decomposed into two different parts:
Generation of positions, etc and calculation of control and basic properties
Analyses of static and dynamic properties of the system
The software MOLSIM performs both parts of a simulation.
The methods available to generate positions involve MD, MC, and BD techniques. In the case of MD, trajectories are obtained from the motion of the objects, whereas in MC configurations are generated by trial moves. In BD, trajectories are also influenced by random quantities representing effects of fast degrees of freedoms only implicitly included in the model.
The second part of a simulation involves a computation of properties of the model system. A large number of time‐independent properties can be determined by MOLSIM on the basis of generated configurations. Time‐dependent analyses can be based on positions and orientations of particles, on linear and angular velocities of particles, and on forces and torques acting on particles. The evolution of positions, orientation, linear velocity, angular velocity, forces, and torques (MD, BD) and configurations (MC) will in the following be referred to as dump data.
Working protocols
The two parts of a simulation, in combination with writing and reading dump data can be arranged in three working protocols as illustrated in Figure 1. In the first one, the two parts are made intertwined (referred to as analysis made on the fly), and is the simplest one when the required analyses are known before the simulation. In the second protocol, the two parts are performed sequentially, having the advantage that properties to be determined can be decided at a later stage. Moreover, successive refined analyses can be made without need to regenerate the positions, etc. An analysis often utilizes a fraction of the computer time needed for a simulation. The main disadvantage of this protocol is the need of data storage. The third protocol is obviously a union of the other two protocols, allowing supplementary analyses if those made on the fly were insufficient.
Figure 1.
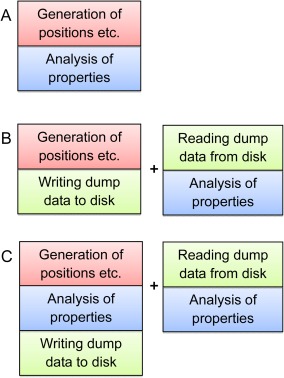
Illustration of three protocols of performing a simulation. The protocols are further discussed in the text. [Color figure can be viewed in the online issue, which is available at wileyonlinelibrary.com.]
Synchronization
The activities of a simulation need to be synchronized. The activities are divided into a number of smaller and more manageable units, referred to as tasks. Moreover, a task is subdivided into subtasks, whose execution are coordinated by dividing a simulation into different stages. More specifically, task, subtask, and stage are defined as follows:
A task comprises all necessary computations for performing a specific function such as construction of particles, generation of a start configuration, time integration, generation of new configurations, and calculation of averages of a different property.
A subtask of a task comprises a part of the task that is executed without interruption by other tasks.
A stage comprises the sequential execution of one or more subtasks belonging to different tasks. For a simulation software of limited size, the stages could, for example, be handling of input data, of motion/movement of the objects, and handling of output data.
Two types of synchronization appear in MOLSIM. The main one is achieved by the distribution of subtasks of a given task among the different stages, where the stages are executed sequentially. The second synchronization in MOLSIM is the order with which subtasks of different tasks in a given stage are executed, as the sequential order of subtasks is often essential. This secondary synchronization is achieved by specifying the sequential order of subtasks in a stage.
Figure 2 provides an example illustrating the concepts task, subtask, and stage and their synchronization, which constitute the core of how MOLSIM is organized and functioning. Needless to say, for this simple case the formalization of concepts is superfluous.
Figure 2.
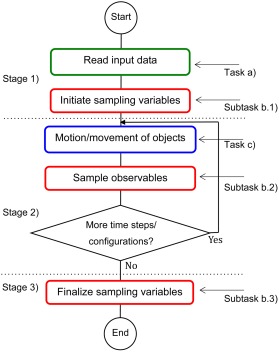
Illustration of the concepts task, subtask, and stage of a simple simulation software. Here, three stages, separated by dotted lines, and three tasks given in frames of different color are present. Task b) is divided into three subtasks. Moreover, task a) appears in stage 1), task b) appears in all three stages, and task c) appears in stage 2). [Color figure can be viewed in the online issue, which is available at wileyonlinelibrary.com.]
Averages and uncertainties
The aim of a simulation is to obtain numerical values of different properties of the model system. The software MOLSIM handles observables of two different types: (i) scalar observables and (ii) one‐ and two‐dimensional (probability) distribution functions. The average potential energy and an atom–atom radial distribution function (rdf), respectively, constitute examples of these two types of observables.
The evaluation of averages and their uncertainties are different for scalar observables and distribution functions in two respects.
The formation of the average of a scalar observable is made by summation of the values of the observable at different time steps/configurations. The average of a distribution function is constructed by summing such functions calculated from a part (block) of the full simulation.
The precision of the average of a scalar observable is estimated using block averages obtained by dividing the simulation into blocks of different lengths followed by an extrapolation to an infinite block length.13 The precision of a distribution function at all values of the independent variable is evaluated using block averages obtained from using a single block length selected by the user. The block length should be longer than the correlation length of the distribution function.
Stages
As described in MOLSIM Main Structure section, a stage comprises subtasks performed at the same part of a simulation. In MOLSIM, a full simulation comprises seven stages. Table 2 provides a list of the type of activities performed at each stage. In the following, the stages will be discussed in more detail.
Table 2.
Overview of the stages of MOLSIM and their activities.
| Stage | Activity of the stages |
|---|---|
| 1 | Initiate and read input data |
| 2 | Prepare and write input data |
| 3 | Initiate simulation |
| 4 | Initiate one macrostep |
| 5 | Simulation mode: Perform one time step/pass and sample propertiesAnalysis mode: Read one configuration and sample properties |
| 6 | Average data over one macrostep and calculate and sample distribution functions |
| 7 | Compute grand averages |
Initiate and read input data
The first stage involves assignment of values to variables which describe (i) the model to be simulated and (ii) how it is simulated. In MOLSIM, a large number of such variables are assigned default values before being read from the input file. If a variable is absent in the input file, the variable keeps its default value. Hence, if the default value is the desired one, the variable could be absent in the input file. See Unit assignment section for an example.
Prepare and write input data
After initial values having been obtained either by default or read from the input file, the initial values of the input variables are checked for inconsistencies, for example, among numbers of atoms, particles, and chains as well as electroneutrality. Thereafter, different preparations such as building objects, generation of potential tables, and initiating positions and orientations of particles are made. At the end of this stage, values of all input variables describing the simulation as well as other initial data are written to the output file. Hence, the output file contains a full record of the specification of a simulation.
Initiate simulation
Generally, an average value of an observable is calculated as an arithmetic average obtained by summing up its value for different configurations generated by the simulation. For that reason, the summation variables holding the running sum need to be set to zero before the summation. Hence, in this third stage, variables used to accumulate observables over the full simulation are initiated by setting to zero.
Initiate one macrostep
The total number of time steps (MD or BD) and passes (MC) of a full simulation is divided into macrosteps and each macrostep into steps for several reasons. The most important ones are: (i) a full averaging evaluation of all variables is made over each macrostep, (ii) evaluation of distribution functions using configurations of one macrostep, (iii) output of macrostep‐averaged variables, (iv) storage of intermediate data for later evaluation of the precision of distribution functions based on their spread among the macrosteps, and (v) read all necessary information from the last completed macrostep to continue a simulation with preservation of the capacity of full statistical analyses.
In this fourth stage, summation variables used to produce averages over one macrostep are initiated. If the simulation is restarted from a terminated one, partial averages of the incomplete simulation are read, enabling computation of grand averages of the complete simulation composed of the incomplete simulation and its extension.
Perform one time step/pass
This stage involves a single time step (if MD or BD) or one pass (if MC), where one pass comprises approximately one trial displacement per particle. In addition, checks are made to examine if the neighbor list needs to be updated, and, if so, it is updated. Furthermore, observables are sampled at frequencies specified by input variables.
The reason for controlling the sampling frequency is the following: the value of an observable is usually only marginally changed between two consecutive time steps/passes and although the driving of the simulation normally dominates the CPU usage, some analyses may occasionally be CPU intensive. Hence, a less frequent sampling with an accompanied reduced CPU time requirement is achieved without any significant loss of accuracy. The correlation time of an observable is useful as an estimate of the optimal sampling frequency of that.
Finally, if requested, coordinates are written in user‐specified format for later image rendering.
Average over one macrostep
This stage finalizes a macrostep and involves two types of activities. First, macrostep‐averaged variables are calculated and written to the output file and distribution functions are calculated and sampled to later produce grand averages. Second, (i) configurational data, (ii) velocities (if available), and (iii) intermediate summation variables are stored on a configuration file. The stored data are used to start new simulations using either the configuration data only or all data as described in System section below.
Make grand averages
The simulation reaches its final stage after the end of the last macrostep. At this point, (i) averages over the full simulation (grand averages) of variables and distribution functions are calculated, (ii) precisions of scalar variables are evaluated from intermediate data extrapolated to infinite block length, (iii) precisions of distribution functions are evaluated from their macrostep averages, and (iv) grand averages and their uncertainties are written to the output file and optionally to other files as well.
Tasks
As mentioned in the Syncronization section, a complete simulation can be divided into smaller units. The aim of such a division is to (i) obtain more manageable units, (ii) a better control of the simulation, and (iii) a modular software.
In MOLSIM, the computation is divided into about 15 tasks; however, the division is to a certain degree arbitrary. Each task is characterized by containing related actions, which also possess similar logical structures. In the following, the different tasks are shortly described.
System
The first and superior task is to provide basic information about the model system and basic control variables of the simulation. That involves (i) computational mode, (ii) simulation method, (iii) ensemble, (iv) boundary conditions, (v) start mode, (vi) simulation length, (vii) external parameters such as temperature and pressure, (viii) the seed of random number generator, (ix) description which type of analyses to be made, and (x) general parameters controlling both type and amount of output produced.
We have already discussed the two computational modes: generation of configurations with optional analysis on the fly and reading of configurations for analysis.
MOLSIM supports the three simulation methods MD, MC, and BD. MC simulations can be made in two different ways: trial moves encompassing one (or a few) particles or all particles. The latter option is more favorable in MC simulations of systems containing polarizable atoms giving rise to many‐body induction interaction.
The following four ensembles are available: microcanonical ensemble (NVE), canonical ensemble (NVT), isobaric ensemble (NPT), and grand canonical ensemble (μVT). The ensembles available depend on the simulation method selected. As to MD simulations, Berendsen's thermal and pressure couplings to external baths are available.14 Although these methods do not exactly correspond to an ensemble, they provide results that generally are in agreement with results of more sophisticated methods.
A number of different boundary conditions are supported by MOLSIM. Typically, the boundary condition best resembling experimental or theoretical system to be modeled is selected. Beside the boundary conditions given in Figure 3, rhombic dodecahedron and truncated octahedron are available.
Figure 3.
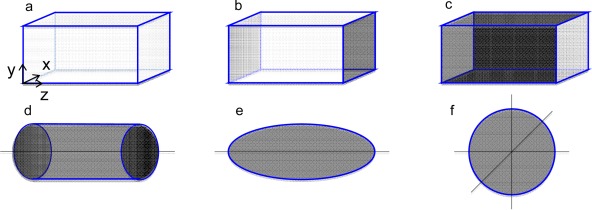
Illustration of different boundary conditions: a) parallelepiped with periodic boundary conditions (pbc:s) in all three directions, b) parallelepiped with pbc:s in the x and y directions, c) parallelepiped with pbc in the z direction, d) cylindrical boundary conditions, e) ellipsoidal boundary conditions, and f) spherical boundary condition. The gray areas represent impenetrable surfaces. [Color figure can be viewed in the online issue, which is available at wileyonlinelibrary.com.]
MOLSIM allows a simulation to be started using four different options. These options differ in terms of how (i) the initial positions and velocities are obtained and (ii) accumulation variables are initialized.
Table 3 summarizes the options. The first option comprises that coordinates of the particles are generated by MOLSIM and the accumulation variables are initialized to zero. A wide choice of protocols for generating initial coordinates is available. In the second option, coordinates are read from the input file and the accumulation variables are initialized to zero. This choice enables reading of start coordinates from a text file, after copying them into the input file. In the third and fourth options, coordinates are read from the configuration file, which contains coordinates and values of accumulation variables from a previous simulation of the same system. In the third option, the accumulation variables are initialized to zero, whereas in the fourth option they are taken from the previous simulation.
Table 3.
Overview of start options.
| Option | Coordinates | Accumulation variables | Use |
|---|---|---|---|
| 1 | Generated by MOLSIM | Initialized to zero | Equilibration run |
| 2 | Read from input file | Initialized to zero | Equilibration run |
| 3 | Read from configuration file | Initialized to zero | Production run |
In practice, a simulation study of a system comprises an equilibrium run followed by a production run. The first and second start options are used for the equilibrium run, and the third start option for the production run. The fourth start option is useful to prolong a completed production simulation or to continue a production run that has been aborted by some external condition such as exceeding maximum CPU time or power cut.
Unit assignment
MOLSIM assumes that all quantities are given in predefined units. The numerical factor between a unit used and the SI unit or unit derived from SI units of a quantity is given by a unit scaling variable. The values of the scaling variables are provided in the input, enabling maximal flexibility in selecting units. The default values of scaling variables are selected for simulations of molecular systems. As an example, the value 10−10 of the length scaling variable implies that Ångström is used as length unit.
Objects
The word object is used for an entity that preserves its identity through a simulation. In a general‐purpose molecular simulation software, the entities can range from simple ions such as a sodium ion to a complex hierarchical polymer or a crosslinked network. Therefore, the specification of objects can easily become complex, and sometimes special software is used before a simulation to build objects.
In MOLSIM, the full description of objects is an integrated part of the software. To simplify the building of objects, a hierarchy of four levels is used. Objects defined in one level are used as building blocks of objects on the next level. The objects defined at the four levels are: (i) “atom,” (ii) “particle,” (iii) “chain,” and (iv) “hierarchical structure” (see Fig. 4). A chain always refers to a linear chain. In more detail:
Figure 4.
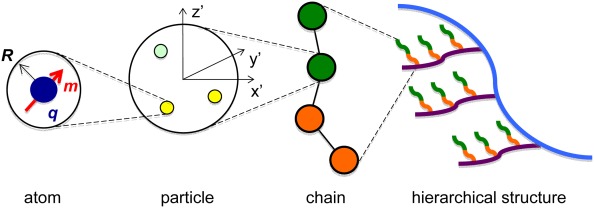
Illustration of the objects (i) atom, (ii) particle, (iii) chain, and (iv) hierarchical structure and their relations. Here, the atom possesses the hard‐core radius R, charge q (dark blue), and dipole moment m (red); the particle is composed of three atoms of two different types (yellow and light green) positioned in a local coordinate system (x′y′z′); the chain is composed of four particles of two different types (green and orange); and finally the hierarchical structure is made of chains of four different types (green, orange, purple, and blue). [Color figure can be viewed in the online issue, which is available at wileyonlinelibrary.com.]
An atom can possess hard‐core radius, mass, charge, electrostatic dipole, and electrostatic dipole polarizability (see Fig. 4). The charge and electrostatic dipole are located at the center‐of‐mass of the atom, and other interactions as van der Waals attractions, also originates from the center of an atom.
A particle is built of one or several atoms. A local coordinate system (x′y′z′) is associated to a particle and the atoms belonging to a particle possess a fixed position and orientation in the local coordinate system, that is, the particle is rigid.
A chain is constructed of one or several particles. Alternating and block copolymers can be formed. Particles are connected with bonds forming a linear object, and particles associated to a chain are referred to as beads. The flexibility of a chain is regulated by both bond and angular potentials.
A hierarchical structure is built of one or several chains. Chains are connected by crosslinks that have similar properties as bonds connecting particles.
Moreover, atoms with different properties can be present and we refer to atoms of different types. Similarly, particles and chains of different types can be present. The principles of forming progressively more complex objects are also illustrated in Figure 4. A model always contains objects of the two lowest levels, that is, atoms and particles. Every atom has to be associated to a particle, and a particle always contains at least one atom.
A few examples: (i) an argon atom or a sodium ion would be represented by a particle composed of one atom localized in the center of the particle, (ii) a rigid water molecule could be represented by a particle with three atoms of which one represents oxygen and two hydrogen, (iii) a coarse‐grained polymer composed of a sequence of beads would be modeled as a chain, and (iv) more complex polymer models, for example, models of bottle‐brush polymers and dendrimers would be described as hierarchical structures.
Interaction potentials
Interaction potentials are generally divided into intermolecular (nonbonded) potentials, intramolecular potentials, and external potentials of the system. MOLSIM is able to handle three different types of intramolecular potentials: bond, angular, and crosslink potentials. Nonbonded, bond, and crosslink potentials operate between centers of atoms. These concepts are illustrated in Figure 5.
Figure 5.
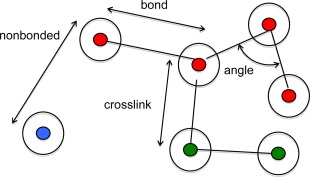
Illustration of nonbonded potential acting between atoms (filled circles) and bond, angle, and crosslink potential acting among particles (open circles). [Color figure can be viewed in the online issue, which is available at wileyonlinelibrary.com.]
Nonbonded intermolecular interactions are of two types: (i) pairwise additive and (ii) nonpairwise additive. A large selection of pairwise nonbonded interactions is available including spherical hard‐core, ellipsoidal hard‐core, Coulomb, dipole, Lennard‐Jones, and square‐well potentials. In fact, any potential composed of a sum of terms with negative powers of the atom–atom separation may be specified. Central nonobonded potentials are tabulated before the simulation to achieve uniformity and simplicity of the central energy and force routines.15 This makes it simple to add new nonbonded potentials (see User‐Provided Routines section). The long‐range charge–charge (Coulomb), charge–dipole, and dipole–dipole interactions are evaluated using either the Ewald sum or the reaction‐field method. Both the standard Ewald sum with the complexity O(N 3/2) and the Smooth Particle Mesh Ewald sum16 with the complexity O(NlnN) methods are implemented. Here N is the number of atoms in the system. The nonpairwise additive potential available comprises polarization interaction, involving anisotropic dipole polarizabilities responding to an electrostatic field.17
Intramolecular potentials are used to form chains, hierarchical structures, and crosslinked networks of different degree of flexibility. Chains are formed by connecting particles by bond potentials, and the intrinsic flexibility of a chain is regulated by angular potentials. Crosslink potentials are used to link particles residing in different chains to form hierarchical structures and networks. Currently, intramolecular potentials comprising a power expression of the particle–particle separation or angle are available. The functional forms of bond and crosslink potentials are the same.
A large set of external potentials is built in, such as planar walls with a square‐well interaction or with a Lennard‐Jones interaction and the presence of an external electrostatic field. User‐provided external potentials can be supplied.
Coordinates
Initial particle coordinates and velocities of a simulation can be obtained through different methods (see System section). One of the start options comprises generation of initial coordinates by MOLSIM. Independent of shape and size of the simulated system, the initial particle coordinates are enclosed by a insertion parallelepiped (see Fig. 6). The size and location of the insertion box are controlled by the user. This enables the particles to be placed in a subvolume of the simulated system. Different insertion boxes can be used for different particle types, enabling a start configuration with spatially separated particles.
Figure 6.

Illustration of a system (blue), which possesses an inscribed insertion box (red), which in turn is divided into (right) unit cells, in which particles are positioned. The insertion boxes and unit cells are always described by parallelepipeds. Here, the unit cell possesses two particles in a body‐centered cubic symmetry. [Color figure can be viewed in the online issue, which is available at wileyonlinelibrary.com.]
The selection of the initial positions of particles inside an insertion box is made either using (i) a lattice or (ii) random numbers. The former approach involves a division of the insertion box into unit cells in all three dimensions (see Fig. 6). The particles are placed in the unit cells according to the symmetry of the lattice type specified by the user. The lattice symmetries available include primitive cubic, body centered cubic, and face centered cubic symmetry, but other cubic lattices of other symmetry are also available. Further fine‐tuning is possible by translating the particles inside the unit cells. A large set of different possibilities to generate random initial configurations is available. The choice depends primarily on the type of objects present (chains, hierarchical structures, or networks). Finally, it is also possible to extend MOLSIM with user‐provided routines for generating initial coordinates (see User‐Provided Routines section).
The choice of initial particle coordinates affects the equilibration time, but normally not the outcome of the production run. For a disordered system, a random initial configuration is preferred due to shorter equilibration time. However, for dense systems a regular initial configuration is often necessary as the random approach might fail at high density.
Two options are available for generating initial velocities. They could either (i) be set to zero or (ii) initiated according to the Maxwell–Boltzmann distribution. As thermal equilibration of particle velocities is fast, the practical difference between these two options is small.
Finally, the MC method is more robust than the MD method for equilibrating systems prepared far from equilibrium. Hence, MD production runs of more complex systems can preferentially be equilibrated using the MC method. The switch from an equilibration using the MC method to a subsequent production run using the MD method is trivial.
Simulation methods
Depending on the choice of simulation method (MD, MC, or BD), various additional specifications are needed.
For the MD method, additional specifications include choice of integration algorithm, time step, initiation of velocities, and coupling to external temperature and pressure bath.
As to the MC method, a number of different types of trial move are available, such as (i) translational and rotational move of single particles, (ii) pivot rotation of subchains, (iii) translation of chains, (iv) slithering move of chains, (v) charge change, (vi) volume change, and (vii) change of the number of particles. Many of the trial moves can be combined with cluster moves, for which also nearby particles are subjected to the same trial move. This is useful for particles strongly coupled to neighboring particles. In a more advanced second‐order cluster trial move, particles strongly coupled to neighbors of the particle originally subjected to a trial move also are considered for the same trial move.
Finally, for the BD method, the specification only involves time step and diffusion coefficients in the absence of interaction.
Neighbor lists
The simulation time is normally reduced by only evaluating the force on a particle (MD, BD) or the potential energy (MC) involving a subset of all particles. The identity of the particles in this subset is stored in a so‐called neighbor list. The reduction of the simulation time appears from the fact that the neighbor list generally does not need to be recalculated at every time step/pass. The update of the neighbor list can be selected to appear at a given frequency or to be automatically controlled by the motion (MD, BD) or translation movement (MC) of the particles.
Three options for handling neighbor lists are available, see Table 4. The Verlet neighbor list is suitable for systems, whose extension does not grossly exceed the range of the nonbonded potential. For systems involving a large number of particles, the linked‐list option is possible for the generation of the neighbor list. Finally, for even larger systems and systems with short‐range potentials, the linked list is often the most suitable option.
Table 4.
Overview of options to prepare neighbor lists to be used in simulation and to be used in preparation of neighbor list.
| Option | Simulation | Neighbor list | Use |
|---|---|---|---|
| 1 | Verlet neighbor list | None | Small systems or long‐range potential |
| 2 | Verlet neighbor list | Linked list | Small systems or long‐range potential |
| 3 | Linked list | None | Large systems and short‐range potential |
Control quantities
Although not scientifically important, averages of a number of control quantities can be evaluated and written to the output file. The control quantities can provide further insight into the simulated system and potentially alert the user that the simulation is not proceeding in an appropriate way. If invoked, such averages are written after each macrostep and grand averages are written after the simulation. The current set of control quantities comprises force, torque, linear moment, angular moment, translational temperature, rotational temperatures, all applicable to MD, and extensive statistics on the outcome of different trial moves applicable to MC. In addition, averages of particle displacement, orientation, and position are available.
Main quantities
Fundamental thermodynamic quantities such as average energies, temperature, pressure, volume, and number of particles are considered as main quantities. A more detailed list of main quantities is given in Table 5. Further averages include induced dipole moments (if polarizabilites are present), various chain averages (if chains are present), and the radius of gyration of hierarchical structures (if present). In the same manner as for control quantities, the averages of main quantities are written after each macrostep and grand averages are written after the simulation.
Table 5.
Overview of different main scalar properties.
| Type of main scalar properties | Property |
|---|---|
| Thermodynamic properties | Total energy, kinetic energy, potential energies, enthalpy, temperature, pressure, volume, number of particles |
| Induced dipole moment (idm) | Total idm, particle idm, atom idm |
| Chain properties | Bead–bead separation, end‐to‐end separation, radius of gyration, moments of inertia, persistence length, bond angle, asphericity, toroid parameter |
| Hierarchical‐structure properties | Radius of gyration |
Thermodynamic integration
Thermodynamic integration is a method to evaluate the free energy difference between two different states.3 Presently, two states can differ in (i) hard‐sphere, (ii) Coulomb, (iii) bond, and/or (iv) angular potentials.
Common distribution functions
A number of common distribution functions including potential energy, radial distribution functions (rdf:s), and induced dipole‐moment distribution functions are bundled for efficient evaluation. Table 6 provides a list of the distributions functions available. Their grand average and precision can be (i) visualized, (ii) written to the output file, and (iii) listed in a list file in a form more convenient for plotting.
Table 6.
Overview of bundled distribution functions.
| Type of distribution functions | Property |
|---|---|
| Potential energy | Total potential energy, partial potential energies, binding energies, and pair energies |
| Radial | Particle–particle and atom–atom |
| Induced dipole moment (idm) | Total idm, particle idm, and atom idm |
| Other | z‐density distribution function |
Data dumping
As mentioned in the MOLSIM Main Structure section, a number of particle properties can be written to and read from various dump files, one file for each property. The list of properties available includes particle positions and orientation, particle linear and angular velocity, forces and torques acting on particles, and particle induced dipole moments.
The dumped data can be used to perform analyses after the generation of configurations, see the Top organization and Working protocols sections. All dumped quantities are written in full representation and bitwise identical results are obtained from analyses made on the fly and after the generation of the positions etc, see Figure 1.
Group division
Most of the analyses available in MOLSIM, see Static and Dynamic Properties section, are made separately for particles of different types. For example, a request for particle–particle rdf of a mixture of particles of type A and B will produce A–A, A–B, and B–B rdf's. However, sometimes a division of the particles in a different manner is desired. For example, for a one‐component fluid in contact with a surface, separate analyses of the particles near and far from the surface could be useful.
MOLSIM offers the possibility to divide particles of a given type into two or several groups based on various criteria. Moreover, as the criteria for group division can be specific for a project, there is a possibility to write user‐provide routines, see User‐Provided Routines section.
Static and dynamic properties
Averages of a large set of structural and dynamic properties can be evaluated by MOLSIM. A list of static properties available is given in Table 7. Dynamic properties involve mean‐square displacements and time correlation functions comprising particle linear velocity, orientation, and angular velocity as well as time correlation functions of total force and total torque acting on particles. To invoke any of them, a master flag (switch) has to be enabled, and thereafter another flag for the specific property also needs to be enabled. Finally, more specific input information for that property can be provided. The method of Ramírez et al.18 is used for sampling dynamic properties, enabling an efficient quasilogarithmic time division saving memory and computer time. Most of the analyses use the group division described in Group Division section, enabling a detailed control of the selected particle investigated.
Table 7.
Overview of different static properties available.
| Static properties |
|---|
| • Single particle distribution functions |
| • Radial distribution functions (particle–particle, particle–atom, atom–atom, chain–chain) |
| • Radial distribution functions (projected on a sphere) |
| • Radial distribution functions (conditional) |
| • Triplet correlation functions |
| • Partial structure factors (with and without periodic boundary conditions) |
| • Angular distribution functions |
| • 2D angular distribution functions (with respect to an external frame) |
| • Orientational and dipole‐moment distribution functions |
| • Spherical‐harmonics distribution functions |
| • 2D radial‐angular distribution functions |
| • Kirkwood g k(r) function |
| • Orientational polarization distribution functions |
| • Number of nearest neighbors and hydrogen bonds |
| • Nearest neighbor distribution functions |
| • Chain distribution functions |
| • Chain distribution functions (with respect to an external frame) |
| • Bead‐particle contact distribution function |
| • Loop‐tail‐train averages |
| • 1D and 2D cluster‐size distribution functions |
| • Zero and second charge moment radial distribution functions |
| • Multipole moment distribution functions |
| • Energy distribution functions |
| • Excess chemical potential (Widom's method) |
| • Mean energies and mean forces between particles |
| • Potential of mean force |
| • Exposed surface area |
Visualization
Snapshots of a molecular system can quickly provide an overview of the system and help to detect errors in the system setup or in the code. For that reason, coordinates and some related information can be written to an image file to be processed by an image‐rendering software. The support for different rendering software has varied over the years. Currently support is available for generating image files in the Vrml and Gismos formats.
Other Topics
This section deals with other aspects of the software MOLSIM not connected with the division of the computation into stages and tasks.
Data flow
A file is specified by its name and type, which are separated by a dot. The file types are used in a predetermined way to describe the type and hence the use of the file, whereas the file name can be used to label the project. Figure 7 provides an overview of the data flow mediated by files.
Figure 7.
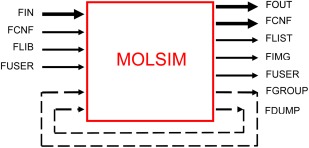
Illustration of data flow of the software MOLSIM controlled by files. Data always read and written are given by thick arrows. Flow of data first generated and written and later analyzed are given by dashed lines. FIN refers to the input file, FCNF to the configuration file, FLIB to a library file containing parameters of interaction potentials, FOUT to the output file, FLIST to the list file, FIMG to the image file, FUSER to a file used by the user‐provided code, FGROUP to the group file, and FDUMP to the set of dump files. [Color figure can be viewed in the online issue, which is available at wileyonlinelibrary.com.]
User‐provided routines
There are possibilities for a user to add code to MOLSIM and thereby extend its capacity without having to modify the central part of MOLSIM or knowing the software in full detail. The extensions are made in a single file containing predefined interfaces with the remaining part of MOLSIM.
There are six possibilities for making extensions. They comprise: (i) nonbonded potentials, (ii) preparation of start configurations, (iii) selection of data to be dumped, (iv) group divisions, (v) static analyses, and (vi) protocols for exporting coordinates and other information for later image rendering.
Parallelization protocol
The parallelization protocol is based on particle decomposition. That involves a division of operations associated with particles by distributing different sets of particles among the nodes. To minimize communication between the nodes, nearly all information about a given particle is replicated among the nodes. This is an efficient strategy for medium‐sized systems. For very large systems, this parallelization protocol becomes too memory demanding and here the domain decomposition becomes the preferred parallelization protocol. Domain decomposition is currently not available within MOLSIM. Communication between master node/thread and slaves is performed using the MPI protocol. This is the case for both shared and distributed memory models.
To reduce the communication to a minimum, all computations except the most demanding ones are executed on all nodes, implying that when arriving to a code segment to be executed in parallel all nodes possess all the information needed without communication. This parallelization protocol is illustrated in Figure 8a. In MOLSIM, such parallelization appears in (i) setting up neighbor lists, (ii) real‐space energy evaluation, (iii) reciprocal‐space energy evaluation, and (iv) in many statistical analyses. After a section of distributed computation, communication is normally needed. The neighbor‐list generation constitutes an exception as a node only stores the neighbors of those particles handled by that node.
Figure 8.
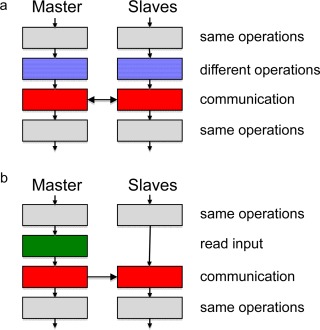
Illustration of the parallelization protocol for reading and CPU‐intensive operations. a) Section of parallel computation involving nonintensive operations (gray) executed on all nodes followed by CPU intensive operations distributed among all nodes (blue) and communication (red). b) Reading section involving nonintensive operations (gray) executed on all nodes followed by reading of input by the master only (green) and communication of values of input variables (red). [Color figure can be viewed in the online issue, which is available at wileyonlinelibrary.com.]
Our parallelization protocol implies that all nonparallel and hence identical computation is performed on all nodes. This is performed without additional time needed and has the advantage that the nodes have access to relevant data with a minimum of communication before sections with parallel computation. To get this working, reading done by the master has to be followed by a distribution of the values of the variables read from the master to the slaves, see Figure 8b.
Case Studies
In this section, we will provide examples of model systems that have been investigated using MOLSIM. During its existence, MOLSIM has been developed for simulation of all‐atom and different coarse‐grained levels of molecular systems. As to all‐atom models, mainly water and aqueous solutions of ions and small solutes, in particular with polarizable potentials, have been examined.19, 20, 21, 22 Most of the coarse‐grained applications of MOLSIM studies fall within the field of soft matter.
In the following, we will focus on the coarse‐grained applications of MOLSIM in soft matter. These applications have here been divided into: (i) dipolar fluids, (ii) colloids, (iii) biocolloids, (iv) polymers, and (v) crosslinked networks. We will provide a few examples of each category, including key references, to illustrate the flexibility and capacity of MOLSIM and to inspire new investigations.
Dipolar systems
There are intrinsic problems in simulating dipolar fluids due to the long‐range nature of the dipole–dipole interaction. Long‐range solvation properties of strongly coupled dipolar systems simulated using the Ewald and reaction‐field methods have been assessed using electric fluctuation formulas for a dielectric medium. Some components of the fluctuating electric multipole moments are suppressed (blue and black curves in Fig. 9a), whereas other components are enhanced (green, yellow, and red curves in Fig. 9a) as the boundary of the simulation box is approached. The splitting among the curves is attributed to the boundary condition and does not appear in an isotropic system. Furthermore, the results obtained using the reaction‐field method were very similar to those obtained using the Ewald method. Hence, we attribute the similar features to the use of toroidal boundary conditions applied in both methods. Finally, our results imply that the long‐range solvation properties of polar liquids simulated using either of the two methods should be handled with care.
Figure 9.
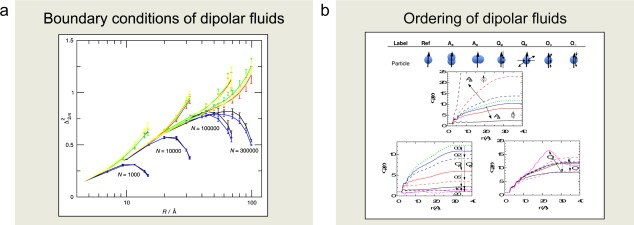
Illustration of dipolar systems investigated comprising a) examination of the influence of the Ewald sum boundary condition of dipolar fluids and b) a study of ordering in dipolar fluids when the shape or the interaction of the spherical dipoles are perturbed. Key references: a) Refs. [23, 24] and b) [25, 26]. a) Reprinted with permission from J. Chem. Phys. 2009, 131, 164507. Copyright 2009, AIP Publishing LLC. b) Reprinted with permission from J. Stat. Phys. 2011, 145, 418–440.
What causes dipolar fluids to have a high dielectric permittivity and what molecular properties affect it? These questions have been investigated by MD simulations of dipolar fluids with various molecular shapes and additional higher order electrostatic moments. The dipole polarization was found to decrease as the particles were elongated parallel to the dipole and to increase for elongations perpendicular to the dipole, eventually forming a nematic order (Fig. 9b). Moreover, the addition of a quadrupole leads to a reduction of the polarization, and the influence of an axial octupole is weaker and more complex—both a decrease and an increase of the polarization were found. These observations were attributed to the unlike parities of dipoles and of quadrupoles and the same parity of a dipole and an axial octupole under reflection. In addition, further insights into the formation of dipole polarization were obtained—short polar and long equatorial radii and strong dipole–dipole interactions are particle properties that promote a fluid with a high dipole polarization.
Colloidal systems
Coulomb interactions in solutions with an inhomogeneous dielectric permittivity are ubiquitous. In such systems, many‐body polarization charges appear, which makes simulations studies more challenging. To reduce the computational effort, we have recently presented rapidly convergent expressions for the Green's function of the Poisson equation for spherically symmetric systems, in which the dielectric constant varies discontinuously in the radial direction. These expressions have been used in MC simulations of six types of systems, having either (i) a uniform surface charge distribution, (ii) a uniform volume charge distribution, or (iii) mobile ions (Fig. 10a). The ions were neutralized by mobile counterions. Resulting ion density distributions determined for different dielectric boundary conditions are also shown in Figure 10a. The inclusion of the dielectric inhomogeneity leads to only a 2.5‐fold increase of the computational effort, which is modest for this type of model.
Figure 10.
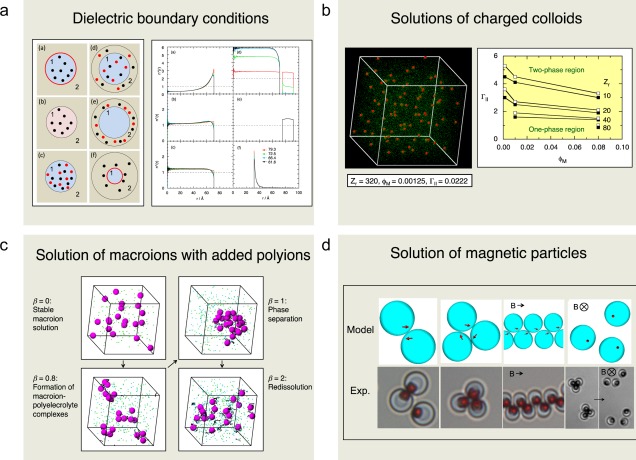
Illustration of colloidal systems comprising a) examination of a new and rapid algorithm for dealing with dielectric discontinuities in spherical geometry, b) charged colloidal solution including the limit of strong electrostatic interaction, in which attractive ion‐ion correlation interactions appears, c) structure and stability of solutions of macroions with oppositely charged polyions added, and d) organization of magnetic particles with an off‐centered embedded magnetic dipole at zero and non‐zero magnetic field. Key references: a) Refs. [27, 28], b) [29, 30], c) [31, 32], and d) [33]. a) Reprinted with permission from J. Chem. Phys. 2014, 140, 044903. Copyright 2014, AIP Publishing LLC. b) Reprinted with permission from J. Chem. Phys. 2000, 113, 4359–4373. Copyright 2014, AIP Publishing LLC. c) Reprinted with permission from Macromolecules 2003, 36, 508–519. Copyright (2003) American Chemical Society.
Most colloids are charged and their Coulomb interaction governs the physico‐chemical properties of colloidal suspensions. Extensive sets of MC simulations of highly charged spherical macroions and small ions have been performed. In particular, net‐attractive interactions among the colloids appeared at high electrostatic coupling (Fig. 10b), for example, with trivalent counterions in aqueous solution. This finding contradicts the mean‐field Derjaguin–Landau–Verwey–Overbeek theory, one of the cornerstones of colloid science, which predicts a purely repulsive electrostatic force among like‐charged colloidal particles under all conditions. Moreover, our results are consistent with similar findings of an attraction of electrostatic origin between two like‐charged planar surfaces at sufficiently large electrostatic couplings. A detailed analysis of the counterion distribution in the neighborhood of two macroions close to each other for divalent counterions, the effect of salt addition, and potential of mean forces have also been performed.
The charge stabilization of charged colloids is challenged by the addition of oppositely charged polyions. Polymers are often added to regulate colloidal stability, but polymers may also appear as an unwanted side effect. Model systems with focus on the electrostatic interactions have been used to examine complexation, phase separation, and redissolution in polyelectrolyte‐macroion solutions by means of MC simulations. As oppositely charged polyelectrolytes are added, the stable like‐charged macroion solution (i) becomes successively less stable, (ii) then unstable, and (iii) finally stable again by a redissolution process (Fig. 10c). The effect of the macroion radius, the chain length, and the chain flexibility on the phase separation has also been investigated. A semiflexible chain displayed a smaller tendency to promote phase instability as compared with flexible and stiff chains, the origin most likely being the similarity between chain persistence length and macroion radius.
Magnetic particles are added to fluids as a mean to control rheological properties of the fluid. So far, particles with a central magnetic moment have mostly been examined. However, spherical colloids possessing an off‐centered embedded magnetic dipole have recently been synthesized and triggered MC simulations of fluids of such magnetic colloids. In the absence of an external field, the colloids form dimers and trimers at sufficiently large magnetic moment without the tendency of forming chains as seen in systems with particles possessing a central magnetic dipole (Fig. 10d). In the presence of an external field, chains of colloids aligned in a zigzag fashion were formed for a field parallel to the plane of the particles, whereas the colloidal ordering was suppressed in the presence of a field perpendicular to that plane. The findings agree surprisingly well with the recent experimental observations on fluids containing spherical polymer colloids with embedded single‐domain magnetic hematite cubes.
Biocolloidal systems
The physical properties of viruses have been subjected a strong growing interest during the last decade. Great progress has been made both by theory and simulation studies using models on different levels.
Structural features of polyelectrolytes such as single‐stranded RNA and double‐stranded DNA confined inside viral capsids and the thermodynamics of the encapsidation of the polyelectrolyte into the viral capsid have been examined for various polyelectrolyte lengths and flexibilities using a coarse‐grained model solved by MC simulations (Fig. 11a). The capsid was modeled as a spherical shell with embedded charges and the genome as a linear jointed chain of oppositely charged beads with sizes corresponding to those of a scaled‐down T = 3 virus. Counterions were explicitly included, but no salt was added. The encapisdated chain was found to be predominantly located at the inner capsid surface, in a disordered manner for flexible chains and in a spool‐like structure for stiff chains. The distribution of the small ions is strongly dependent on the polyelectrolyte‐capsid charge ratio. The encapsidation enthalpy is negative and its magnitude decreases with increasing polyelectrolyte length, whereas the encapsidation entropy displayes a maximum when the capsid and polyelectrolyte have equal absolute charges. The chain stiffness has only a relatively weak effect on the thermodynamics of the encapsidation.
Figure 11.
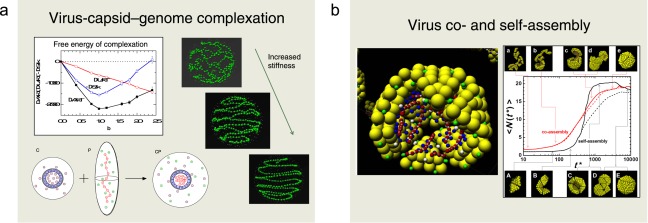
Illustration of biocolloidal systems comprising a) the thermodynamic stability of virus‐capsid–genome complexation at different genome–capsid charge ratio and genome organization at different genome stiffness and b) study of the kinetics of the self‐ and co‐assembly of single‐stranded viruses. Key references: a) Refs. [34,35] and b) Refs. [36,37]. [Color figure can be viewed in the online issue, which is available at wileyonlinelibrary.com.]
Furthermore, the actual capsomer–polyion co‐assembly process to form a virial capsid has been investigated by MD simulations using a more detailed model with capsomers as building blocks. Capsomers with different topology, charge distribution, and net charge were used. The kinetics of the capsid formation displays a two‐step process (Fig. 11b). The first step comprises adsorption of capsomers on the polyion, driven by their electrostatic attraction, whereas the second one involves a relocation and/or reorientation of adsorbed capsomers, whose rate is reduced on increasing the electrostatic interaction. We found that increased polyion branching facilitates a more rapid encapsidation process toward a higher yield. Moreover, the hyperbranched polyions were entirely encapsulated at all polyion–capsid charge ratios considered.
Polymer systems
Coarse‐grained models of polymers are very useful for understanding generic properties of polymers in a large variety of contexts. Many important properties of polymers are determined by their length and degree of flexibility. MOLSIM has been used to examine a broad range of polymers with different topology, involving uncharged and charged polymers in solution and at surfaces.
Polymers in solution often adsorb on surfaces. The dynamics of the adsorption from polymer solutions containing polymers of the same or different chain lengths has been studied by applying BD simulations. The rate of adsorption depends both on polymer length, polymer flexibility, and interactions. For example, the surface affinity of a polymer generally increases at increasing stiffness and the structure of the adsorbed layer differs (Fig. 12a, left). Furthermore, competitive adsorption was characterized by (i) a maximum in the adsorbed amount followed by a desorption of the polymer with the smallest surface affinity and (ii) a continued, but slower, growth of the adsorbed amount of the polymer with the largest surface affinity (Fig. 12a, right). Finally, the surface affinity difference between the polymer types of different length increased with increasing bead‐surface interaction.
Figure 12.
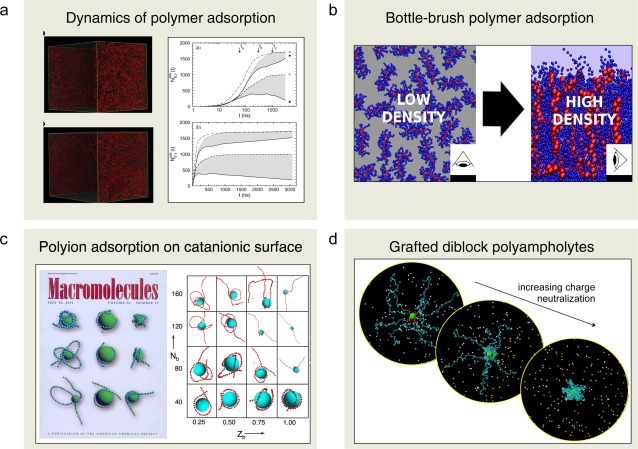
Illustration of polymer systems investigated by the software MOLSIM. Key references: a) Refs. [38, 39], b) [40, 41], c) [42, 43], and d) [44, 45]. a) Reprinted with permission from J. Phys. Chem. B 2010, 114, 3741–3753. Copyright (2010) American Chemical Society. b) Reprinted with permission from Langmuir 2014, 30, 11117–11121. Copyright (2014) American Chemical Society. c) Reprinted with permission from Macromolecules 2002, 35, 5183–5193. Copyright (2002) American Chemical Society. Reprinted with permission from J. Phys. Chem. B 2003, 107, 8011–8021. Copyright (2003) American Chemical Society. d) Reprinted with permission from Langmuir 2004, 20, 10351–10360. Copyright (2004) American Chemical Society. [Color figure can be viewed in the online issue, which is available at wileyonlinelibrary.com.]
Polymers are often chemically bonded to surfaces to establish a polymer layer, which prohibits other molecules to adsorb on the surface. Polymers with side chains, referred to as “bottle‐brush” polymers are known to be efficient in protecting surfaces. Structural and thermodynamic properties of surface‐grafted layers of bottle‐brush polymers have been investigated by MC simulation.
The effect of the side‐chain surface affinity on the brush properties was examined over a broad range of grafting densities. For low grafting densities, side‐chain adsorption causes the polymers to spread on the surface, whereas at high densities the polymers form a brush with the main chains oriented perpendicular to the surface (Fig. 12b). Furthermore, it was observed that the side‐chain adsorption strength is crucial for the structure of dilute layers but has little influence on the properties of dense brushes.
The complexation between a polyion and an oppositely charged spherical macroion constitutes a model for many technical as well as biological systems. Through model simulations, the characterization of such complexes has been made. The polyion length, its linear charge density, and its bare persistence length were varied systematically. The strongest and most compact complex, involving a collapsed polyion wrapping the macroion, is formed for a semiflexible chain. As the stiffness is increased, this state is transformed into a range of different structures comprising “tennis ball seam”‐like, solenoid, multiloop (“rosette”), and single‐loop arrangements as well as structures involving only a single polyion–macroion contact region (Fig. 12c). In particular, for long and highly charged polyions, a transition from the one‐tail state to a two‐tail state appears as the chain stiffness is increased.
Spherical brushes composed of diblock polyampholytes (diblock copolymers with oppositely charged blocks) grafted onto solid particles possess many interesting and tunable features. The structural properties of such particles have been investigated. It was found that the brush structure strongly depends on the charge of the inner block (Fig. 12d). In the limit of an uncharged inner block, the chains are stretched and form an extended polyelectrolyte brush. In the other limit with the charges of the blocks compensating each other, the chains are collapsed and form a polyelectrolyte complex surrounding the particles. At intermediate charge conditions, a polyelectrolyte brush and a polyelectrolyte complex coexist and constitute two substructures of the spherical brush. Subsequent simulations of solutions of such spherical brush particles displayed a wide range of solution stabilities depending on the charge status of the inner block of the diblock polyampholyte.
Network systems
Polyelectrolyte gels consist of charged polymer networks, counterions, and solvent. Polymer networks are usually synthesized by chemically cross‐linking charged or titrating polymers. Such gels possess unusual swelling properties and are, for example, used to make soft particles and are used in systems where water is desired to be retained, such as in hygiene products.
Models containing defect‐free three‐dimensional networks of a diamond‐like topology made of cross‐linked polyions have been investigated by means of MC simulations. The swelling of such gels were examined under different conditions (Fig. 13a), and pressure versus volume relations and chain extensions were determined and compared with those of the corresponding polyelectrolyte solution. A decrease in the gel volume was observed at decreasing charge density, increasing cross‐linking density, and decreasing chain stiffness. Exchanging the monovalent counterions for divalent counterions reduces substantially the equilibrium volume of the gel. In the swollen state, the network particles and the counterions are inhomogeneously distributed in space. The affine assumption, which states that a linear relation exists between chain end‐to‐end separation and macroscopic gel size, was found to be only of limited validity, whereas the Gaussian chain approximation was never fulfilled for polyelectrolyte gels.
Figure 13.
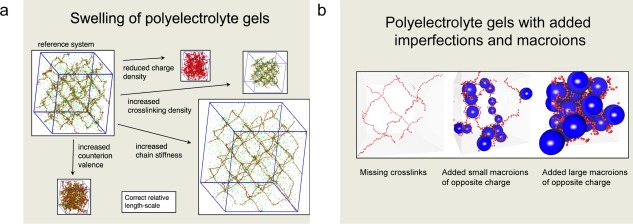
Illustration of crosslinked network systems comprising a) the swelling and structure of polyelectrolyte gels under a variety of alternating conditions and b) the impact of network imperfections and added macroions on the structure of polyelectrolyte gels. Polyelectrolyte gels consist of charged polymer networks, counterions, and solvent, and they are usually synthesized by chemically cross‐linking charged or titrating polymers. Key references: a) Refs. [46,47] and b) Refs. [48,49]. a) Reprinted with permission from J. Phys. Chem. B 2003, 107, 8030–8040. Copyright (2003) American Chemical Society. b) Reprinted with permission from Langmuir 2006, 22, 3836–3843. Copyright (2006) American Chemical Society. [Color figure can be viewed in the online issue, which is available at wileyonlinelibrary.com.]
The volume and structural changes on replacement of oppositely charged network counterions with oppositely charged macroions in cross‐linked polyelectrolyte gels have also been considered. Initially, the gel deswells, but after adding an approximately equivalent amount of macroion charges to those of the gel, the gel starts to swell again. The deswelling effect is greatest for small and highly charged macroions (Fig. 13b). The initial deswelling is understood in terms of a replacement of confined counterions with macroions, thereby reducing the osmotic pressure originating from the counterions. At these conditions, macroions are located near network nodes with various numbers of network chains wrapping them. At charge equivalence, a profound change in the network structure appears. At these conditions, the cohesive electrostatic interaction and the excluded volume effect of the macroions strongly influence the equilibrium volume of the gel. The model system reproduces many characteristic experimental observations of polyelectrolyte gels containing oppositely charged surfactants.
Acknowledgments
Past and present developers of MOLSIM including Anna Akinchina, Fredrik Carlsson, Samuel Edgecombe, Yoshikatsu Hayashi, Pascal Hebbeker, Niklas Källrot, Björn Linse, Vladimir Lobaskin, Thomas M. Nymand, Alberto Pais, Stefanie Schneider, Marie Skepö, Joakim Stenhammar, Anders Wallqvist, Jos van Rijssel, Erik Wernersson, and Per‐Olof Åstrand are gratefully acknowledged for dedicated work. We also thank Pascal Hebbeker, Jos van Rijssel, and Joakim Stenhammar for valuable comments on an earlier version of the manuscript.
How to cite this article: Reščič J., Linse P.. J. Comput. Chem. 2015, 36, 1259–1274. DOI: 10.1002/jcc.23919 25994597
References
- 1. Leach A. R., Molecular Modeling: Principles and Applications; Longman: Edinburgh, 1996. [Google Scholar]
- 2. Allen M. P., Tildesley D. J., Computer Simulation of Liquids; Clarendon Press: Oxford, 1989. [Google Scholar]
- 3. Frenkel D., Smit B., Understanding Molecular Simulation; Academic Press: London, 1996. [Google Scholar]
- 4. Rapaport D. C., The Art of Molecular Dynamics Simulation; Cambridge University Press: Cambridge, 1995. [Google Scholar]
- 5. Field M. J., A Practical Introduction to the Simulation of Molecular Systems; Cambridge University Press: Cambridge, 1999. [Google Scholar]
- 6. Salomon‐Ferrer R., Case D. A., Walker R. C., WIREs Comput. Mol. Sci. 2013, 3, 198 URL: http://ambermd.org [Google Scholar]
- 7. Brooks B. R., C. L. Brooks, III , Mackerell A. D., Nilsson L., Petrella R. J., Roux B., Won Y., Archontis G., Bartels C., Boresch S., Caflisch A., Caves L., Cui Q., Dinner A. R., Feig M., Fischer S., Gao J., Hodošček M., Im W., Kuczera K., Lazaridis T., Ma J., Ovchinnikov V., Paci E., Pastor R. W., Post C. B., Pu J. Z., Schaefer M., Tidor B., Venable R. M., Woodcock H. L., Wu X., Yang W., York D. M., Karplus M., J. Comput. Chem. 2009, 30, 1545 URL: http://www.charmm.org [DOI] [PMC free article] [PubMed] [Google Scholar]
- 8. Smith W., Forester T. R., J. Mol. Graph. 1996, 14, 136 URL: http://www.stfc.ac.uk/SCD/research/app/ccg/software/DL_POLY/44516.aspx [DOI] [PubMed] [Google Scholar]
- 9. Arnold A., Lenz O., Kesselheim S., Weeber R., Fahrenberger F., Röhm D., Košovan P., Holm C., ESPResSo 3.1—Molecular Dynamics Software for Coarse‐Grained Models. Meshfree Methods for Partial Differential Equations VI, Vol. 89 of Lecture Notes in Computational Science and Engineering; Griebel M., Schweitzer M. A., Eds.; Springer: Heidelberg, 2013; pp. 1–23 URL: http://espressomd.org/. [Google Scholar]
- 10. Pronk S., Páll S., Schulz R., Larsson P., Bjelkmar P., Apostolov R., Shirts M. R., Smith J. C., Kasson P. M., van der Spoel D., Hess B., Lindahl E., Bioinformatics 2013, 29, 845 URL: http://www.gromacs.org [DOI] [PMC free article] [PubMed] [Google Scholar]
- 11. Christen M., Hünenberger P. H., Bakowies D., Baron R., Bürgi R., Geerke D. P., Heinz T. N., Kastenholz M. A., Kraütler V., Oostenbrink C., Peter C., Trzesniak D., Van Gunsteren W. F., J Comput. Chem. 2005, 26, 1719 URL: http://www.gromos.net [DOI] [PubMed] [Google Scholar]
- 12. Plimpton S. J., J. Comput. Phys. 1995, 117, 1 URL: http://lammps.sandia.gov/ [Google Scholar]
- 13. Friedberg R., Cameron J. E., J. Chem. Phys. 1970, 52, 6049. [Google Scholar]
- 14. Berendsen H. J. C., Postma J. P. M., van Gunsteren W. F., Dinola A., Haak J. R., J. Chem. Phys. 1984, 81, 3684. [Google Scholar]
- 15. Andrea T. A., Swope W. C., Andersen H. C., J. Chem. Phys. 1983, 79, 4576. [Google Scholar]
- 16. Essmann U., Perera L., Berkowitz M. L., Darden T., Lee H., Lee G. Pedersen, J. Chem. Phys. 1995, 103, 8577. [Google Scholar]
- 17. Vesley F. J., J. Comput. Phys. 1977, 24, 361. [Google Scholar]
- 18. Ramírez J., Sikumren S. K., Vorselaares B., Likhtman A. E., J. Chem. Phys. 2010, 133, 154193. [DOI] [PubMed] [Google Scholar]
- 19. Linse P., J. Am. Chem. Soc. 1990, 112, 1744. [Google Scholar]
- 20. Åstrand P.‐O., Linse P., Karlström G., Chem. Phys. 1995, 191 195. [Google Scholar]
- 21. Nymand T. M., Åstrand P.‐O., J. Chem. Phys. 1997, 106, 8332. [Google Scholar]
- 22. Carignano M. A., Karlström G., Linse P., J. Phys. Chem. B 1997, 101, 1142. [Google Scholar]
- 23. Stenhammar J., Linse P., Karlström G., J. Chem. Phys. 2009, 131, 164507. [DOI] [PubMed] [Google Scholar]
- 24. Stenhammar J., Linse P., Karlström G., J. Chem. Phys. 2010, 32, 104507. [DOI] [PubMed] [Google Scholar]
- 25. Karlström G., Linse P., J. Stat. Phys. 2011, 145, 410. [Google Scholar]
- 26. Linse P., Karlström G., J. Stat. Phys. 2011, 145, 418. [Google Scholar]
- 27. Lue L., Linse P., J. Chem. Phys. 2011, 135, 224508. [DOI] [PubMed] [Google Scholar]
- 28. Linse P., Lue L., J. Chem. Phys. 2014, 140, 044903. [DOI] [PubMed] [Google Scholar]
- 29. Linse P., Lobaskin V., Phys. Rev. Lett. 1999, 83, 4208. [Google Scholar]
- 30. Linse P., J. Chem. Phys. 2000, 113, 4359. [Google Scholar]
- 31. Skepö M., Linse P., Phys. Rev. E 2002, 66, 051807. [DOI] [PubMed] [Google Scholar]
- 32. Skepö M., Linse P., Macromolecules 2003, 36, 508. [Google Scholar]
- 33. Abrikosov A. I., Sacanna S., Philipse A. P., Linse P., Soft Matter 2013, 9, 8904. [Google Scholar]
- 34. Angelescu D. G., Bruinsma R., Linse P., Phys. Rev. E 2006, 73, 041921. [DOI] [PubMed] [Google Scholar]
- 35. Angelescu D. G., Linse P., Nguyen T. T., Bruinsma R. F., Eur. Phys. J. E 2008, 25, 323. [DOI] [PubMed] [Google Scholar]
- 36. Zhang R., Wernersson E., Linse P., RCS Adv. 2013, 3, 25258. [Google Scholar]
- 37. Zhang R., Linse P., J. Chem. Phys. 2014, 140, 244093. [DOI] [PubMed] [Google Scholar]
- 38. Källrot N., Linse P., J. Phys. Chem. B 2010, 114, 3741. [DOI] [PubMed] [Google Scholar]
- 39. Linse P., Soft Matter 2012, 8, 5140. [Google Scholar]
- 40. Wernersson E., Linse P., Langmuir 2013, 29, 10455. [DOI] [PubMed] [Google Scholar]
- 41. Wernersson E., Linse P., Langmuir 2014, 30, 11117. [DOI] [PubMed] [Google Scholar]
- 42. Akinchina A., Linse P., Macromolecules 2002, 35, 5183. [Google Scholar]
- 43. Akinchina A., Linse P., J. Phys. Chem. B 2003, 107, 8011. [Google Scholar]
- 44. Akinchina A., Shusharina N. P., Linse P., Langmuir 2004, 20, 10351. [DOI] [PubMed] [Google Scholar]
- 45. Akinchina A., Linse P., Langmuir 2007, 23, 1465. [DOI] [PubMed] [Google Scholar]
- 46. Schneider S., Linse P., Eur. Phys. J. E 2002, 8, 457. [DOI] [PubMed] [Google Scholar]
- 47. Schneider S., Linse P., J. Phys. Chem. B 2003, 107, 8030. [Google Scholar]
- 48. Edgecombe S., Schneider S., Linse P., Macromolecules 2004, 37, 10089. [Google Scholar]
- 49. Edgecombe S., Linse P., Langmuir 2006, 22, 3836. [DOI] [PubMed] [Google Scholar]


