

Abstract
Objective
Parkinson's disease (PD) often entails impairments of executive functions, such as planning. Although widely held that these impairments arise from dopaminergic denervation of the striatum, not all executive functions are affected early on, and the underlying neural dynamics are not fully understood. In a combined longitudinal and cross‐sectional study, we investigated how planning deficits progress over time in the early stages of PD compared to matched healthy controls. We used functional magnetic resonance imaging (fMRI) to identify accompanying neural dynamics.
Methods
Seventeen PD patients and 20 healthy controls performed a parametric Tower of London task at two time points separated by ∼3 years (baseline and follow‐up). We assessed task performance longitudinally in both groups; at follow‐up, a subset of participants (14 patients, 19 controls) performed a parallel version of the task during fMRI. We performed meta‐analyses to localize regions‐of‐interest (ROIs), that is, the bilateral dorsolateral prefrontal cortex (DLPFC), inferior parietal cortex, and caudate nucleus, and performed group‐by‐task analyses and within‐group regression analyses of planning‐related neural activation. We studied task‐related functional connectivity of seeds in the DLPFC and caudate nucleus.
Results
PD patients, compared with controls, showed impaired task performance at both time‐points, while both groups showed similar performance reductions from baseline to follow‐up. Compared to controls, patients showed lower planning‐related brain activation together with decreased functional connectivity.
Conclusion
These findings support the notion that planning is affected early in the PD disease course, and that this impairment in planning is accompanied by decreases in both task‐related brain activity and connectivity. Hum Brain Mapp 36:3703–3715, 2015. © 2015 The Authors Human Brain Mapping Published by Wiley Periodicals, Inc.
Keywords: functional connectivity, frontostriatal, frontoparietal, executive function, cognitive load
INTRODUCTION
Although classically considered a motor disorder, Parkinson's disease (PD) patients also often suffer from cognitive deficits [Aarsland et al., 1999; Kaasinen and Rinne, 2002; Kudlicka et al., 2011; Owen, 2004]. In particular, PD is associated with impairment of the executive functions, including working memory [Kehagia et al., 2010], set shifting [Cools et al., 2001], and planning of goal‐directed behaviour [Owen et al., 1995]. Executive functioning refers to higher cognitive functions that strongly rely on the prefrontal cortex and the associated functional circuits that involve the striatum, as well as more posterior regions, such as the inferior parietal cortex [Elliott, 2003]. The striatum is highly connected to the cortex via multiple cortico‐striato‐thalamico‐cortical (CSTC) loops, which are not only involved in motor functions [Voorn et al., 2004], but also in cognitive performance [Chudasama and Robbins, 2006; Elliott, 2003]. Dopaminergic afferents to the striatum critically influence activity within the prefrontal cortical areas involved in executive functions through the CSTC loops [Cools, 2011]; the prefrontal cortex in turn is imbedded in additional cortico‐cortical loops, such as the fronto‐parietal system, which is especially important in visuospatial working memory [Diwadkar et al., 2000] and spatial planning [Newman et al., 2003].
Executive dysfunction in PD is assumed to be caused, at least partly, by dopaminergic denervation of the striatum [Cools, 2006] and concomitant dysfunction of the CSTC loops. Imaging studies demonstrate that these CSTC loops and fronto‐parietal networks are impaired even in early stages of PD before executive impairment at the behavioural level is evident [Monchi et al., 2007; Trujillo et al., 2015]. In early‐stage PD, functional connectivity is impaired in both task‐related and resting‐state networks [Olde Dubbelink et al., 2014, 2013; Stoffers et al., 2008]. As progressive dopamine depletion is associated with further decline in the signal‐to‐noise ratio between dopaminergic neuronal assemblies [Cools and D'Esposito, 2011; Kroener et al., 2009], decreased functional connectivity in PD is believed to be the result of impaired communication between brain areas [Mattay et al., 2002]. Whether task‐related network activation in early stage PD is increased or decreased seems to depend on the characteristics and complexity of the employed cognitive task. In tasks of visuospatial working memory [Trujillo et al., 2015] and set‐shifting [Gerrits et al., 2015], for example, PD patients perform the tasks with similar accuracy to that of healthy controls, but show hyperactivation of task‐related regions relative to controls . Conversely, behavioural deficits are apparent during verbal working memory tasks that were accompanied by decreased task‐related activity [Ekman et al., 2012; Lewis et al., 2003]. These results suggest that in early PD, impaired performance is accompanied by decreased task‐related activity, whereas intact behavioural performance is associated with compensatory increased activity.
Proper functioning of these executive circuits is thus necessary for executive tasks such as planning, which involves thinking ahead in a goal‐directed manner before taking any action [Jurado and Rosselli, 2007]. An often‐used measure of goal‐directed planning is performance on the Tower of London (ToL) task, which requires participants to mentally manipulate a configuration of beads stacked on posts of varying lengths to reach an end‐goal configuration [Shallice, 1982]. Neuroimaging studies have consistently shown that this task causes robust activation of the bilateral dorsolateral prefrontal cortex, inferior parietal cortex, and the caudate nucleus in healthy populations [Boghi et al., 2006; Dagher et al., 1999; van den Heuvel et al., 2003]. Therefore, the ToL task is a well‐suited paradigm to probe CSTC and fronto‐parietal functioning in psychiatric and neurological disorders characterized by fronto‐striatal and fronto‐parietal failure, such as obsessive‐compulsive disorder [van den Heuvel et al., 2005] and related anxiety disorders [van den Heuvel et al., 2011], schizophrenia [Eisenberg and Berman, 2010], and PD [Owen, 2004; Williams‐Gray et al., 2007]. With our study we sought to expand upon previous findings by using cross‐sectional neuroimaging, combining task‐related activation, network connectivity, and performance over time.
We therefore used a parametric self‐paced visuospatial ToL task [van den Heuvel et al., 2003]. Participants performed this task at two separate time points, that is, at baseline and after ∼3 years, to compare performance longitudinally in a group of PD patients as well as a group of matched healthy controls. We additionally administered the test during a functional magnetic resonance imaging (fMRI) session at the second time point, to study task‐related neural activity and network connectivity. In this way, we aimed to gain insight into (1) group differences in planning‐related neural activation and network connectivity during task performance, and (2) how behavioural performance declines with aging across the groups, contingent upon variable cognitive load. Based on an a priori interest in the fronto‐striatal and fronto‐parietal systems, we chose a meta‐analytic approach for defining and localizing regions‐of‐interest (ROIs) specific to our task and contrasts, without being biased by our own results. Based on our meta‐analyses of studies using the ToL, we specifically investigated the bilateral dorsolateral prefrontal cortex, bilateral inferior parietal cortex, and bilateral caudate nucleus. Additionally, we assessed task‐related functional connectivity of the dorsolateral prefrontal cortex using a generalized form of task‐dependent psychophysiological interactions (gPPI) [O'Reilly et al., 2012] analysis.
Muslimović demonstrated that PD patients are already impaired on the ToL task at an early stage [Muslimović et al., 2005] and exhibit a stronger decline in planning accuracy over time when compared to controls [Muslimović et al., 2009]; we therefore hypothesize that our patient group will likewise show decreased task performance with a more pronounced decline in performance at follow‐up and, based on the complexity of the task, decreased activity in task‐related areas compared to controls. We also expect, based on recent connectivity analyses from our group [Trujillo et al., 2015], decreased task‐related network connectivity in the PD group compared to controls.
MATERIALS AND METHODS
Participants
Participants were recruited as part of a follow‐up study from a previously established cohort from our group [Gerrits et al., 2015; Trujillo et al., 2015; Vriend et al., 2015]. Twenty non‐demented patients with early stage, mostly de novo (i.e., naïve to dopamine replacement therapy) PD and 21 healthy controls participated in this study. Participants performed two parallel versions of a Tower of London task, twice outside the scanner (ToL‐out), at two time points separated by an average of 3.16 years, and once in the MR scanner (ToL‐in), at the second time point. The study design and exclusion process are graphically depicted in Figure 1a. Outliers were defined as having an overall average task accuracy of more than 1.5 times the interquartile interval below the group median, or below chance level (50% for ToL‐in, 20% for ToL‐out). After exclusion, our total sample size consisted of 17 PD patients (mean age: 60.2 ± 8.9 years) and 20 healthy controls (mean age: 58.4 ± 9.7 years) in the ToL‐out version, and 14 PD patients and 19 healthy controls in the ToL‐in version (note that the ToL‐in and ToL‐out groups, although slightly different, did not differ significantly in their demographic data, and all subjects included in the MRI analysis were also included in the behavioural analyses).
Figure 1.
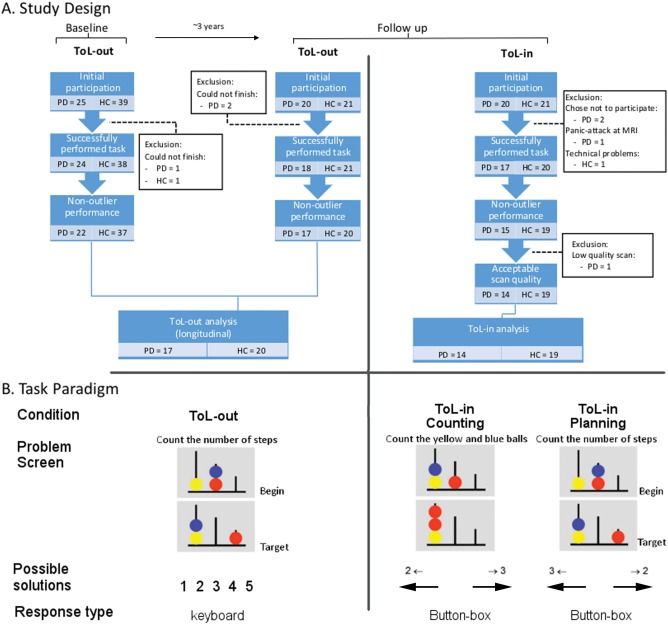
Study design and task paradigm. A. Study design and exclusion process. B. Task paradigm. On the left, an example from the out‐of‐scanner version. In the middle, an example of the counting condition for the in‐scanner version. On the right, an example of the planning condition from the in‐scanner version. Possible user responses are indicated beneath corresponding example images, and response type is indicated below this. All text has been translated from Dutch to English for the purpose of this figure. ToL‐in: in‐scanner version of the Tower of London. ToL‐out: out‐of‐scanner version of the Tower of London. PD: Parkinson's disease. HC: healthy control.
The patients were diagnosed by a movement disorders specialist according to the UK PD Brain Bank criteria [Daniel and Lees, 1992] for idiopathic PD, supported by abnormal dopamine transporter single‐photon emission computed tomography (DaT‐SPECT) scans in 10 patients. The Unified PD Rating Scale Part III (UPDRS‐III) (Fahn et al. 1987) and Hoehn and Yahr stage [Hoehn and Yahr, 1967] were administered to assess disease severity and stage, respectively. We determined disease subtype (i.e., tremor dominant/akinetic) and disease lateralisation using the method described by Eggers et al. (2011). At baseline, two patients were already using dopaminergic medication; at follow‐up, all patients had begun dopamine replacement therapy. At the time of assessment at follow‐up, all patients were on their regular dopaminergic medication, and considered optimal ON. Total levodopa equivalent daily dosage (LEDD) scores were calculated at follow‐up [Olde Dubbelink et al., 2013]. All participants were screened for general cognitive status using the Mini‐Mental State Examination (MMSE) [Cockrell and Folstein, 1988], depressive symptoms using the Beck Depression Inventory (BDI) [Beck et al., 1996], and anxiety using the Beck Anxiety Inventory (BAI) [Beck et al., 1988]. None of the participants had a score of <24 on the MMSE, of >15 on the BDI [Beck and Beck, 1972], or >25 on the BAI [Beck et al., 1988]. We screened for the presence of psychiatric disorders using the short screening version of the Structured Clinical Interview for DSM‐IV Axis‐I Disorders (SCID‐I) [Spitzer et al., 1992]. The UPDRS‐III, Hoehn and Yahr stage, BDI, BAI, SCID‐I, and MMSE were administered at both time points. All participants provided informed consent, obtained according to the Declaration of Helsinki, and the study protocol was reviewed and approved by the Medical Ethical Committee of the VU University medical center.
Task Paradigm
A pseudo‐randomized self‐paced version of the ToL was used, discussed in detail elsewhere [van den Heuvel et al., 2003]. The version of the paradigm used outside the scanner consisted of five planning conditions, ranging in solution length from 1 to 5 moves (indicated hereafter as S1–S5), while the MRI version also included a counting condition (indicated hereafter as S0) which was used in the fMRI analysis as control condition. In the planning conditions, subjects saw a starting configuration together with a target configuration, with the instruction to “count the number of steps.” In both conditions, three coloured beads were placed on three vertical posts, which could accommodate up to one, two, or three beads each. One bead could be moved at a time and only when there was no other bead on top. Subjects were requested to determine the minimum number of moves necessary to reach the target configuration and to (a) press on the keyboard the number representing the correct number of steps (ToL‐out), or (b) press the button corresponding to the correct answer printed on the screen (ToL‐in). In the counting condition, subjects simply had to count the total number of yellow and blue beads on the screen. See Figure 1b for a visual representation of the task layout. The trials were presented in a pseudo‐randomized order to prevent overflow effects (i.e., perseverance of task‐related cognitive processes after a difficult trial), implicating that each trial of three or more moves was followed by a baseline trial. In the scanner, participants started with a short practice session to familiarize them with the task, during which feedback was given on their performance, but no scans were acquired. During the test run, no further feedback was provided. A maximum reaction time (RT) of 45 s for each trial was applied, after which the next stimulus was presented. The ToL‐out paradigm consisted of a total of 100 trials, while the ToL‐in paradigm consisted of 90 planning trials and 36 counting trials; both versions lasted on average approximately 20–25 min.
Image Acquisition
Functional MRI data were acquired on a Discovery* MR750 3.0T MRI scanner (General Electric, Milwaukee) at the VU University medical center using a gradient echo‐planar imaging (EPI) sequence (TR = 2100 ms; TE = 30 ms; 64 × 64 matrix; field of view = 24 cm; flip angle = 80°) with 40 descending slices per volume (3.75 × 3.75 mm in‐plane resolution; slice thickness = 2.8 mm; inter‐slice gap = 0.2 mm), that provided whole‐brain coverage. A sagittal three‐dimensional gradient‐echo T1‐weighted sequence (256 × 256 matrix; voxel size = 1 × 0.977 × 0.977 mm; 172 sections) was acquired for co‐registering the functional images.
DATA ANALYSIS
Behavioural Data
We assessed planning performance by calculating the overall percentage of correct responses with each condition per participant. For ToL‐out, we compared the two groups longitudinally using a mixed ANOVA with task‐load (levels: S1/S2/S3/S4/S5) and time (levels: baseline/follow‐up) as within‐subject factors and group (levels: PD patients/healthy controls) as between‐subject factor. For the ToL‐in, we similarly used an ANOVA with task‐load (levels: S1/S2/S3/S4/S5) as the within‐subject factor and group (levels: PD patients/healthy controls) as between subjects factor. In both analyses, we employed the Greenhouse‐Geisser correction when the assumption of sphericity was violated. ToL‐out scores at follow‐up were compared, per group, with ToL‐in scores using Wilcoxon signed‐rank tests to ensure consistent performance between the two versions. We additionally calculated relative change (rΔ) scores (i.e., follow‐up score—baseline score/baseline score) for the MMSE, and UPDRS‐III, as well as for accuracy and reaction‐time on the ToL. Age was compared between groups using an independent‐samples t‐test, while BDI and BAI scores were compared using the Mann–Whitney U‐test due to non‐normally distributed scores. Correlations between demographic and behavioural variables were calculated using linear regression; for non‐normally distributed variables we report statistics based on Spearman's rho (r s). Gender and handedness were compared using χ 2‐tests. All behavioural analyses were carried out in SPSS 20 (SPSS, Chicago, IL, USA).
Image Processing and Analysis
Pre‐processing and statistical analyses were performed in SPM8 (Wellcome Department of Imaging Neuroscience, London, UK) running in a Matlab environment (version 7.5, The MathWorks, Natick, MA, 2000). The echo‐planar imaging (EPI) images were reoriented and first slice‐time corrected, then realigned to the first image and unwarped using a least squares approach and a six parameter (rigid body) spatial transformation to correct for motion. They were subsequently normalised to the Montreal Neurological Institute (MNI) T1‐template, employing the co‐registered individual T1‐weighted image for estimation. Lastly, the images were smoothed with an 8 mm Gaussian kernel.
A design matrix was created to examine within‐subject effects in a first level GLM. We employed an event‐related design modelling all trials of all six conditions, using total reaction time as the event‐length. The first six regressors modelled the correctly answered trials in each of the six conditions of increasing difficulty: “S0,” “S1,” “S2,” “S3,” “S4,” and “S5.” Incorrect trials per condition (when present) as well as the six movement parameters that were calculated during the realignment were added to the model as nuisance covariates. The contrasts of interest were “planning,” defined as all planning conditions against control (−5 1 1 1 1 1), and “task‐load”, defined across the five planning conditions only, with the vector (0 −2.5 −1.5 −0.5 1 3.5). The weighted nature of the task‐load contrast is based on the uneven number of conditions and on the significant increase in reaction time during S4 compared to S3, and between S5 compared to S4 as opposed to the more gradual increase between the lower conditions. These contrasts were used for the whole brain GLM, region of interest, and gPPI analysis to examine the effect of planning cognitive load, corrected for baseline features of the task such as visuospatial processing and motor responses.
Contrast images derived from the first level analyses were used at the second (group) level, employing whole‐brain voxel‐wise independent t‐tests. Brain regions were identified using the WFU‐Pick Atlas (Wake Forest University, Winston‐Salem, NC, USA) [Maldjian et al., 2003].
ROI Selection
For the purpose of ROI selection we employed a selective meta‐analysis to find coordinates of task‐related activation specifically representative of planning and task‐load, separately. On the 6th of November, 2014, the electronic database PubMed was searched using the keywords “Tower of London,” “fMRI” and/or “PET.” Articles were considered for inclusion when (1) they used a similar task configuration, (2) they showed whole‐brain results reported in either Talairach or MNI coordinates (i.e., studies employing only a ROI approach were excluded), (3) they used a similar contrast (planning: all planning‐related conditions compared against a baseline; and/or task‐load: more difficult conditions compared against easier conditions), (4) they used mental calculation, as opposed to physically transforming the starting configuration into the target configuration, and (5) the study was performed in healthy participants.
The GingerALE 2.3 BrainMap application was used to generate quantitative voxel‐wise activation‐likelihood estimate (ALE) maps for the contrasts of interest. Input files of study foci were manually created for coordinate‐based data in both Talairach and MNI spaces, although the final ALE analysis was performed in MNI space. Any coordinates originally reported in Talairach space were therefore automatically converted to MNI space by the GingerALE software using the icbm2tal algorithm software. ALE values were computed for each voxel in the brain using the input foci. Based on the number of subjects, a Gaussian blur is then calculated for each foci group (study/paper), and the final ALE map is calculated by finding the union of these individual maps, as described by Eickhoff et al. [2011]. The resulting ALE maps then undergo cluster‐level thresholding using simulated datasets with the same characteristics as the true dataset and a False Discovery Rate of 0.05. This cluster‐level corrected threshold ensures that only 5% of the simulated data will exceed the calculated minimum cluster volume. The resultant clusters are representative of areas with a high likelihood of task‐related activation and are assigned anatomical labels at their weighted centers by the Talairach Daemon.
To investigate the primary regions of the fronto‐striatal and fronto‐parietal systems, we selected coordinates associated with the bilateral inferior parietal cortex, bilateral caudate nucleus, and bilateral dorsolateral prefrontal cortex from the list of task‐related clusters of the meta‐analysis. These six ROIs were selected separately from the meta‐analyses on the planning (vs. baseline) as well as the task‐load contrasts, resulting in a total of 12 ROIs (six for planning, six for task‐load). Coordinates for these regions are given in Table 1.
Table 1.
MNI coordinates for ROI analyses
| Planning | Task‐load | |||||
|---|---|---|---|---|---|---|
| x | y | z | x | y | z | |
| L DLPFC | −40 | 28 | 30 | −42 | 34 | 34 |
| R DLPFC | 32 | 34 | 42 | 44 | 32 | 32 |
| L caudate | −12 | 10 | 0 | −16 | 6 | 16 |
| R caudate | 12 | 8 | 0 | 18 | 4 | 16 |
| L IPC | −58 | −38 | 44 | −38 | −66 | 38 |
| R IPC | 48 | −42 | 46 | 50 | −44 | 50 |
L: left, R: right, DLPFC: dorsolateral prefrontal cortex, IPC: inferior parietal cortex.
MarsBaR (http://marsbar.sourceforge.net) was used to create spherical ROIs, centered around the meta‐analysis coordinates, with a 10 mm diameter. The average parameter estimates (beta weights) of the whole ROI were then extracted from the corresponding contrast per participant and were subsequently compared, first using a repeated‐measures ANOVA with region as within‐subjects factor and group as between‐subject factor. Significant group effects were further analyzed with post‐hoc multivariate ANOVAs.
Time courses were extracted from each of the individual ROIs, using the corresponding contrast, creating volumes of interest that were used in the gPPI analyses. These were extracted at a threshold of P = 0.5 to ensure robust time‐series.
Functional Connectivity
We assessed the task‐related functional connectivity of the bilateral DLPFC and bilateral caudate nucleus using a generalized form of context‐dependent psychophysiological interaction (gPPI) [O'Reilly et al., 2012]. A PPI analysis statistically tests in a whole‐brain voxel‐wise manner whether areas were functionally connected with the seed‐region during task performance [O'Reilly et al., 2012]. We chose gPPI, instead of the traditional PPI [Friston et al., 1997], as it allowed us to model all psychological task conditions into one first‐level design, thus improving the model‐fit [McLaren et al., 2012]. For the purpose of the gPPI analyses, the intersection between the ROI mask and the 1st level mask was individually calculated per subject by applying SPM imcalc with trilinear interpolation to these masks.
Our first‐level model included the correct trials for the six task conditions, incorrect trials per condition, the six convoluted PPI terms, the time‐series of the seed‐region, and the six movement parameters. We defined the planning and task‐load contrasts in the same way as for the GLM analysis, this time using the convoluted PPI terms and leaving the psychological variable (task conditions) and movement parameters as nuisance variables. For the eight separate analyses (left and right DLPFC—planning, task‐load; left and right caudate nucleus—planning, task‐load), all subjects in the GLM analysis could be included in the gPPI analysis, since all subjects exhibited significant BOLD effects in the ROI and had voxels that were functionally connected to the seed regions.
At second level, we compared the contrasts between groups using an independent samples t‐test and an uncorrected statistical threshold of P < 0.001 with a spatial extent threshold of k > 5. Group differences (i.e., voxels more active in one group compared to the other) were masked inclusively with the main effects of the group of interest, so that only voxels that were also found in the main effects are reported in the group interactions. The same analysis procedures were employed for all regions and contrasts.
Correlation with Dopamine Transporter Binding
For 10 of the included PD patients, single‐photon emission computerized tomography (SPECT) scans with a [123I]N‐ω‐fluoropropyl‐2β‐carbomethoxy‐3β‐(4‐iodophenyl) nortropane ([123I]FP‐CIT) tracer binding to the dopamine transporter (DaT) were available with an average interval between SPECT acquisition and baseline assessment of 55 (range: 26–123) days. We used these scans to calculate the age‐corrected binding ratios in the dorsal‐medial striatum [Vriend et al., 2014]. The ventral striatum was delineated on a canonical T1 image according to the method described by Tziortzi et al. [2013]. The dorsomedial striatum (referred to as the anterior‐dorsal striatum by Vriend et al. [2014]) was traced on the same coronal slices as the ventral striatum but a gap of 5 mm was left between the two ROI's to avoid spillover effects. These age‐corrected binding ratios were used to perform a post‐hoc analysis on the relation between striatal dopamine levels and task performance (using a correlation analysis on [123I]FP‐CIT uptake ratios and overall task accuracy) as well as cognitive stability across testing sessions (using a correlation analysis on uptake ratios and accuracy‐rΔ scores). The dorsal‐medial striatum was specifically chosen as region of interest for its role in goal‐directed behaviour [Cools, 2011]. Spearman's rho was used to calculate correlations with these uptake ratios, due to the smaller sample size.
RESULTS
Demographics
Our groups were matched for age, gender, handedness and the interval between baseline and follow‐up (see Table 2). Although PD patients had significantly higher anxiety (U = 40.50, P < 0.001) and depression (U = 83.50, P = 0.01) scores at follow‐up when compared to controls, both groups’ scores are still in the lower range of the scale and are not clinically relevant. PD patients, compared to controls, also had lower MMSE scores, both at baseline and follow‐up, though none fell below the typical cut‐off score for dementia of 23. Patients and controls did not differ significantly in their decline in MMSE scores between baseline and follow‐up. At follow‐up, the mean UPDRS‐III score and median Hoehn and Yahr stage were 27 and 2, respectively. Whereas none but two patients had started dopamine replacement therapy at baseline, at follow‐up all patients were using dopaminergic medication with an average LEDD of 450 ± 230 (range: 230–1760). For an overview of demographic and clinical scores at follow‐up, see Table 2; for clinical scores at baseline, see Supporting Information Table 1.
Table 2.
Mean and standard deviations for demographic and clinical data at follow‐up
| HC (n = 20) | PD (n = 17) | P‐value | |
|---|---|---|---|
| Demographics | |||
| Age (years) | 58.38 ± 9.67 (40 – 74) | 60.18 ± 8.91 (40 – 76) | P = 0.56 |
| Years between measures | 3.29 ± 1.13 (1.5 – 5.1) | 3.01 ± 0.9 (1.8 – 5.2) | P = 0.47 |
| Gender (% male) | 14 (70.0%) | 11 (64.7%) | P = 0.73 |
| Handedness (% right) | 19 (95.0%) | 14 (82.4%) | P = 0.39 |
| Education | 6.00 ± 1.00 (5 – 7) | 6.00 ± 2 (3 – 7) | P = 0.57 |
| Clinical measures | |||
| MMSE | 29.00 ± 1.00 (26 – 30) | 28.00 ± 1.50 (24 – 30) | P = 0.02* |
| MMSE‐rΔ | 0.002 ± 0.04 (−0.07 – 0.07) | −0.02 ± 0.05 (−0.07 – 0.08) | P = 0.24 |
| BDI | 2.00 ± 5.25 (0 – 7) | 4.00 ± 8.00 (1 – 15) | P = 0.01* |
| BAI | 0.50 ± 3.25 (0 – 7) | 6.00 ± 8.00 (2 – 25) | P < 0.01* |
| UPDRS‐III | 27.29 ± 7.82 (16 – 40) | ||
| UPDRS‐III‐rΔ | 1.28 ± 4.23 (−0.27 – 16.50) | ||
| Subtype (% mixed/% akinetic) | 4 (23.5%)/13 (76.5%) | ||
| Lateralization (% mixed/% left) | 15 (88.2%)/2 (11.8%) | ||
| Hoehn and Yahr | 2 ± 0.5 (1.5 – 3) | ||
| LEDD | 450 ± 255 (230 – 1760) | ||
| Behavioural measures | |||
| Task performance | 89.5 ± 16.25 (62 – 96) | 82 ± 18.92 (44 – 96) | P = 0.01* |
| Task reaction time (seconds) | 9.94 ± 2.06 (6.88 – 15.29) | 11.11 ± 4.08 (7.5 – 24.8) | P = 0.02* |
| Task performance‐rΔ | −0.01 ± 0.07 (−0.21 – 0.06) | −0.07 ± 0.12 (−0.30 – 0.07) | P = 0.43 |
| Reaction time‐rΔ | −0.05 ± 0.10 (−0.33 – 0.14) | −0.05 ± 0.16 (−0.28 – 0.25) | P = 0.83 |
Education represents Verhage stages; MMSE: mini‐mental state examination; MMSE‐Δ: relative change in MMSE score between baseline and follow‐up; BDI: Beck depression inventory; BAI: Beck anxiety inventory; UPDRS‐III: Unified Parkinson's disease rating scale, motor subscale; UPDRS‐III‐Δ: relative change in UPDRS‐III score between baseline and follow‐up; LEDD: total levodopa equivalent dosage; HC: Healthy controls; PD: Parkinson's disease patients. Significant at a threshold of P = 0.001 (uncorrected) with an extent‐threshold k > 5.
Behavioural Results, Based on ToL‐out data
Accuracy
Wilcoxon signed‐rank tests showed that follow‐up ToL‐out accuracy scores were comparable to ToL‐in scores both for the controls (Z= −0.71, P = 0.48), as well as for the PD patients (Z= −1.03, P = 0.30). Follow‐up ToL‐in reaction times were significantly faster than ToL‐out scores both for the controls (Z = −3.92, P < 0.01), as well as for the PD patients (Z = −2.89, P < 0.01). The omnibus test, containing performance of both groups at both time points across all difficulty levels, showed that PD patients, compared to controls, performed significantly worse on the task across both time points (F(1, 35) = 6.86, P = 0.013), that both groups performed worse with increasing task‐load (F(2.51, 87.96) = 83.66, P < 0.001), and that both groups performed overall worse at follow‐up compared to baseline (F(1, 35) = 10.89, P = 0.002). The overall load‐effect differed between the patients and controls (F(2.51, 87.96) = 8.92, P < 0.001), with patients having more difficulty with increasing task‐load. The effect of task‐load was also different between the two time points, regardless of group (F(2.66, 92.96) = 4.73, P = 0.006), with a stronger decline with increasing task‐load at follow‐up.
For both groups, the interval between baseline and follow‐up did not correlate with performance‐rΔ scores (PD: r 2 = 0.15, P = 0.58; HC: r s = −0.02 P = 0.95). Better task accuracy at follow‐up was related to lower anxiety scores in the control group (r s = −0.55, P = 0.02), though not for the patients (r 2 = 0.25, P = 0.35). In patients task accuracy at follow‐up did not correlate significantly with LEDD (r s = 0.18, P = 0.49), UPDRS‐III scores (r 2 = 0.05, P = 0.39), or Hoehn and Yahr stage (r s = −0.24, P = 0.35).
Reaction time
We found that PD patients, compared with controls, performed more slowly (F(1, 35) = 5.46, P = 0.025). Across both groups we also found faster reaction times at follow‐up compared to baseline (F(1, 35) = 6.01, P = 0.019), as well as an overall main effect of task‐load on reaction time, with longer reaction times at higher task‐loads (F(1.87, 65.27) = 308.66, P < 0.001), that was more pronounced at follow‐up compared to baseline (F(1.57, 54.95) = 7.45, P = 0.003). Group did not interact with task‐load (F(1.86, 65.27) = 1.09, P = 0.34), or with time point, that is, baseline versus follow‐up (F(1, 35) = 0.08, P = 0.78), nor was there an interaction between group and the time‐by‐task‐load interaction (F(1.57, 54.95) = 2.38, P = 0.11).
On average, higher accuracy on the task correlated with longer reaction time both for the controls (r 2 = 0.37, P = 0.005), as well as for the patients (r 2 = 0.37, P = 0.009). This correlation did not differ significantly between groups (Z = −0.03, P = 0.98).
For an overview of behavioural data at baseline, see Supporting Information Table 1.
Imaging Results: Regions of Interest
We found a significant difference in the correlation between age and average activation in the left and right IPC in the planning condition, (left: Z = −2.99, P < 0.01; right: Z = −2.44, P = 0.01). We therefore included age as a covariate in all ROI analyses to control for possible confounding effects.
Across all planning‐related ROIs, we found a significant main effect of group, F(1,30) = 5.73, P = 0.023, with PD patients displaying decreased activity (see Fig. 2). We found no interaction between group and region (F(3.01, 90.22) = 0.48, P = 0.69). Based on the average correlation of r = 0.36 between regions, we calculated an adjusted alpha of 0.02 for testing group differences for the individual ROIs. Under this adjusted alpha, post‐hoc analyses using ANOVA revealed no significant group differences for any of the individual ROIs, although three showed trends toward being significantly higher in controls; these regions being the left caudate nucleus (F(1, 30) = 3.478, P = 0.07), the right DLPFC (F(1,30) = 4.33, P = 0.05), and the right IPC (F(1, 31) = 4.25, P = 0.05). For an overview of whole‐brain results relating to the planning contrast, see Supporting Information Table 2.
Figure 2.
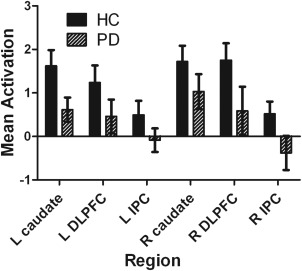
Mean activation estimates of planning in ROIs. Solid bars represent the control group, striped bars represent the PD group. On the y‐axis, the mean parameter estimate (beta weight) is given; along the x‐axis, the individual ROIs. PD: Parkinson's disease. DLPFC: dorsolateral prefrontal cortex. IPC: inferior parietal cortex. DLPFC: dorsolateral prefrontal cortex; IPC: inferior parietal cortex.
Across all load‐related ROIs we also found a significant main effect of group (F(1, 30) = 4.85, P = 0.04), again with PD patients showing decreased task‐related activity in comparison with the controls (see Fig. 3). After applying the Greenhouse‐Geisser correction, we also found a significant effect of task‐load on ROI activity (F(2.67, 80.16) = 3.56, P = 0.02). We found no group‐by‐task‐load interaction (F(2.67, 80.16) = 1.74, P = 0.17), nor did we find a group‐by‐region interaction (F(3.15, 94.38) = 1.81, P = 0.15). For an overview of the whole‐brain results relating to the task‐load contrast, see Supporting Information Table III.
Figure 3.
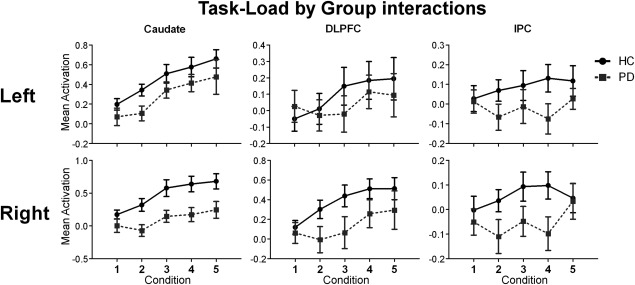
Mean activation estimates of group‐by‐task load for the ROIs. Solid black lines represent the control group, grey dashed lines represent the PD group. Individual plots represent the individual ROIs, with left lateralized regions along the top row and right lateralized regions along the bottom row. Within each plot, the y‐axis represents the mean parameter estimates (beta weight), while the x‐axis denotes the task‐load. DLPFC: dorsolateral prefrontal cortex; IPC: inferior parietal cortex.
Imaging Results: Functional Connectivity
Main effects
In the control group, the left DLPFC showed planning‐related connectivity with the right caudate nucleus, right precuneus (BA 7), right posterior cingulate cortex (BA 23 & 31) and the right middle frontal gyrus (BA 6 & 10), and load‐related connectivity with the bilateral precuneus (BA 7), left superior temporal gyrus (BA 22 & 39) and left ventrolateral part of the thalamus. In the PD group, the left DLPFC showed planning‐related connectivity with the left parahippocampal gyrus and the right insula; we found no load‐related connectivity in the PD group for the left DLPFC.
In the control group, the right DLPFC only showed planning‐related connectivity with the brainstem, but load‐related connectivity with the left precuneus (BA 7), left IPC, and right posterior cingulate cortex (BA 31). Compared to the PD group, the control group showed significantly stronger right DLPFC load‐related connectivity with the bilateral IPC, left precuneus (BA 7), left superior parietal cortex (BA 7), and right middle occipital gyrus. The PD group showed planning‐related right DLPFC connectivity with the left inferior frontal gyrus (BA 47), and no load‐related connectivity.
In the control group, we found no significant planning‐related connectivity with the left caudate nucleus. In the PD group, we found planning‐related connectivity between the left caudate and left IPC (BA 40), left inferior frontal gyrus (BA 46), left precentral gyrus (BA 44), and several posterior regions.
In the control group, the right caudate nucleus showed planning‐related connectivity with the left inferior frontal gyrus (BA 45 & 46), right middle frontal gyrus (BA 9) and the left ventrolateral nucleus of the thalamus. In the PD group, the right caudate nucleus showed planning‐related connectivity with the bilateral IPC (BA 40), left inferior frontal gyrus (BA 44 & 46), left middle frontal gyrus (BA 10), right posterior cingulate cortex (BA 31), and left precuneus (BA 7).
For an overview of the main effects by group of DLPFC connectivity see Supporting Information Tables IV and V; for the main effects by group of caudate nucleus connectivity, see Supporting Information Tables VI and VII.
Group differences
Compared to the PD group, the control group showed significantly stronger load‐related right DLPFC connectivity with the left precuneus (BA 7), bilateral IPC, left superior parietal cortex (BA 7), and right middle occipital gyrus.
Dopamine‐Transporter Binding
Although not directly correlated with task scores at follow‐up (r s = 0.48, P = 0.16), higher DaT‐SPECT ratios correlated significantly with a more positive relative change in accuracy scores from baseline to follow‐up (r s = 0.69, P = 0.03, see Fig. 4).
Figure 4.
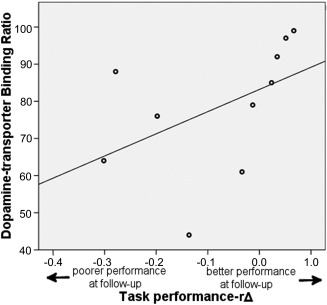
Correlation with dopamine‐transporter binding ratios and performance over time. On the y‐axis, dopamine‐transporter binding ratios are indicated, while on the x‐axis, the relative accuracy difference is indicated. Negative numbers represent poorer performance at follow‐up compared to baseline, while positive numbers represent better performance at follow‐up compared to baseline. Correlation: r s = 0.69, P = 0.03.
DISCUSSION
We initially hypothesized that patients would show impaired planning performance and a stronger decrease in performance over time compared with controls, concomitant with hypoactivation of task‐related areas and decreased connectivity in task‐related networks. Across both time points patients performed overall worse than healthy controls and had more difficulty with increasing task‐load. Nevertheless, age‐related decline was comparable between groups. In line with our hypothesis, PD patients, compared with controls, showed lower task‐relevant network activation both related to planning as well as to increasing task‐load. Lower task‐related functional connectivity was seen in the fronto‐parietal network of PD patients.
As expected, our meta‐analyses and whole‐brain analyses demonstrated a strong recruitment of the fronto‐parietal and fronto‐striatal systems during the ToL task, both for general planning as well as for increasing task‐load, although the specific locations of the foci differed slightly between planning and task‐load. This may indicate a finer functional segregation in these areas for dealing with general planning as opposed to increasing cognitive load.
Our finding of impaired task performance is in agreement with previous studies on planning in PD [Muslimović et al., 2005; Owen et al., 1998, 1992]. In contrast to our hypothesis and the findings of Muslimović et al. [2009], however, we found similar performance decline over time in both patients and controls. This may be due to a slightly younger group of patients in our study (mean: 60 years at follow‐up) compared to those showing decline in Muslimovic's group (mean: 69 years at follow‐up). Although the change in task accuracy over the course of the study was similar in both patients and controls, we additionally showed that in patients this change was predicted by the amount of dopamine‐transporter binding at baseline. Our results show that patients with higher baseline DaT‐binding ratios in the dorsomedial striatum had a less pronounced decline in performance from baseline to follow‐up compared to those with lower DaT‐binding: this indicates that baseline dopamine‐transporter levels may not predict performance per se, but rather the resilience to cognitive decline; or inversely stated, lower baseline dopamine‐transporter levels signify a higher rate of subsequent disease‐related cognitive decline. It may also indicate that these patients, in terms of striatal dopaminergic deterioration, were simply less affected by the disease at baseline and therefore had a larger reserve serving to protect from cognitive deterioration. It is possible that this relationship is due to a selection bias, as several patients dropped out between baseline and follow‐up. Erixon‐Lindroth and colleagues, however, previously demonstrated that striatal dopamine loss mediates age‐related cognitive decline [Erixon‐Lindroth et al., 2005] and our results complement this finding by showing that striatal dopamine denervation—already present in early PD—may also predict the rate of cognitive decline. The parallel decline in cognitive performance with the healthy control group may also be due to the addition of dopaminergic medication, initiated after baseline measurement, which may have helped patients maintain cognitive performance over time. Such interpretations require further confirmation, for example by comparing cognitive performance in the ON and OFF states.
Studies of executive functioning in early‐stage PD show seemingly incongruous results: some present increased activation while others present decreased activation in task‐related areas. When paired with performance, however, increased activity appears to be associated with preserved task performance [Gerrits et al., 2015; Trujillo et al., 2015], while decreased activity is present when task performance is already significantly impaired [Ekman et al., 2012; Lewis et al., 2003]. This suggests that hyperactivation is a compensatory mechanism associated with intact behavioural performance, which was not present in our sample of PD patients, even at baseline. Our finding of decreased activation is therefore in line with previous studies in which cognitive deficits are already present. An alternative explanation for decreased task‐related activity is that baseline activity is significantly increased; as increased activity would already be present at baseline, the task would not cause as large of an increase as seen in healthy subjects, resulting in the finding of decreased task‐specific activity [Ko et al., 2013].
Analysis of functional connectivity revealed that while both groups generally showed functional connectivity within the task‐related systems, the control group displayed more connectivity within the fronto‐parietal system when compared to the PD group. This may in part explain the impaired performance seen in PD patients, as the fronto‐parietal system is implicated in successful ToL problem solving [Baker et al., 1996; Newman et al., 2003]. The parietal regions found to be more strongly connected to the DLPFC in controls also overlapped with our bilateral IPC ROIs, providing further support for a disease‐related impairment in the fronto‐parietal system specifically activated by this task. Within‐group effects of the PD patients seem to suggest that functional connectivity of the caudate nucleus is quite pronounced; we suggest caution, however, in interpreting these results as this is only apparent in the within‐group effects (PD task > baseline), and not between‐groups (PD > HC).
Strengths and Limitations
Our study provides valuable insights into the longitudinal effects of disease progression on planning capabilities in PD, and how striatal dopamine may play a role in this process. This finding is, however, based on a smaller subset of our patient group, and should thus be interpreted with caution. An advantage of our study is that all but two of the patients were naïve to dopaminergic medication at the time of the first measurement. Performing a meta‐analysis provided an unbiased, objective approach to localizing our regions of interest, increasing the validity of our results. While Muslimović et al. [2009] previously demonstrated that ToL performance is impaired in early‐stage PD and that cognitive decline over time is stronger in PD compared to controls [Muslimović et al., 2009], we extend these results by contributing the effect of task‐related activity and connectivity, as well as by showing the predictive value of dopamine transporter binding ratios.
As not all participants from the baseline study returned for the follow‐up, a selection bias is possible. This may have led to, for example, only the inclusion of patients with relatively stable, or slow, disease progression. Our study also only employed fMRI at the second time‐point, and DaT‐SPECT at baseline, limiting what can be said about the progression of neural dynamics or dopamine neurotransmitter system integrity across time. As our study did not employ an ON versus OFF design, the effects of dopamine replacement therapy on task‐ related neural activity or performance cannot be fully assessed.
CONCLUSIONS
Goal‐directed behaviour, operationalized using a planning task, is already significantly impaired in the early stages of PD. Similar to other PD‐related cognitive dysfunctions, this impairment in planning is accompanied by decreased activity and functional connectivity in task‐related brain networks. Possibly as a result of dopaminergic treatment, the rate of disease‐related cognitive decline remains similar to the effect of normal aging in control subjects, especially for those with more intact striatal dopamine levels at baseline.
Supporting information
Supporting Information
ACKNOWLEDGMENTS
Financial support for this study was provided by the Neuroscience Campus Amsterdam/Institute for Clinical and Experimental Neuroscience (NCA/ICEN), the Amsterdam Brain Imaging Platform (ABIP), a VIDI grant from the Netherlands Organization for Scientific Research (NWO), grant number 016.095.359 and a grant from the Stichting Parkinson Fund.
REFERENCES
- Aarsland D, Larsen JP, Lim NG, Janvin C, Karlsen K, Tandberg E, Cummings JL (1999): Range of neuropsychiatric disturbances in patients with Parkinson's disease. J Neurol 67:492–496. [DOI] [PMC free article] [PubMed] [Google Scholar]
- Baker SC, Rogers RD, Frith CD, Dolan RJ, Frackowiak RSJ (1996): Neural systems engaged by planning: A PET study of the Tower of London task. Neuropsychologia 34:512–526. [DOI] [PubMed] [Google Scholar]
- Beck AT, Beck RW (1972): Screening depressed patients in family practice: A rapid technique. Postgraduate Med 52:81–85. [DOI] [PubMed] [Google Scholar]
- Beck AT, Epstein N, Brown GK, Steer RA (1988): An inventory for measuring clinical anxiety: Psychometric properties. J Consulting Clin Psychol 56:893–897. [DOI] [PubMed] [Google Scholar]
- Beck AT, Steer RA, Brown G K (1996): Beck depression inventory‐II. San Antonio, TX: Psychological Corporation. [Google Scholar]
- Boghi A, Rasetti R, Avidano F, Manzone C, Orsi L, D'Agata F, Caroppo P, Bergui M, Rocca P, Pulvirenti L, Bradac GB, Bogetto F, Mutani R, Mortara P (2006): The effect of gender on planning: An fMRI study using the Tower of London task. NeuroImage 33:999–1010. [DOI] [PubMed] [Google Scholar]
- Chudasama Y, Robbins TW (2006): Functions of frontostriatal systems in cognition: Comparative neuropsychopharmacological studies in rats, monkeys and humans. Biol Psychol 73:19–38. [DOI] [PubMed] [Google Scholar]
- Cockrell JR, Folstein MF (1988): Mini‐mental State Examination (MMSE). Psychopharmacol Bull 24:689–692. [PubMed] [Google Scholar]
- Cools R (2006): Dopaminergic modulation of cognitive function‐implications for L‐DOPA treatment in Parkinson's disease. Neurosci Biobehav Rev 30:1–23. [DOI] [PubMed] [Google Scholar]
- Cools R (2011): Dopaminergic control of the striatum for high‐level cognition. Curr Opin Neurobiol 21:402–407. [DOI] [PubMed] [Google Scholar]
- Cools R, Barker RA, Sahakian BJ, Robbins TW (2001): Mechanisms of cognitive set flexibility in Parkinson's disease. Brain 124:2503–2512. [DOI] [PubMed] [Google Scholar]
- Cools R, D'Esposito M (2011): Inverted‐U‐Shaped Dopamine actions on human working memory and cognitive control. Biol Psychiatry 69:e113–e125. [DOI] [PMC free article] [PubMed] [Google Scholar]
- Dagher A, Owen AM, Boecker H, Brooks DJ (1999): Mapping the network for planning: A correlational PET activation study with the Tower of London task. Brain 122:1973–1987. [DOI] [PubMed] [Google Scholar]
- Daniel SE, Lees AJ (1992): Parkinson's Disease Society Brain Bank, London: Overview and research. J Neural Transm Suppl 39:165–172. [PubMed] [Google Scholar]
- Diwadkar VA, Carpenter PA, Just MA (2000): Collaborative activity between parietal and dorso‐lateral prefrontal cortex in dynamic spatial working memory revealed by fMRI. NeuroImage 12:85–99. [DOI] [PubMed] [Google Scholar]
- Eggers C, Kahraman D, Fink GR, Schmidt M, Timmerman L (2011): Akinetic‐rigid and tremor‐dominant Parkinson's disease patients show different patterns of FP‐CIT Single photon emission computed tomography. Mov Disord 26:416–423. [DOI] [PubMed] [Google Scholar]
- Eickhoff SB, Bzdok D, Laird AR, Roski C, Caspers S, Zilles K, Fox PT (2011): Co‐activation patterns distinguish cortical modules, their connectivity and functional differentiation. NeuroImage 57:938–949. [DOI] [PMC free article] [PubMed] [Google Scholar]
- Eisenberg DP, Berman KF (2010): Executive function, neural circuitry, and genetic mechanisms in schizophrenia. Neuropsychopharmacology 35:258–277. [DOI] [PMC free article] [PubMed] [Google Scholar]
- Ekman U, Eriksson J, Forsgren L, Mo SJ, Riklund K, Nyberg L (2012): Functional brain activity and presynaptic dopamine uptake in patients with Parkinson's disease and mild cognitive impairment: A cross‐sectional study. Lancet Neurol 11:679–687. [DOI] [PubMed] [Google Scholar]
- Elliott R (2003): Executive functions and their disorders imaging in clinical neuroscience. Br Med Bull 65:49–59. [DOI] [PubMed] [Google Scholar]
- Erixon‐Lindroth N, Farde L, Wahlin TBR, Sovago J, Halldin C, Bäckman L (2005): The role of the striatal dopamine transporter in cognitive aging. Psychiatry Res 138:1–12. [DOI] [PubMed] [Google Scholar]
- Fahn S, Elton RL, Committee UD (1987): Unified Parkinson's disease rating scale. Florham Park, NJ: Macmillan Health Care Information; pp 153–163.[TQ1] [Google Scholar]
- Friston KJ, Buechel C, Fink GR, Morris J, Rolls E, Dolan RJ (1997): Psychophysiological and modulatory interactions in neuroimaging. NeuroImage 6:218–229. [DOI] [PubMed] [Google Scholar]
- Gerrits NJHM, van der Werf YD, Verhoef KMW, Veltman DJ, Groenewegen HJ, Berendse HW, van den Heuvel OA (2015): Compensatory fronto‐parietal hyperactivation during set‐shifting in unmedicated Parkinson patients. Neuropsychologia 68:107–116. [DOI] [PubMed]
- Hoehn MM, Yahr MD (1967): Parkinsonism: Onset, progression, and mortality. Neurology 17:427–442. [DOI] [PubMed] [Google Scholar]
- Jurado MB, Rosselli M (2007): The elusive nature of executive functions: A review of our current understanding. Neuropsychol Rev 17:213–233. [DOI] [PubMed] [Google Scholar]
- Kaasinen V, Rinne JO (2002): Functional imaging studies of dopamine system and cognition in normal aging and Parkinson's disease. Neurosci Biobehav Rev 26:785–793. [DOI] [PubMed] [Google Scholar]
- Kehagia AA, Barker RA, Robbins TW (2010): Neuropsychological and clinical heterogeneity of cognitive impairment and dementia in patients with Parkinson's disease. Lancet Neurol 9:1200–1213. [DOI] [PubMed] [Google Scholar]
- Ko JH, Mure H, Tang CC, Ma Y, Dhawan V, Spetsieris P, Eidelberg D (2013): Parkinson's disease: Increased motor network activity in the absence of movement. J Neurosci 33:4540–4549. [DOI] [PMC free article] [PubMed] [Google Scholar]
- Kroener S, Chandler LJ, Phillips PEM, Seamans JK (2009): Dopamine modulates persistent synaptic activity and enhances the signal‐to‐noise ratio in the prefrontal cortex. PLoS One 4:e6507 [DOI] [PMC free article] [PubMed] [Google Scholar]
- Kudlicka A, Clare L, Hindle JV (2011): Executive functions in Parkinson's disease: Systematic review and meta‐analysis. Mov Disord 26:2305–2315. [DOI] [PubMed] [Google Scholar]
- Lewis SJG, Dove A, Robbins TW, Barker RA, Owen AM (2003): Cognitive impairments in early Parkinson's disease are accompanied by reductions in activity in frontostriatal neural circuitry. J Neurosci 23:6351–6356. [DOI] [PMC free article] [PubMed] [Google Scholar]
- Maldjian JA, Laurienti PJ, Kraft RA, Burdette JH (2003): An automated method for neuroanatomic and cytoarchitectonic atlas‐based interrogation of fMRI data sets. NeuroImage 19:1233–1239. [DOI] [PubMed] [Google Scholar]
- Mattay VS, Tessitore A, Callicott JH, Bertolino A, Goldberg TE, Chase TN, Hyde TM, Weinberger DR (2002): Dopaminergic modulation of cortical function in patients with Parkinson's disease. Ann Neurol 51:156–164. [DOI] [PubMed] [Google Scholar]
- McLaren DG, Ries ML, Xu G, Johnson SC (2012): A generalized form of context‐dependent psychophysiological interactions (gPPI): A comparison to standard approaches. NeuroImage 61:1277–1286. [DOI] [PMC free article] [PubMed] [Google Scholar]
- Monchi O, Petrides M, Mejia‐Constain B, Strafella AP (2007): Cortical activity in Parkinson's disease during executive processing depends on striatal involvement. Brain 130:233–244. [DOI] [PMC free article] [PubMed] [Google Scholar]
- Muslimović D, Post B, Speelman JD, de Haan RJ, Schmand B (2009): Cognitive decline in Parkinson's disease: A prospective longitudinal study. J Int Neuropsychol Soc 15:426–437. [DOI] [PubMed] [Google Scholar]
- Muslimović D, Post B, Speelman JD, Schmand B (2005): Cognitive profile of patients with newly diagnosed Parkinson's disease. Neurology 65:1239–1245. [DOI] [PubMed] [Google Scholar]
- Newman SD, Carpenter PA, Varma S, Just MA (2003): Frontal and parietal participation in problem solving in the Tower of London: fMRI and computational modeling of planning and high‐level perception. Neuropsychologia 41:1668–1682. [DOI] [PubMed] [Google Scholar]
- O'Reilly JX, Woolrich MW, Behrens TEJ, Smith SM, Johansen‐Berg H (2012): Tools of the trade: Psychophysiological interactions and functional connectivity. Soc Cogn Affect Neurosci 7:604–609. [DOI] [PMC free article] [PubMed] [Google Scholar]
- Olde Dubbelink KTE, Hillebrand A, Stoffers D, Deijen JB, Twisk JWR, Stam CJ, Berendse HW (2014): Disrupted brain network topology in Parkinson's disease: A longitudinal magnetoencephalography study. Brain 137:197–207. [DOI] [PubMed] [Google Scholar]
- Olde Dubbelink KTE, Stoffers D, Deijen JB, Twisk JWR, Stam CJ, Berendse HW (2013): Cognitive decline in Parkinson's disease is associated with slowing of resting‐state brain activity: A longitudinal study. Neurobiol Aging 34:408–418. [DOI] [PubMed] [Google Scholar]
- Owen AM (2004): Cognitive dysfunction in Parkinson's disease: The role of frontostriatal circuitry. Neuroscientist 10:525–537. [DOI] [PubMed] [Google Scholar]
- Owen AM, Doyon J, Dagher A, Sadikot A, Evans AC (1998): Abnormal basal ganglia outflow in Parkinson's disease identified with PET: Implications for higher cortical functions. Brain 121:949–965. [DOI] [PubMed] [Google Scholar]
- Owen AM, James M, Leigh PN, Summers BA, Marsden CD, Quinn NP, Lange KW, Robbins TW (1992): Fronto‐striatal cognitive deficits at different stages of Parkinson's disease. Brain 115:1727–1751. [DOI] [PubMed] [Google Scholar]
- Owen AM, Sahakian BJ, Hodges JR, Summers BA, Polkey CE, Robbins TW (1995): Dopamine‐dependent frontostriatal planning deficits in early Parkinson's disease. Neuropsychology 9:126–140. [Google Scholar]
- Shallice T (1982): Specific impairments of planning. Philos Trans R Soc Lond B Biol Sci 289:199–209. [DOI] [PubMed] [Google Scholar]
- Spitzer RL, Williams JBW, Gibbon M, First MB (1992): The Structured Clinical Interview for DSM‐III‐R (SCID) I: History, rationale, and description. Arch Gen Psychiatry 49:624–629. [DOI] [PubMed] [Google Scholar]
- Stoffers D, Bosboom JLW, Deijen JB, Wolters EC, Stam CJ, Berendse HW (2008): Increased cortico‐cortical functional connectivity in early‐stage Parkinson's disease: An MEG study. NeuroImage 41:212–222. [DOI] [PubMed] [Google Scholar]
- Trujillo JP, Gerrits NJHM, Veltman DJ, Berendse HW, van der Werf YD, van den Heuvel OA (2015): Reduced neural connectivity but increased task‐related activity during working memory in de novo Parkinson patients. Hum Brain Mapp 36:1554–1566. [DOI] [PMC free article] [PubMed]
- Tziortzi A, Searle G, Tzimopoulou S, Salinas C, Beaver J, Jenkinson M, Larulle M, Rabiner E, Gunn R (2013): Imaging dopamine receptors in humans with [11C]‐(+)‐PHNO: Dissection of D3 signal and anatomy. NeuroImage 54:264–277. [DOI] [PubMed] [Google Scholar]
- van den Heuvel OA, Groenewegen HJ, Barkhof F, Lazeron RHC, van Dyck R, Veltman DJ (2003): Frontostriatal system in planning complexity: A parametric functional magnetic resonance version of tower of london task. NeuroImage 18:367–374. [DOI] [PubMed] [Google Scholar]
- van den Heuvel OA, Mataix‐Cols D, Zwitser G, Cath DC, van der Werf YD, Groenewegen HJ, van Balkom AJ, Veltman DJ (2011): Common limbic and frontal‐striatal disturbances in patients with obsessive compulsive disorder, panic disorder and hypochondriasis. Psychol Med 41:2399–2410. [DOI] [PubMed] [Google Scholar]
- van den Heuvel OA, Veltman DJ, Groenewegen HJ, Cath DC, van Balkom AJLM, van Hartskamp J, Barkhof F, van Dyck R (2005): Fronto‐striatal dysfunction during planning in obsessive‐compulsive disorder. Arch Gen Psychiatry 62:301–309. [DOI] [PubMed] [Google Scholar]
- Voorn P, Vanderschuren LJMJ, Groenewegen HJ, Robbins TW, Pennartz CMA (2004): Putting a spin on the dorsal‐ventral divide of the striatum. Trends Neurosci 27:468–474. [DOI] [PubMed] [Google Scholar]
- Vriend C, Gerrits NJHM, Berendse HW, Veltman DJ, van den Heuvel OA, van der Werf YD (2015): Failure of stop and go in de novo Parkinson's disease—A functional magnetic resonance imaging study. Neurobiol Aging 36:470–475. [DOI] [PubMed] [Google Scholar]
- Vriend C, Nordbeck A, Booij J, van der Werf YD, Pattij T, voorn P, Raijmakers P, Foncke EMJ, van de Giessen E, Berendse HW, van den Heuvel OA (2014): Reduced dopamine transporter binding predates impulse control disorders in Parkinson's disease. Mov Disord 29:904–911. [DOI] [PubMed] [Google Scholar]
- Williams‐Gray CH, Hampshire A, Robbins TW, Owen AM, Barker RA (2007): Catechol O‐Methyltransferase val158met genotype influences frontoparietal activity during planning in patients with Parkinson's disease. J Neurosci 27:4832–4838. [DOI] [PMC free article] [PubMed] [Google Scholar]
Associated Data
This section collects any data citations, data availability statements, or supplementary materials included in this article.
Supplementary Materials
Supporting Information