Abstract
Purpose
The purpose of this study was to assess the accuracy of susceptibility-weighted imaging (SWI), compared with T2*-weighted gradient echo (GRE) imaging in assessing cerebral cavernous malformations.
Materials and methods
We retrospectively evaluated 21 patients with a familial form of cavernous malformation. Magnetic resonance (MR) protocol included non-enhanced and contrast-enhanced fast-spin echo (FSE) T1-weighted sequences, FSE T2-weighted sequences, fluid-attenuated inversion-recovery (FLAIR), GRE T2*-weighted and SWI sequences. Images were reviewed in consensus by two expert neuroradiologists to assess the location, number, size and conspicuity of the lesions on T2*-weighted GRE and SWI sequences. Statistical differences in the number, size and conspicuity of the lesions seen on the SWI images and the T2*-weighted GRE images were assessed with the nonparametric Wilcoxon signed rank test.
Results
The number of cavernous malformations was significantly higher (p < .001) on the SWI images (n = 152) than on T2*-weighted GRE images (n = 56). Lesion size was significantly higher (p < .001) on SWI images (mean: 0.4 cm, SD ± 0.55) than on T2*-weighted GRE sequences (mean: 0.2 cm, SD ± 0.51) and the differences were statistically significant (p < .001). Lesion conspicuity was significant higher (p < .001) on SWI than on T2*-weighted GRE images. In one patient who underwent a 2-month follow-up for the onset of neurologic symptoms related to cerebral hemorrhage, a cerebral hematoma was identified at the site of a cerebral cavernous malformation that was demonstrated only on the SWI images in the previous MR examination.
Conclusions
The SWI sequence, being more sensitive to substances which distort the local magnetic field than the GRE T2*W sequence, showed a higher sensitivity in identifying cerebral cavernous malformations. Thus, routine clinical neuroimaging protocol should contain SWI sequences to evaluate patients with (or suspected) cerebral cavernous malformations.
Keywords: Cerebral cavernous malformation, diagnosis, imaging, susceptibility-weighted imaging, T2*-weighted gradient echo sequence
Introduction
Cerebral cavernous malformations (CCM), also called cavernous hemangiomas, comprise 10–15% of all central nervous system vascular lesions.1 Histologically, they are composed of dilated vascular spaces with a single layer of endothelium with surrounding hemosiderin, without muscular tissue or intervening cerebral parenchyma.2–4 Cerebral cavernous malformations can be completely asymptomatic or cause headaches, seizures, hemorrhages and focal neurological deficits.5–9 In these patients, the risk of hemorrhage and seizure precipitation has been estimated, respectively, at 3.1% and 2.4%.10 The cerebral cavernous malformations consist of a sporadic form, in which patients usually have a single lesion; or a familial form, characterized by multiple lesions and autosomal dominant transmission.11,12 The familial form accounts for 10–30% of all cases; and in this condition, the probability that new lesions develop during a normal lifetime makes necessary to have imaging surveillance of the family members, with the best imaging techniques available.5–7,9,13,14
Magnetic resonance (MR) imaging is the best imaging technique of choice to evaluate cerebral cavernous malformation.9 Usually on T2-weighted sequences, the cavernous malformations have a characteristic appearance, which includes a central reticulated core and a peripheral rim of decreased signal intensity, due to hemosiderin deposition.8,9,15,16 T2*-weighted gradient echo (GRE) imaging has been established as the gold standard sequence in the evaluation of cerebral cavernous malformations.8,15
Susceptibility-weighted imaging (SWI) is a relatively novel high-spatial resolution, three-dimensional, GRE MR sequence that exploits the magnetic susceptibility differences of various tissues or substances such as blood products, iron content and calcification.17,18 The image contrast in GRE is dependent on T2* relaxation, which refers to the variation of transverse magnetization caused by a combination of spin-spin relaxation and magnetic field inhomogeneity.
SWI sequence allows an additional type of image contrast generated by exploiting the phase information of GRE images. Depending on the TE, substances with different magnetic susceptibilities come out of phase with their surrounding tissue; thus, SWI phase images can contain valuable information about local susceptibility changes among neighboring tissues.17,18 While SWI has been reported to be useful in the evaluation of hemorrhage, arterial venous malformations, small vessel diseases, amyloid angiopathy, cavernous malformations, multiple sclerosis, trauma, tumors and hemosiderosis,19,20 it has not been fully implemented in routine clinical MR protocol, due to the longer acquisition time (between 5–10 minutes).21
To the best of our knowledge, only a few studies reported that SWI is more sensitive than T2*-weighted GRE sequences for evaluation of CCM lesions.7,13,16,22 The aims of this study were to investigate the imaging features of CCM lesions, according to the classification of Zabramsky et al.8 and the modification of Bulut et al.22 for lesions seen only on SWI sequences; and to assess the accuracy of SWI sequences, compared with T2*-weighted GRE sequences, in the detection of CCM lesions in patients with the familial form of the disease.
We hypothesized that the SWI sequence, being more sensitive to compounds which distort the local magnetic field than the GRE T2* sequence, could depict cerebral cavernous malformations not demonstrable on T2*-weighted GRE imaging, and that this helpful information could be of crucial importance in managing the treatment of the familial form of the disease, preventing cerebral hemorrhage and complications.
Materials and methods
The institutional review board of our institution approved this retrospective study. We obtained written informed consent from all patients referenced with the diagnosis of the familial form of CCM.
There were a total of 21 patients (9 men and 12 women; age: 32–77 years; mean age: 53.7 years) who underwent MR examination between February 2015 and March 2016. All MR examinations were performed on a 1.5T MR scanner (Achieva, Philips Medical Systems, Best, The Netherlands).
The MR imaging protocol included axial and sagittal fast-spin echo (FSE) T2W (5100/110 (TR/TE)) images and axial fluid-attenuated inversion-recovery (FLAIR) (8000/140/2400 (TR/TE/TI)) images; along with axial, sagittal and coronal non-enhanced and contrast-enhanced (0.1 mmol/Kg gadobutrol (Gadovist, Bayer, Germany) FSE T1W (650/15 (TR/TE)) images with a field of view (FOV) of 22 cm, matrix of 512 x 512, slice thickness of 5 mm, intersection gap of 1 mm and number of excitations: 2.
In addition, axial T2*W GRE (591/18 (TR/TE), flip angle 18°) images were obtained with a FOV of 22 cm, matrix of 256 x 256, slice thickness of 3 mm, gap of 0 mm, two excitations and acquisition time: 3.49 min.
The SWI images were obtained using a technique that combines a long-TE high-resolution fully flow-compensated three-dimensional (3D) GRE sequence with filtered phase information in each voxel to both enhance the contrast in magnitude images and add the susceptibility differences between tissues as a new source of information.16,19,23–25 The SWI images (3D GRE 24/34 (TR/TE), flip angle 10°) were obtained with a FOV of 22 cm, matrix 256 x 512, slice thickness of 1.2 mm, gap of 0 mm, one as the number of excitations and acquisition time of 5.15 min. Subsequently, the SWI sequences were reconstructed to obtain images with section number, thickness and position similar to those of the T2-weighted FSE and GRE sequences.
Calcifications of the pineal gland, choroid plexus, basal ganglia, deep cerebellar nuclei and dura mater; also referred to as non-pathologic calcifications,26 were considered as normal findings if present, and not taken into account during the review and scoring process of the CCM lesions on the T2*W GRE and SWI images. Of note: No patients had disorders of calcium/phosphate metabolism.
The images obtained were independently analyzed by consensus of two neuroradiologists, each with at least 10 years' experience. Images were analyzed with regards to the location, number, size and conspicuity of the lesions seen on each sequence, in a blinded fashion.
The equivalent axial sections of SWI and T2*W GRE were independently compared by the two neuroradiologists, on a PACS system (Agfa HealthCare GmbH, Bonn, Germany).
The neuroradiologists recorded the location, number and size of lesions for each sequence; and scored conspicuity of the lesions for both T2*W GRE and corresponding SWI, by using the following 5-point scale:
1: Lesion was visible on T2*W GRE, but not visible on SWI;
2: Lesion was equally visible on T2*W GRE and SWI;
3: Lesion was visible slightly better on SWI than on T2*W GRE;
4: Lesion was seen clearly better on SWI than on T2*W GRE; and
5: Lesion was seen on SWI, but it was non-detectable on T2*W GRE.
All the CCM lesions were classified according to the Zabramski et al.8 classification.
The Type I lesions are defined as having a hyper-intense core on T1-weighted images, and hyper- or hypo-intense on T2-weighted FSE sequences. Type II lesions are seen as reticulated, mixed-signal intensity cores on T1- and T2-weighted FSE sequences; with a hypo-intense rim on T2-weighted FSE images. Type III exhibits iso- or hypo-intense signal intensity on T1-weighted FSE images and hypo-intense signal intensity with a hypo-intense ring magnified on T2-weighted FSE sequences. Finally, the Type IV lesions present as punctate hypointense lesions on T2*-weighted GRE images. The lesions seen only on SWI were considered independently of the classification of Zabramski et al.,8 according to the modification described by Bulut et al.22 and defined as Type V lesions (Table 1).
Table 1.
Number of lesions subdivided by Zabramski et al.8 classification, modified according to Bulut et al.22
| Type of lesion | Number of lesions (n) |
|---|---|
| Type I | 1 |
| Type II | 13 |
| Type III | 4 |
| Type IV | 38 |
| Type V | 96 |
In the case of potential lesion on SWI not detected by T2*W GRE, additional MR imaging sequences (T1W, T2W, FLAIR and contrast-enhanced images) were used to exclude potential artifacts and to further define the ‘new’ CCM lesion, with the understanding that without a histologic correlate, the lesion type may not be confirmed.
The final decisions regarding scoring and classification of the lesions were reached by consensus.
Differences in the number, size and conspicuity of the lesions seen on SWI images and T2*W GRE images were assessed with the nonparametric Wilcoxon signed rank test against a value of zero (no differences).
A correlations analysis using the Spearman rank correlation coefficient and the linear regression analysis was performed between the numbers of lesions on both T2*-weighted GRE and SWI sequences, with the age of the patients. Statistical analysis was performed using the statistical software package SPSS (SPSS, Chicago, IL, USA). Differences for a p value of < .01 were considered as statistically significant.
Results
On T2*W GRE images, a total of 56 CCMs (each patient ranging from 1 to 17) were identified; while on the SWI images, a total of 152 lesions (each patient ranging from 2 to 71) were identified (Table 2). The mean size of CCM was 0.2 cm (SD ± 0.55) on the T2*W GRE images and 0.4 cm (SD ± 0.51) on the SWI images.
Table 2.
Location and number of cerebral cavernous malformations on T2*W GRE images and on SWI images.
| Location | Lesions seen on SWI images (n) | Lesions seen on T2*W GRE images (n) |
|---|---|---|
| Cerebrum | 114 | 36 |
| Cerebellum | 20 | 10 |
| Brain stem | 18 | 10 |
| Total | 152 | 56 |
GRE: gradient echo imaging; SWI: susceptibility-weighted imaging
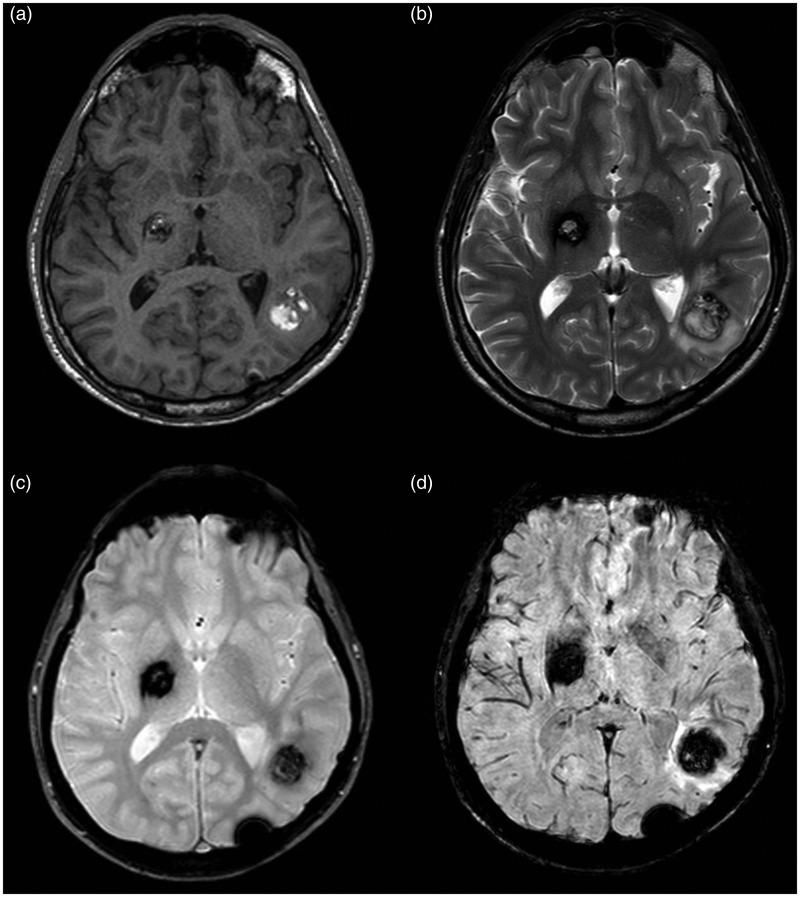
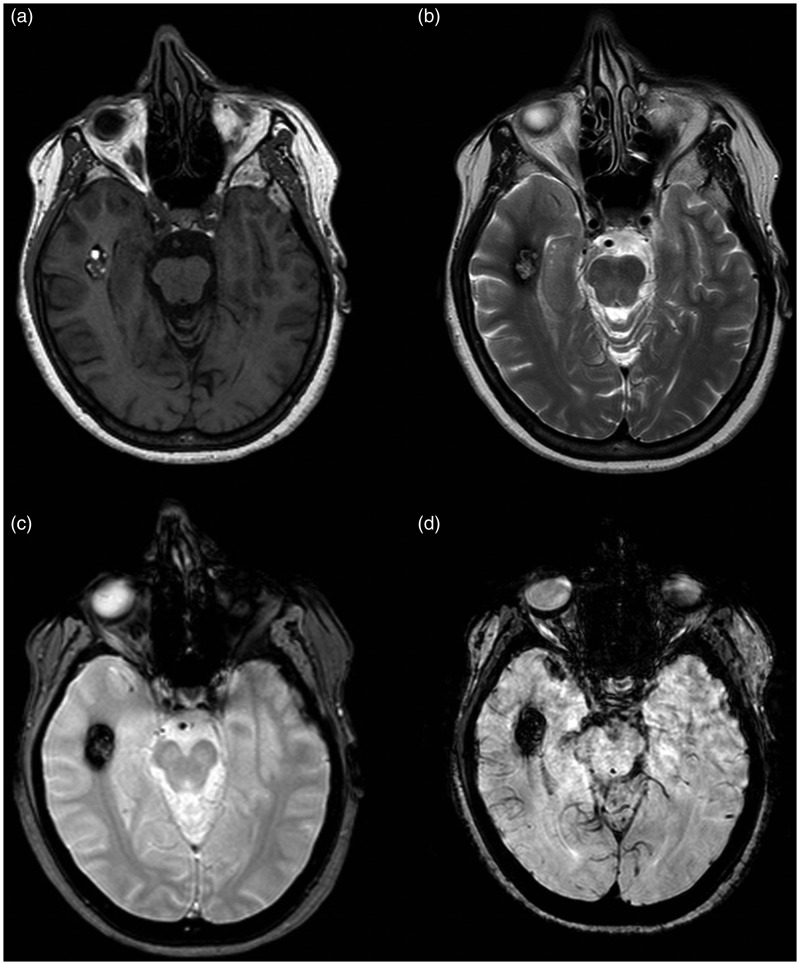
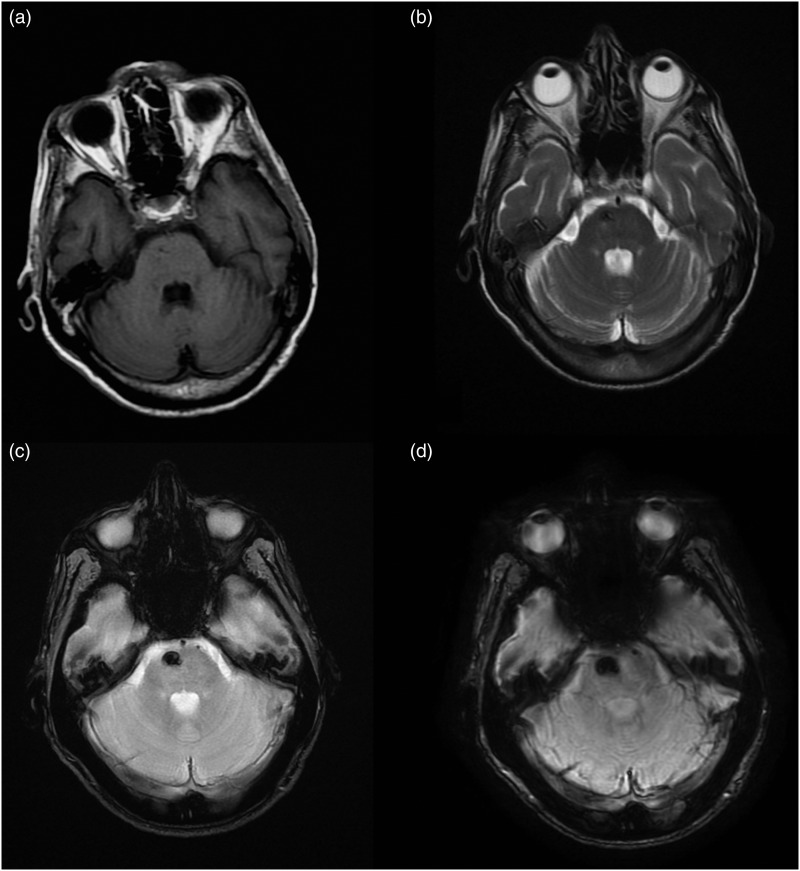
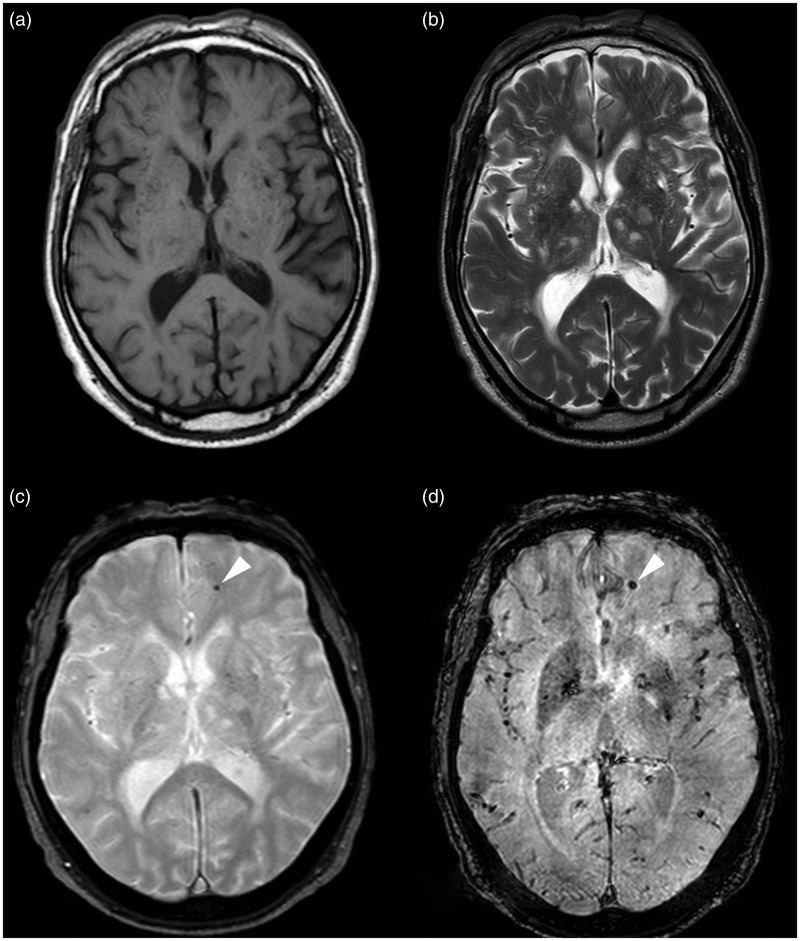
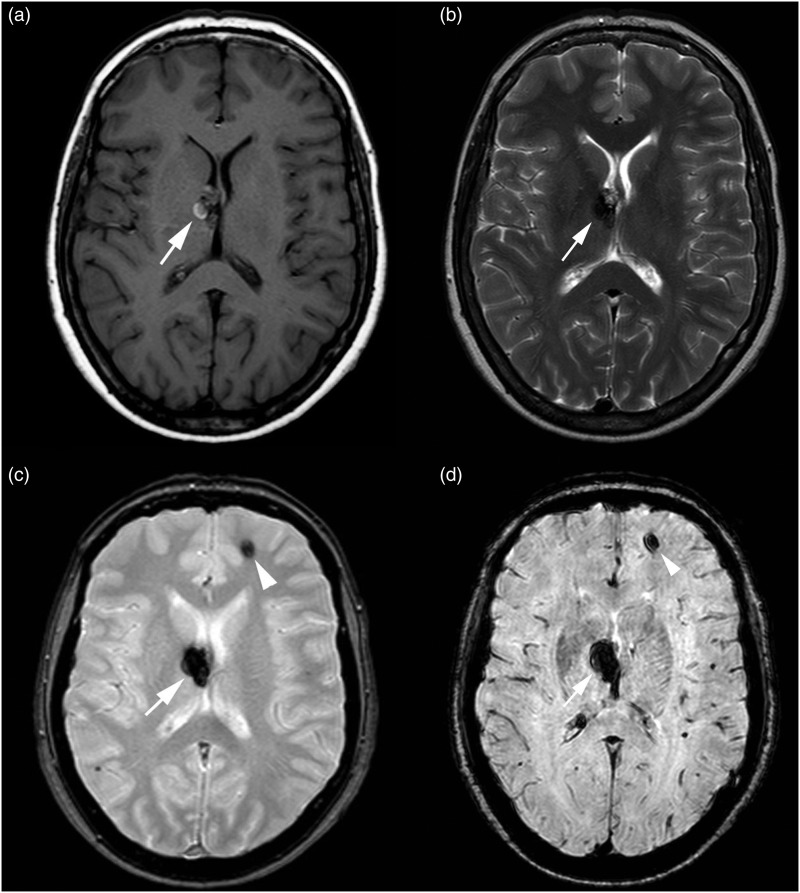
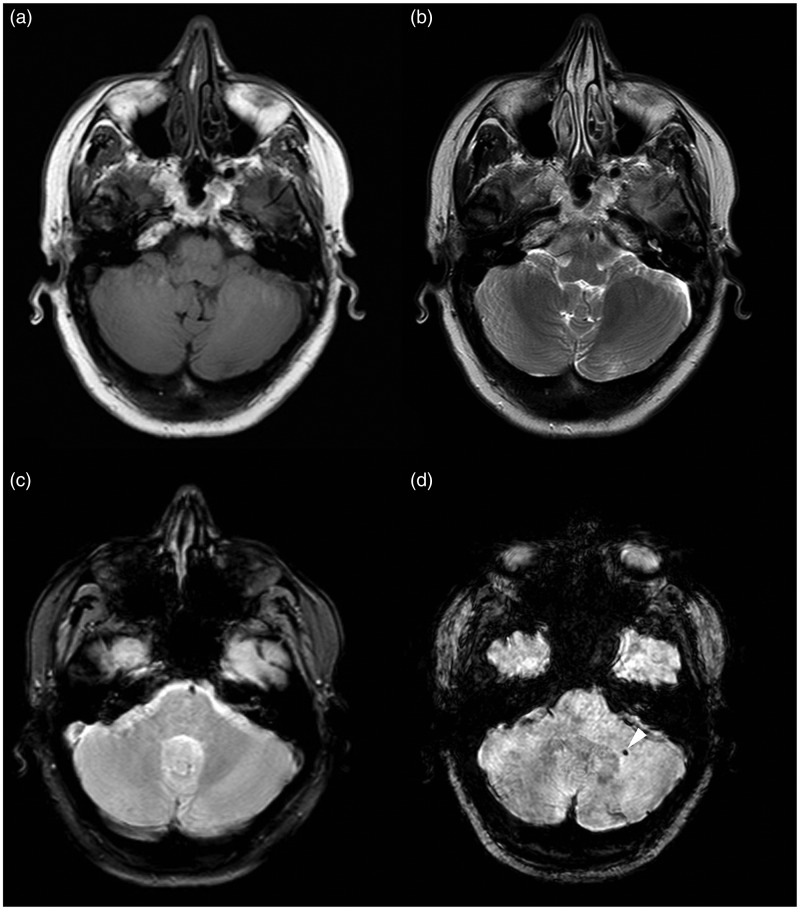
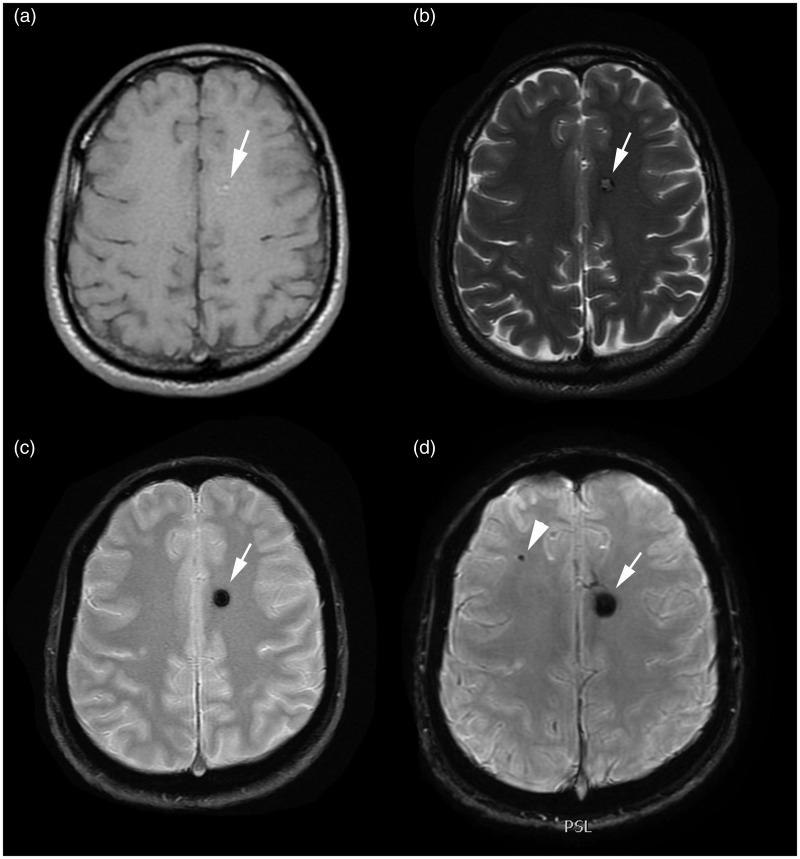
We saw 56 lesions (Type I to IV) on both SWI and T2*W GRE images (Figures 1–5); while we saw 96 CCM lesions only on SWI images, thus defined as Type V lesions (Figures 6–7) according to the Zabramski et al.8 classification modified by Bulut et al.22
Figure 1.
MR images of Type I lesions. (a) On a T1-weighted sequence, the lesions presented a hyper-intense core. (b) On a T2-weighted sequence, the core of the lesions showed a mixed signal, mainly hyper-intense. The lesions are seen in both (c) T2*-weighted GRE and (d) SWI sequences; but larger and with a more robust conspicuity on a SWI image than on a T2*-weighted GRE image.
GRE: gradient echo images; MR: magnetic resonance; SWI: susceptibility-weighted imaging
Figure 2.
MR images of Type II lesion. (a) On T1-weighted sequence, the lesion presents a core with reticulated mixed signal intensity. (b) On T2-weighted sequence, the core of the lesion is a core with reticulated mixed-signal intensity, with a peripheral hypo-intense rim. The lesion is seen in both (c) T2*-weighted GRE and (d) SWI sequence showing a larger size and a more robust conspicuity on the SWI image than on the T2*-weighted GRE image.
GRE: gradient echo images; MR: magnetic resonance; SWI: susceptibility-weighted imaging
Figure 3.
MR images of Type III lesion. (a) On a T1-weighted sequence, the lesion presented a signal iso-hypo-intense. (b) On a T2-weighted sequence, the core of the lesion was a core with mixed signal intensity, mainly hypo-intense, with a peripheral hypo-intense core. The lesion is seen in both (c) T2*-weighted GRE and (d) SWI sequences, showing a larger size and a more robust conspicuity on the SWI image than on the T2*-weighted GRE image.
GRE: gradient echo images; MR: magnetic resonance; SWI: susceptibility-weighted imaging
Figure 4.
MR images of Type IV lesion. The Type IV lesion (arrowhead) is not seen on (a) T1-weighted and (b) FSE T2-weighted images; while it is seen only on the (c) T2*-weighted GRE and (d) SWI images as a hypo-intense punctate area.
FSE: fast-spin echo; GRE: gradient echo images; MR: magnetic resonance; SWI: susceptibility-weighted imaging
Figure 5.
MR images of Type I and Type IV lesions. The Type I lesion (arrow) is seen on (a) T1-weighted, (b) FSE T2-weighted, (c) T2*-weighted GRE and (d) SWI images. The Type IV lesion (arrowhead) is seen only on (c) T2*-weighted GRE sequence and (d) SWI sequence as an hypo-intense area.
FSE: fast-spin echo; GRE: gradient echo images; MR: magnetic resonance; SWI: susceptibility-weighted imaging
Figure 6.
MR images of Type V lesion in the left cerebellar hemisphere. The lesion is not seen on (a) T1-weighted, (b) FSE T2-weighted and (c) T2*-weighted GRE sequences; while it is seen only on (d) SWI sequence like a hypo-intense punctate area (arrowhead).
FSE: fast-spin echo; GRE: gradient echo images; MR: magnetic resonance; SWI: susceptibility-weighted imaging
Figure 7.
MR images of Type I and Type V lesions. The Type I lesion (arrow) is seen on (a) T1-weighted, (b) FSE T2-weighted, (c) T2*-weighted GRE and (d) SWI images. The Type V lesion is seen only on the (d) SWI image as a hypo-intense, punctate area (arrowhead).
FSE: fast-spin echo; GRE: gradient echo images; MR: magnetic resonance; SWI: susceptibility-weighted imaging
The differences in the number of cavernous malformations identified on SWI images, compared to those in T2*W GRE images, were statistically significantly (p < .001). Differences in the size of cavernous malformations identified on SWI images, as compared to those of T2*W GRE images, were statistically significant (p < .001). In all patients, the SWI was scored as superior to the corresponding T2*W GRE images, with regard to conspicuity of the T2* CCM lesions (p < .001).
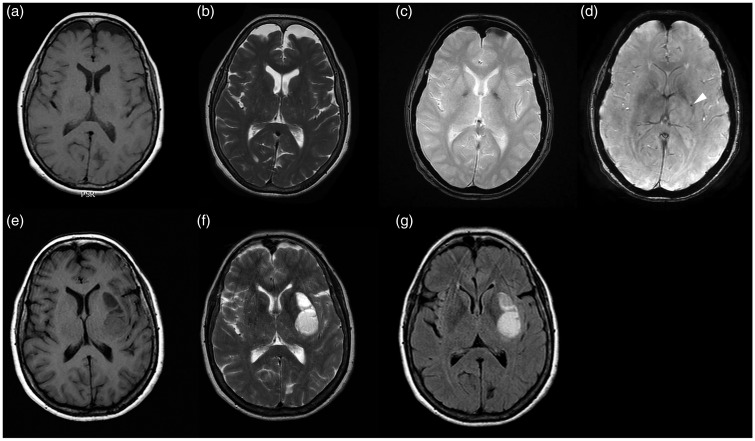
In one patient, who underwent 2 months follow-up for the onset of neurologic symptoms related to cerebral hemorrhage, a cerebral hematoma was identified at the site of a CCM, which was demonstrated only on the SWI images from the previous MR examination (Figure 8).
Figure 8.
MR images of Type V lesion. The lesion is not seen on (a) T1-weighted, (b) FSE T2-weighted, (c) T2*-weighted GRE sequence; while it is seen only on (d) SWI sequences as a hypo-intense punctate area (arrowhead). After 2 months follow-up, the (e) T1-weighted, (f) FSE T2-weighted and (g) FLAIR MR images showed a cerebral hematoma in the site of the lesion previously seen only on the SWI sequence.
FSE: fast-spin echo; FLAIR: fluid-attenuated inversion-recovery; GRE: gradient echo images; MR: magnetic resonance; SWI: susceptibility-weighted imaging
Correlation analysis showed that there was a significant correlation between the age of the patients and the number of lesions, for both the T2*W GRE (r = 0.83, p < 0.001) and SWI (r = 0.86, p < 0.001) sequences. Indeed, older patients had more lesions because new lesions develop during their life.
Discussion
We found that SWI MR imaging is better at detecting brain cavernous malformation in the familiar form of the disease, compared to conventional FSE T2W and T2W GRE MR sequences. This result has a practical implications, as it is of a crucial importance to add the SWI sequences to the routine clinical neuroimaging protocols for the evaluation of patients with, or suspected of having, the familiar form of CCMs and for the screening of family members.
In line with previous studies,9,16,22 our results confirmed that there is a significant correlation between the age of the patients and the number of lesions for both T2*W GRE and SWI sequences, which means that older patients have more lesions because new lesions develop during their life. Brunereau et al.,9 studying a group of 40 patients with the familial form of the disease during an interval of 3.2 years, detected bleeding of lesions in 35% of the patients, de novo lesions in 27.5%, signal-intensity changes in 27.5% and size changes in 22.5% of the patients.
The MR imaging features of CCMs are variable, related to blood stagnation phenomena and chronic microhemorrhages, with the consequent presence of products that generate susceptibility effects (deoxyhemoglobin, hemosiderin and calcifications).8,16,22
Zabramski et al.8 introduced a classification system for CCMs, ranging from Type I to Type IV, based on MR imaging findings on conventional spin-echo and GRE sequences. Type I consists in a lesion with subacute hemorrhage and it is characterized by a hyper-intense core on T1 and hyper- or hypo-intense core on T2-weighted sequences. Type II represents lesions with hemorrhages and thrombosis of varying ages, and it is characterized by a core with reticulated mixed signal intensity on T1- and T2-weighted sequences, with a peripheral hypointense rim on T2-weighted sequences. Type III are lesions with chronic resolved hemorrhage and hemosiderin within and around the lesions, iso- or hypo-intense on T1- and T2-weighted sequences and with a rim that is hypo-intense upon T2-weighted imaging. Type IV lesions represent telangiectasia or CCM in an early stage and they are characterized by a punctate hypo-intensity area on T2*-weighted gradient-echo sequences.8,9,22,23
In line with a few previous studies, in our study the Zabramski classification8 also resulted insufficient for categorizing all the lesions.16,22 In our experience, there are an important number of CCMs that are detected only in a SWI sequence; and relying on the Bulut et al.22 study, we have used Type V to refer to this kind of lesions.16,22
The results of our study showed a statistically significant difference between SWI and the T2*-weighted GRE sequences, in terms of more conspicuity and a larger size of CCM lesions on the SWI images than on T2*-weighted GRE sequences, which in turns reflected the significant higher sensitivity of SWI sequences in the detection of small CCMs, allowing the identification of malformations that didn't appear in GRE T2*-weighted images (Figures 6 and 7).
One explanation of this superior sensitivity of the SWI sequence may rely on the fact that the SWI is a volumetric sequence with much fewer artifacts related to the bone-brain interface, and that the bloom effect which is marked on T2*-weighted GRE sequences and is less evident on SWI may obscure the small CCM lesions, as proposed by De Souza et al.16
Moreover, in our series, we reported a patient who underwent 2 months follow-up for the onset of neurologic symptoms related to cerebral hemorrhage and in whom was identified a cerebral hematoma at the site of a CCM, demonstrated only on the SWI images in the previous MR examination (Figure 8). To the best of our knowledge, this is the first case of a CCM lesion seen only on SWI images developing a cerebral hemorrhage at the site of the lesion seen at a follow-up MR examination. This finding has a practical implication, as it further demonstrates that adding the SWI sequences to the routine clinical neuroimaging protocols for the evaluation and follow-up of patients with the familiar form of CCMs and for the screening of family members, enables an earlier diagnosis and improves the therapeutic approach.
Limitations of the study
CCMs in the familial form are not a common disease, so the number of patients included in our study was limited. All the focal hypo-intensity seen on T2*-weighted GRE and SWI were considered CCMs without histological data; and although we tried to exclude other neurological diseases with an accurate clinical history of the patients, some of them could be the result of bleeding from other etiologies or calcifications.7,16,22 Nevertheless, the number of lesions was assigned subjectively.
Conclusions
SWI sequence has allowed us to identify small malformations that didn't appear in GRE T2*W images, showing a significantly higher sensitivity in identifying CCMs than the GRE T2*W sequence. Our study suggested that routine clinical neuroimaging protocols should include SWI sequences for the evaluation of patients with or suspected of having the familiar form of CCMs, and for the screening of family members, in order to improve diagnosis and guide therapeutic strategy.
Funding
This research received no specific grant from any funding agency in the public, commercial, or not-for-profit sectors.
Conflict of interest
The author(s) declared no potential conflicts of interest with respect to the research, authorship, and/or publication of this article.
References
- 1.Barrow DL. Classification and natural history of cerebral vascular malformations: arteriovenous, cavernous and venous. J Stroke Cerebrovasc Dis 1997; 6: 264–267. [DOI] [PubMed] [Google Scholar]
- 2.Kim DS, Park YG, Choi JU, et al. An analysis of the natural history of cavernous malformations. Surg Neurol 1997; 48: 9–17. [DOI] [PubMed] [Google Scholar]
- 3.Labauge P, Brunereau L, Levy C, et al. The natural history of familial cerebral cavernomas: A retrospective MRI study of 40 patients. Neuroradiology 2000; 42: 327–332. [DOI] [PubMed] [Google Scholar]
- 4.Jain R, Robertson PL, Gandhi D, et al. Radiation-induced cavernomas of the brain. Am J Neuroradiol 2005; 26: 1158–1162. [PMC free article] [PubMed] [Google Scholar]
- 5.Rigamonti D, Hadley MN, Drayer BP, et al. Cerebral cavernous malformations. Incidence and familial occurrence. N Engl J Med 1988; 319: 343–347. [DOI] [PubMed] [Google Scholar]
- 6.Moriarity JL, Wetzel M, Clatterbuck RE, et al. The natural history of cavernous malformations: A prospective study of 68 patients. Neurosurgery 1999; 44: 1166–1171. [PubMed] [Google Scholar]
- 7.De Champfleur NM, Langlois C, Ankenbrandt WJ, et al. Magnetic resonance imaging evaluation of cerebral cavernous malformations with susceptibility-weighted imaging. Neurosurgery 2011; 68: 641–647. [DOI] [PubMed] [Google Scholar]
- 8.Zabramski JM, Wascher TM, Spetzler RF, et al. The natural history of familial cavernous malformations: Results of an ongoing study. J Neurosurg 1994; 80: 422–432. [DOI] [PubMed] [Google Scholar]
- 9.Brunereau L, Labauge P, Tournier-Lasserve E, et al. Familial form of intracranial cavernous angioma: MR imaging findings in 51 families. Radiology 2000; 214: 209–216. [DOI] [PubMed] [Google Scholar]
- 10.Kwon CS, Sheth SA, Walcott BP, et al. Long-term seizure outcomes following resection of supratentorial cavernous malformations. Clin Neurol Neurosurg 2013; 115: 2377–2381. [DOI] [PubMed] [Google Scholar]
- 11.Denier C, Goutagny S, Labauge P, et al. Mutations within the MGC4607 gene cause cerebral cavernous malformations. Am J Hum Genet 2004; 74: 326–337. [DOI] [PMC free article] [PubMed] [Google Scholar]
- 12.Bergametti F, Denier C, Labauge P, et al. Mutations within the programmed cell death 10 gene cause cerebral cavernous malformations. Am J Hum Genet 2005; 76: 42–51. [DOI] [PMC free article] [PubMed] [Google Scholar]
- 13.Campbell PG, Jabbour P, Yadla S, et al. Emerging clinical imaging techniques for cerebral cavernous malformations: A systematic review. Neurosurg Focus 2010; 29: E6, doi: 10.3171/2010.5.FOCUS10120. [DOI] [PMC free article] [PubMed] [Google Scholar]
- 14.Labauge P, Brunereau L, Laberge S, et al. Prospective follow-up of 33 asymptomatic patients with familial cerebral cavernous malformations. Neurology 2001; 57: 1825–1828. [DOI] [PubMed] [Google Scholar]
- 15.Lehnhardt FG, Von Smekal U, Ruckriem B, et al. Value of gradient-echo magnetic resonance imaging in the diagnosis of familial cerebral cavernous malformation. Arch Neurol 2005; 62: 653–658. [DOI] [PubMed] [Google Scholar]
- 16.De Souza JM, Domingues RC, Cruz LC, Jr, et al. Susceptibility-weighted imaging for the evaluation of patients with familial cerebral cavernous malformations: A comparison with T2-weighted fast spin-echo and gradient-echo sequences. Am J Neuroradiol 2008; 29: 154–158. [DOI] [PMC free article] [PubMed] [Google Scholar]
- 17.Haacke EM, Xu Y, Cheng YC, et al. Susceptibility weighted imaging (SWI). Magn Reson Med 2004; 52: 612–618. [DOI] [PubMed] [Google Scholar]
- 18.Tsui YK, Tsai FY, Hasso AN, et al. Susceptibility-weighted imaging for differential diagnosis of cerebral vascular pathology: A pictorial review. J Neurol Sci 2009; 287: 7–16. [DOI] [PubMed] [Google Scholar]
- 19.Haacke EM, Mittal S, Wu Z, et al. Susceptibility-weighted imaging: Technical aspects and clinical applications, Part 1. Am J Neuroradiol 2009; 30: 19–30. [DOI] [PMC free article] [PubMed] [Google Scholar]
- 20.Mittal S, Wu Z, Neelavalli J, et al. Susceptibility-weighted imaging: Technical aspects and clinical applications, Part 2. Am J Neuroradiol 2009; 30: 232–252. [DOI] [PMC free article] [PubMed] [Google Scholar]
- 21.Soman S, Holdsworth SJ, Barnes PD, et al. Improved T2* imaging without increase in scan time: SWI processing of 2D gradient echo. Am J Neuroradiol 2013; 34: 2092–2097. [DOI] [PMC free article] [PubMed] [Google Scholar]
- 22.Bulut HT, Sarica MA, Baykan AH. The value of susceptibility weighted magnetic resonance imaging in evaluation of patients with familial cerebral cavernous angioma. Int J Clin Exp Med 2014; 7: 5296–5302. [PMC free article] [PubMed] [Google Scholar]
- 23.Lee BCP, Vo KD, Kido DK, et al. MR high-resolution blood oxygenation level-dependent venography of occult (low-flow) vascular lesions. Am J Neuroradiology 1999; 20: 1239–1242. [PMC free article] [PubMed] [Google Scholar]
- 24.Sehgal V, Delproposto Z, Haacke EM, et al. Clinical applications of neuroimaging with susceptibility-weighted imaging. J Magn Reson Imag 2005; 22: 439–450. [DOI] [PubMed] [Google Scholar]
- 25.Rauscher A, Sedlacik J, Barth M, et al. Magnetic susceptibility-weighted MR phase imaging of the human brain. Am J Neuroradiol 2005; 26: 736–742. [PMC free article] [PubMed] [Google Scholar]
- 26.Wu Z, Mittal S, Kish K, et al. Identification of calcification with MRI using susceptibility-weighted imaging: A case study. J Magn Reson Imaging 2009; 29: 177–182. [DOI] [PMC free article] [PubMed] [Google Scholar]


