Abstract
Optical Coherence Tomography (OCT) is an emerging technique in the field of biomedical imaging, with applications in ophthalmology, dermatology, coronary imaging etc. OCT images usually suffer from a granular pattern, called speckle noise, which restricts the process of interpretation. Therefore the need for speckle noise reduction techniques is of high importance. To the best of our knowledge, use of Independent Component Analysis (ICA) techniques has never been explored for speckle reduction of OCT images. Here, a comparative study of several ICA techniques (InfoMax, JADE, FastICA and SOBI) is provided for noise reduction of retinal OCT images. Having multiple B-scans of the same location, the eye movements are compensated using a rigid registration technique. Then, different ICA techniques are applied to the aggregated set of B-scans for extracting the noise-free image. Signal-to-Noise-Ratio (SNR), Contrast-to-Noise-Ratio (CNR) and Equivalent-Number-of-Looks (ENL), as well as analysis on the computational complexity of the methods, are considered as metrics for comparison. The results show that use of ICA can be beneficial, especially in case of having fewer number of B-scans.
Keywords: Independent Component Analysis, Speckle Reduction, Optical Coherence Tomography (OCT)
1. Introduction
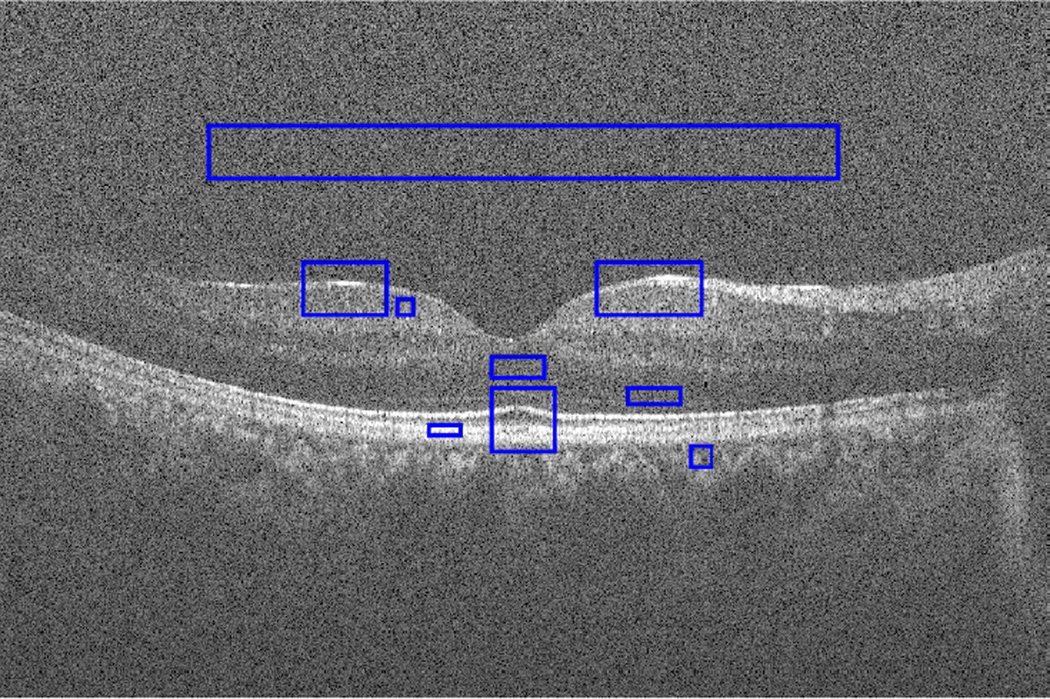
OCT is a powerful imaging system for non-invasive acquisition of 3D volumetric images of tissues [1], with applications in ophthalmology, dermatology, coronary imaging etc. Due to its underlying physics, which is common in narrow-band detection systems like Synthetic-Aperture Radar (SAR) and ultrasound, OCT images usually suffer from a granular pattern called speckle. Not only the optical properties of the system, but also the motion of the subject to be imaged, size and temporal coherence of the light source, multiple scattering, phase deviation of the beam and aperture of the detector can affect the speckle [2]. Fig. 1 shows a sample retinal OCT image, highly degraded by speckle noise.
Figure 1.
Sample retinal OCT image degraded by speckle noise; selected ROIs are shown with blue rectangles.
Speckle is considered to be multiplicative noise, in contrast to the additive Gaussian noise. Limited dynamic range of displays requires us to compress the OCT signals usually by a logarithmic transform, which converts the multiplicative speckle noise to additive noise [3]. Two major classes of speckle noise reduction techniques are: 1) methods of noise reduction during the acquisition time and 2) post-processing techniques. In the first class multiple uncorrelated recordings are averaged. This includes spatial [4], angular [5], polarization [6] and frequency [7] compounding techniques. As for post-processing, anisotropic diffusion-based techniques [3] and multi-scale/multi-resolution geometric representation techniques [8] are of high interest between scholars. Use of compressive sensing and sparse representation have also been explored in the past few years [9]. For a more complete review on the different image analysis techniques in OCT image processing, including noise reduction, the reader is referred to [10] and references therein.
Post-processing averaging/median filtering is also an interesting method for speckle reduction. In such techniques, multiple B-scans of the same location are acquired and then the average/median is taken. The misalignment between the different B-scans is usually compensated with a parametric image registration technique. Theoretically, having N B-scans with uncorrelated speckle, SNR can be improved by a factor of . The works presented in [11, 12] can be mentioned as examples. Recently the use of sparse and low-rank decomposition based batch image alignment was explored by the authors [13].
When it comes to the question of noise reduction in medical images, there are several issues that one might encounter that are not considered in general purpose image noise reduction techniques. The first is regarding the end user of such techniques. Unlike the common noise reduction techniques, the end users of medical image noise reduction techniques are more concerned about the truthfulness of the result to the actual anatomy rather than image quality metrics, since they need to make clinical decisions regarding the patients’ health. This is more critical when dealing with medical images that contain very fine anatomical details, like the cases encountered in OCT images. In such cases, assuming piecewise smoothness constraints that are common in general purpose noise reduction techniques can be very misleading since the scale of different features in these types of images vary drastically within images. Therefore, use of single frame noise reduction techniques is not preferred since the outcome might not be very faithful to the actual anatomy. Having a multi-frame technique, allows for combining information to have a better representation of the imaged anatomy. This is specially very common in OCT community, since image acquisition time is very small with the current imaging devices, with frame rates of several tens or even several hundreds. It is also worth mentioning that unlike white Gaussian noise which is considered as an additive component and is uncorrelated with the image data, speckle is multiplicative and is not completely uncorrelated with the image data. In fact speckle in inherent to imaging systems like SAR and OCT and contains signal-carrying and signal-degrading components [2]. Therefore having several frames with different speckle patterns, which is always the case in retinal OCT since we have involuntary eye movements between frames, provides an uncorrelated representation of signal-degrading part (speckle noise) which will benefit the noise reduction process.
In this paper the use of Independent Component Analysis (ICA) techniques for speckle noise reduction of retinal OCT images is explored, which to the best of our knowledge has never been investigated before. Having multiple B-scans of the same location in retina, the eye movement is compensated by considering a rigid transformation between consecutive B-scans using ImageJ [14]. Having negligible eye motion within each B-scan, the need for deformable registration techniques [15, 16] can be eliminated. Then, several ICA techniques are used for extracting the noise-free image from multiple noisy B-scans. SNR, CNR and ENL are considered as metrics for comparing the performance of different methods. Investigating the results reveals interesting facts regarding the impact of using ICA for speckle noise reduction. Especially in case of having a few number of images in which ICA techniques provide better performance in comparison to median filtering. But increasing the number of images causes the ICA techniques to perform poorly, since the main assumption in ICA is having non-Gaussian uncorrelated components which can’t be completely satisfied here.
2. Independent Component Analysis (ICA)
ICA is one of the most widely used techniques for Blind Source Separation (BSS) [17]. The problem of BSS consists of having interfering signals from multiple sources recorded and trying to find the individual source signals from these mixed recordings. The very well-known example is a cocktail party, with multiple people talking while there are recorders in different places of the room. This can be mathematically modeled by considering si(t), i = 1, …, N as the set of sources and xi(t), i = 1, …, N as the observations. Therefore:
| (1) |
where A is the unknown mixing matrix. Recovering the original signals si(t) from the recordings xi(t) is the objective of BSS. Therefore, estimating the unmixing matrix W such that W = A−1, the sources can be estimated:
| (2) |
But how to find W when you are ”blind” to the nature of mixing matrix and the source signals themselves? This question results in defining a set of constraints on the nature of source signals. As is obvious from the name, ICA, the components should be statistically independent. Mathematically speaking, having two random variables s1 and s2, the joint probability density function (pdf) p1,2(s1, s2) for independent variables can be computed as:
| (3) |
where p1(s1) and p2(s2) are the marginal pdf’s.
Another constraint of the signal sources is that they should be non-Gaussian. Based on the central limit theorem, the distribution of a sum of independent signals with arbitrary distributions tends to be a Gaussian distribution, which basically means any Gaussian distribution can be considered as a sum of multiple independent signals. Therefore having Gaussian signals as components prevents us from being able to distinguish them properly.
ICA has two ambiguities. The variance and the sign of the independent components cannot be estimated. This is usually insignificant in most of the applications. The second ambiguity is regarding the order of the extracted components which cannot be specified.
As for pre-processing the data before independent component analysis, centering the data (subtracting the mean value) is usually the first step in order to make the ICA procedure easier. The mean will be added after extracting the components. Whitening the data for having uncorrelated components with unit variances is next.
Here four well-known ICA methods are used for noise reduction of retinal OCT images: InfoMax (RUNICA) [18], FastICA [19], JADE [20] and SOBI [21]. In each one of these techniques a contrast/likelihood function is defined and optimized for achieving the optimal separation between sources. The InfoMax method works based on maximizing the output entropy (information flow) of a neural network with non-linear outputs. FastICA on the other hand tries to maximize the non-Gaussianity using an approximation for negentropy utilizing a fixed-point numerical scheme. Joint Approximate Diagonalisation of Eigen-matrices (JADE) method works based on digonalization of the sample data’s fourth-order cumulants of the whitened process created from the sample data and a whitening matrix. On the other hand, Second Order Blind Identification (SOBI) assumes that the sample data is gathered from a set of temporally correlated sources and tries to separate them by joint diagonalization of several correlation matrices. These techniques are widely used in different applications, like electroencephalogram (EEG) source separation [22]. In the following section brief overviews will be given for each one of the above-mentioned methods. The reader is referred to [17, 23, 24, 25, 26, 27, 28, 29] and references therein, as well as EEGLAB [30] and ICA Central (http://perso.telecom-paristech.fr/~cardoso/icacentral/) for further reading regarding other ICA techniques and pointers for implementations.
3. Methods
3.1. InfoMax
InfoMax is based on a neural network approach [18], which tries to maximize the mutual information of the network’s output Y about its input X, as follows:
| (4) |
where H(Y) is the entropy of output Y while H(Y|X) represents the entropy of the output that is not a result of input. Considering only the gradient of information theoretic quantities with respect to some parameter w in the network, while knowing that H(Y|X) does not depend on w, we can have:
| (5) |
Having a neural network with input vector x, weight matrix W, bias vector w0 and monotonically transformed output vector y = g(Wx) + w0 with g(u) being a sigmoidal function (g(u) = (1 + e−u)−1), the learning rule will be of the form:
| (6) |
where 1 is a vector of ones. At each iteration W is updated until it reaches convergence.
3.2. FastICA
The differential entropy H of a random vector y with density function f(y) can be defined as:
| (7) |
It has been proved that a Gaussian variable has the largest entropy among all random variables of equal variance [31, 32]. Therefore to obtain a measure for non-Gaussianity, a modified definition of differential entropy is used which is called negentropy:
| (8) |
in which H(ygauss) is a Gaussian random variable of the same covariance matrix as y. This measure is always non-negative since the second term in subtraction is always smaller or equal to the first term. For FastICA, an approximation of the negentropy is used:
| (9) |
υ being a zero-mean and unit variance Gaussian variable and G a non-quadratic function. Two examples for proper function G are and G2(u) = −exp(−u2/2) for 1 ≤ a1 ≤ 2. More elaboration on these choices can be found in [26]. Maximization of the non-Gaussianity of wT x is done using a fixed-point scheme consisting of several steps, with g being the derivative of G, as follows:
initialization of the weight vector w;
w+ = E{x(g(wT x))} − E{g(wT x)}w;
w = w+/‖w+‖;
goto step 2, until convergence.
In this formulation, the convergence happens when the new and old w vectors are in the same direction which means having their dot product equal to zero. Of course this can happen even if they are in opposite directions too, which is valid since that represents one of the ambiguities of the ICA.
3.3. SOBI
Assuming a more general case of mixed sources with addition of noise n(t) we have:
| (10) |
where A is a full-ranked complex matrix. The main assumption is to have second order stationary and mutually uncorrelated sources while the additive noise is assumed to be spatially and temporally white and uncorrelated with the source signals. SOBI tries to separate the components by joint diagonalization of several correlation matrices. Based on these assumptions, the algorithm of robust SOBI for N samples consists of several steps as follows [29]:
robust orthogonalization of the sensor signals, x̄ = Qx(t), Q being the orthogonalization matrix;
- estimate the set of covariance matrices:
for a set of time lags (p1, p2, …, pL);(11) performing joint approximate diagonalization: Rx̄(pi) = UDiUT, ∀i, which means estimating the orthogonal matrix U;
- estimating the source signals
and the mixing matrix(12) (13)
3.4. JADE
The JADE is a natural extension of the SOBI. The algorithm consists of the following steps [29]:
robust pre-whitening or orthogonalization: x̄ = Qx(t);
- performing eigen value decomposition (EVD) of the sampled contracted quadri-covariance matrix
with and Û = [û1, û2, …, ûn];(14) - estimating the n sampled contracted quadri-covariance matrices:
for , p = 1, 2, …, n;(15) finding an orthogonal joint diagonalization matrix U for all n matrices;
estimating the mixing matrix using Ŵ = Q+U.
For more elaboration on the methods for joint approximate diagonalization, the reader is referred to [29].
4. Results and Discussion
For testing the methods, multiple B-scans of the same cross-section in retina are acquired using a Bioptigen OCT device (Bioptigen, Inc. Durham, NC 27709) available at AOIP (Advanced Ocular Imaging Program, Medical College of Wisconsin, Milwaukee, WI). Even though the subject is asked to fixate, the involuntary eye movements (tremor, drifts, micro-saccades) cause misalignment between consecutive B-scans. Considering the effect of eye movements within each B-scan as negligible, a parametric registration technique, namely rigid registration, is suitable for compensating the motion between B-scans. For this, the rigid registration technique implemented in ImageJ [14] is used. After aligning the B-scans, they are vectorized and aggregated into a data matrix and then ICA techniques, implemented in MATLAB (The MathWorks, Inc, Natick, MA 01760), are applied to extract the independent components in the data matrix. The main component is the noise-free image, while the rest are only containing noise.
For assessing the performance of the methods, several metrics are considered. Considering 9 regions of interest (ROI) as depicted in Fig. 1 in the final result, one only containing background noise and the rest containing image features and homogeneous regions, the metrics can be defined as follows:
| (16) |
where μb and σb are the mean and standard deviation of the background noise and μm and σm are the mean and standard deviation of the m-th ROI containing image features. ENL provides a measure for smoothness of homogeneous regions while SNR and CNR provide information on the signal and contrast of image features with respect to the background noise. The average of these metrics are considered here for comparison. Different numbers of images of the human retina in the central foveal region are considered for assessing the performance of the proposed algorithm.
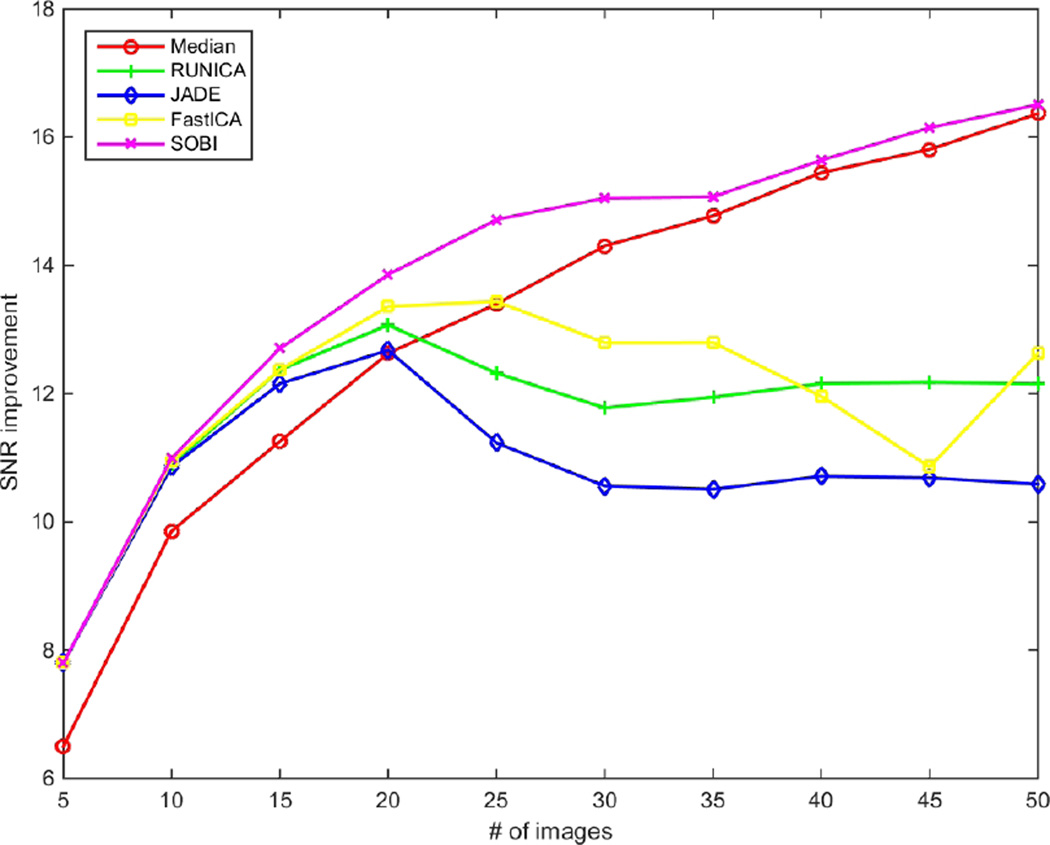
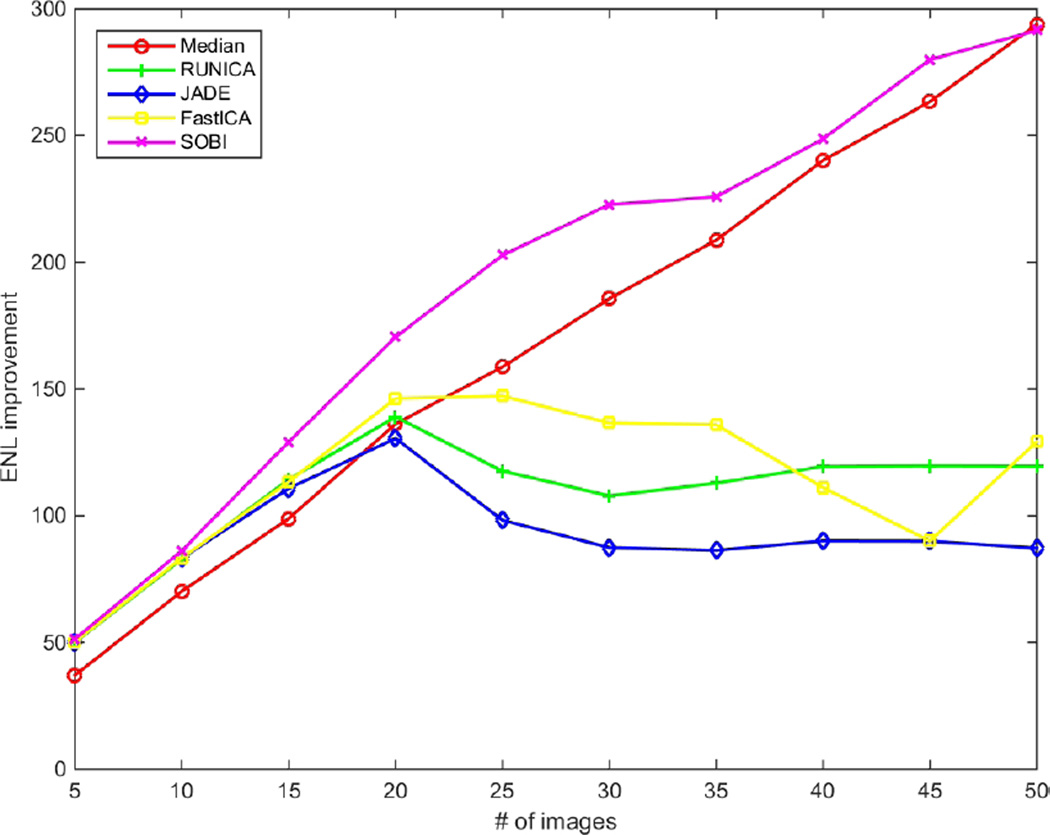
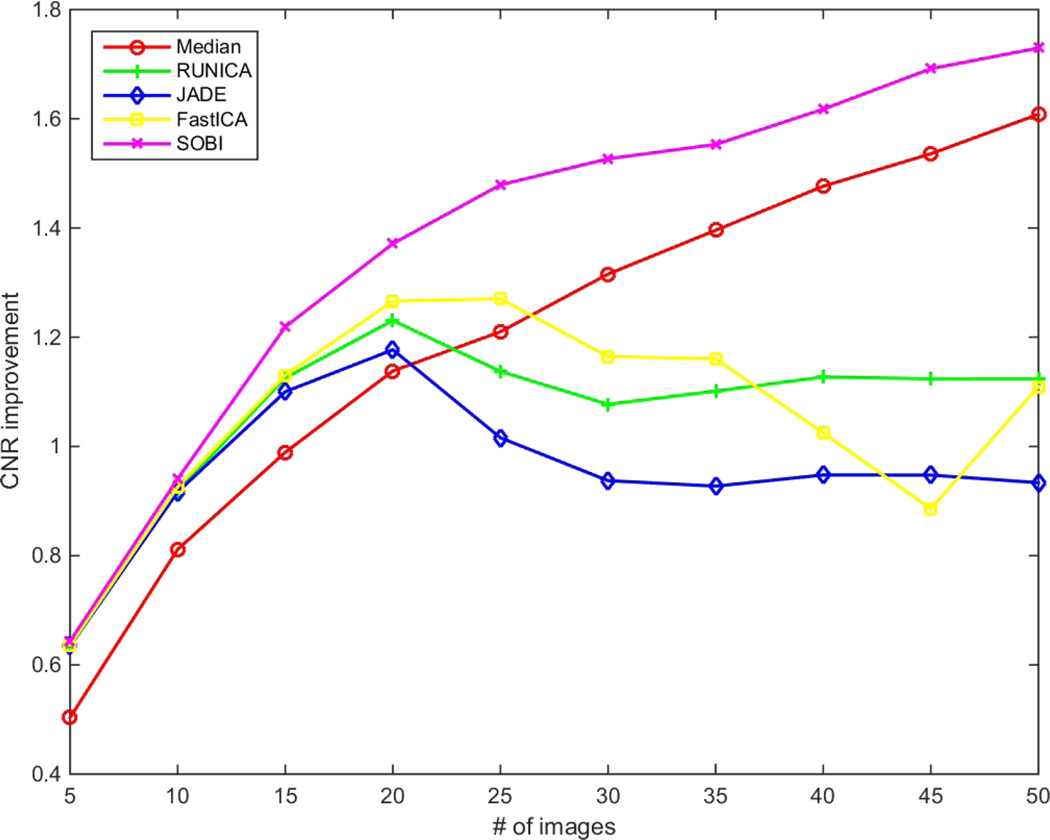
Fig. 2–4 show the performance of the introduced techniques in terms of SNR, CNR and ENL improvements, respectively. The values are computed by subtracting the initial values of SNR, CNR and ENL in a single frame from the results of the methods with different number of B-scans. Fig.2 displays the improvement of SNR for different methods using different numbers of input B-scans. Theoretically, having N images, the SNR can be improved by using average/median filtering. As is obvious, this is not the case for ICA techniques. While all of the ICA techniques outperform median filtering at first, for using up to 20 input B-scans, only the SOBI remains superior for the rest and RUNICA, JADE and FastICA perform poorly. As mentioned before, one of the main constraints on the input data for being able to use ICA is having uncorrelated non-Gaussian components. This can’t be satisfied, especially when using excessive number of images. The same pattern can be seen in Fig. 3 and Fig. 4 for the improvement of CNR and ENL, respectively. In case of SOBI, the assumption of having temporally correlated sources in the design of the algorithm makes it better in terms of SNR, CNR and ENL since the input images are acquired from the same location in retina, with the possibility of misalignment due to eye movement.
Figure 2.
SNR improvement for different number of input images (5–50).
Figure 4.
ENL improvement for different number of input images (5–50).
Figure 3.
CNR improvement for different number of input images (5–50).
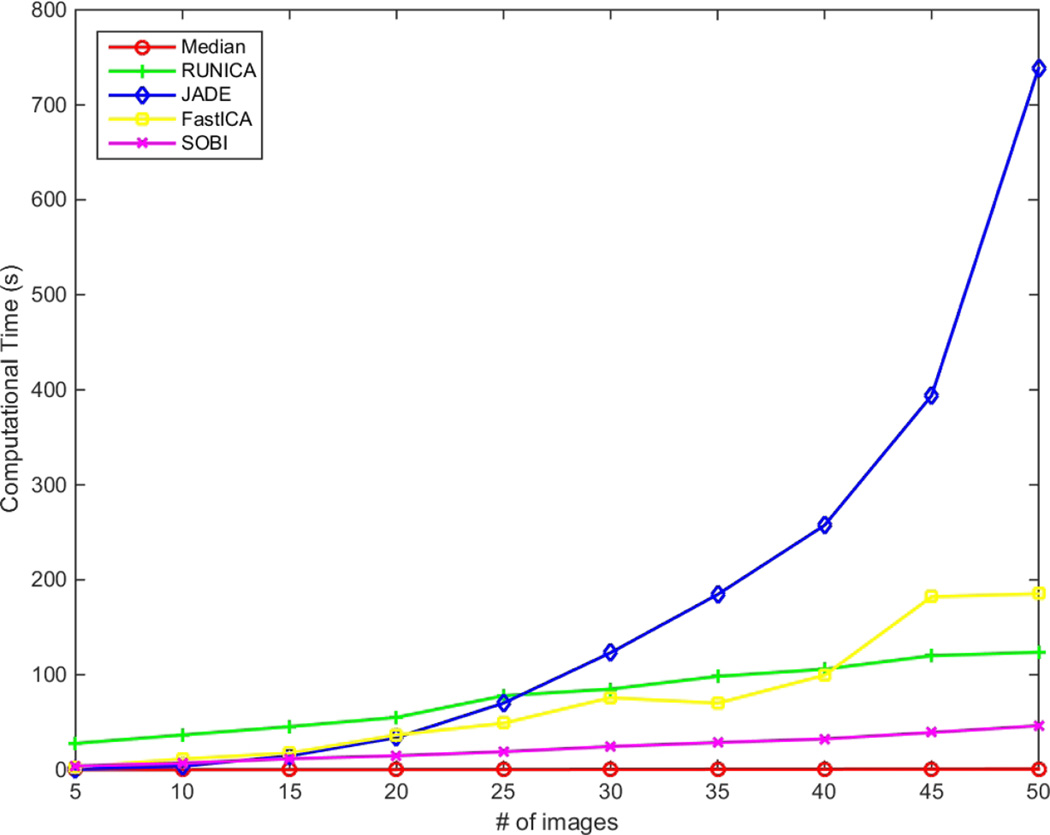
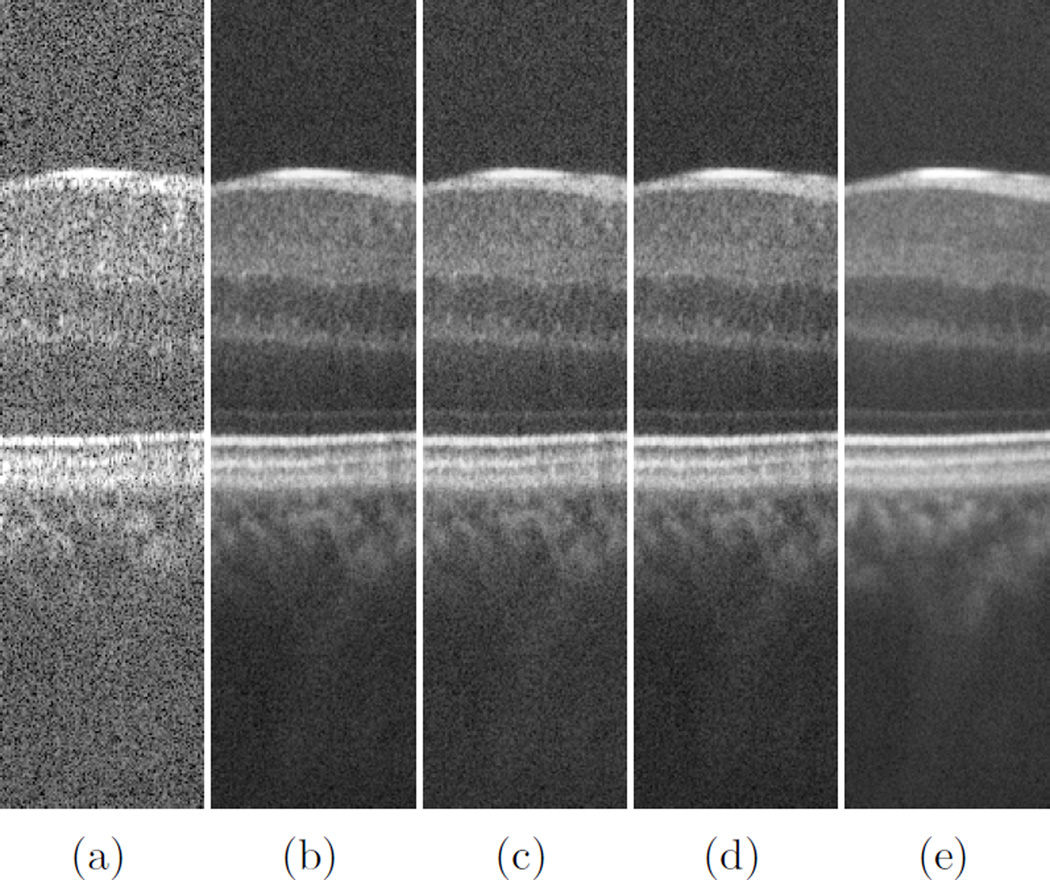
As for the computational complexity, while JADE shows a quadratic behavior for convergence, the rest show linear increment when having more input B-scans. Fig. 5 shows the graphs for computational time of different methods for different number of input images. Fig. 6 displays close-ups of the original and filtered version of the input images using different techniques for comparison. Even though the images in Fig. 6 contain the same objects for the most part, there is a subtle difference between the results of SOBI and the rest of the techniques, namely InfoMax, FastICA and JADE. This difference is more obvious in the choroid region, beneath the Retinal Pigment Epithelium (RPE). As is obvious from the previous graphs, SOBI performs best in terms of SNR, CNR and ENL in comparison to the rest of the methods. That is due to its formulation which allows for better combining the information contained in B-scans. The rest of the methods’ performances are in the same rank while SOBI outperforms them since it separates the signal/noise components by joint diagonalization of several covariance matrices which are created assuming several time-delays between individual B-scans.
Figure 5.
Comparison of computational times.
Figure 6.
A portion of one of the input images (a) and the results of InfoMax (b), JADE (c), FastICA (d) and SOBI (e), resulted from 50 B-scans.
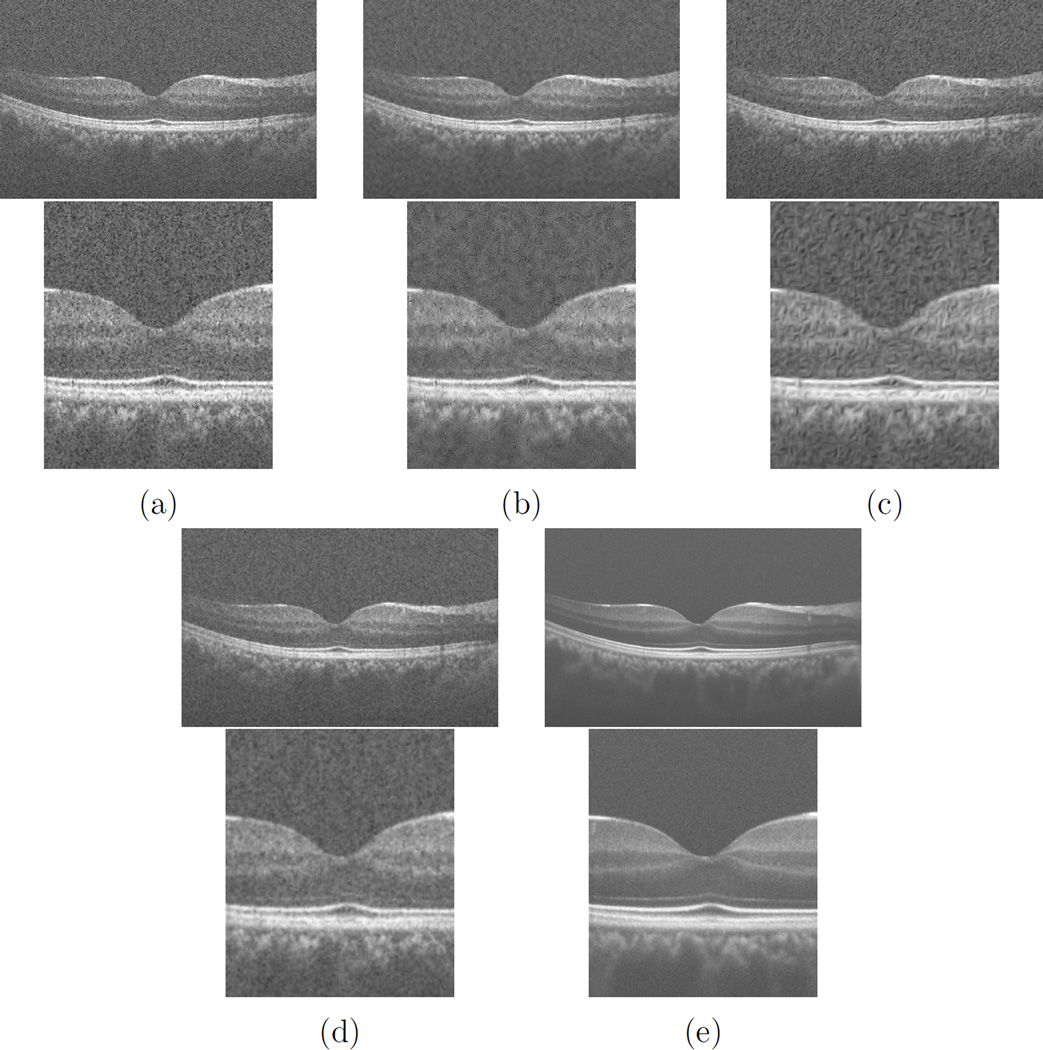
As mentioned before, use of multi-frame OCT noise reduction techniques is usually preferred in clinical applications since not only the image acquisition time is very low due to having high speed OCT devices, but also combining several frames in order to create the final results provides a more accurate representation of features presented in the OCT images. Single frame speckle reduction methods usually provide results that look blurry, even though the metrics show improvements in terms of SNR, CNR or ENL. Therefore having a multi-frame technique is more preferred since the end users of OCT images care more about the truthfulness of the images in comparison to the actual anatomy, rather than general purpose image quality metrics. Moreover, speckle is not uncorrelated with the image signal and is considered as a multiplicative noise rather than Gaussian noise which is additive. For comparing the performance of the best of ICA based techniques that discussed here, several single frame noise reduction methods are considered. As for the ICA based techniques, SOBI is considered based on the results of using 50 frames (SOBI-50). As for single frame methods, adaptive Wiener filtering (AWF) [33], dual-tree complex wavelet soft thresholding (DTWST) [34], Bayesian estimation (BE) [35] and anisotropic diffusion (AD) [36] are used. Table 1 shows the results of comparison between these methods and SOBI-50. Figure 7 shows the results of comparison between SOBI-50 with AWF, DTWST, AD and BE.
Table 1.
Comparison of multi-frame SOBI-50 with single frame adaptive Wiener filtering (AWF), dual-tree complex wavelet soft thresholding (DTWST), anisotropic diffusion (AD) and Bayesian estimation (BE) techniques in terms of SNR, CNR and ENL.
| Metric | AWF | DTWST | AD | BE | SOBI-50 |
|---|---|---|---|---|---|
| SNR | 17.29 | 18.72 | 21.48 | 23.98 | 27.61 |
| CNR | 1.23 | 1.45 | 1.65 | 1.97 | 2.45 |
| ENL | 58.26 | 87.80 | 113.67 | 172.43 | 308.6 |
Figure 7.
Comparison between the results of (a) AWF, (b) DTWST, (c) AD, (d) BE and (e) SOBI-50
5. Conclusion
In this paper, a new application of ICA techniques for noise reduction of retinal OCT images is proposed. Having a set of B-scans from the same location (to some extent) in retina, the eye movement is compensated using a parametric registration technique for compensating translation and rotation between consecutive B-scans. Then, taking advantage of four ICA techniques, RUNICA, JADE, FastICA and SOBI, the aggregated dataset is analyzed and the noise free image is extracted. Having N B-scans with uncorrelated speckle, the expected improvement in SNR for average/median filtering is . While this is satisfied for up to 20 input B-scans, with ICA techniques outperforming the median filtering, having more input B-scans results in poor performance in all of the ICA methods, except for SOBI. As for the comparison of the computational time, JADE has a quadratic behavior, while the rest show linear increment in computational time when having more images. Overall, SOBI is the best among the ICA techniques considered here in terms of performance based on SNR, CNR and ENL, while needing less computational power. As for pointers towards next possible areas for research, newer techniques for ICA/BSS as well as more analysis on the speckle noise model in OCT images should be explored and investigated, while reducing the computational complexity and exploring the possibility of using the techniques in an on-line manner can be considered as next steps.
Acknowledgments
The authors would like to thank Dr. Joseph Carroll from Advanced Ocular Imaging Program (AOIP), Medical College of Wisconsin (MCW), Milwaukee, WI for providing the data and insight. This work was partially supported by NIH P30EY001931. Support received by grant 8UL1TR000055 from the Clinical and Translational Science Award (CTSA) program of the National Center for Research Resources and the National Center for Advancing Translational Sciences. Support received by the Clinical and Translational Science Institute of Southeast Wisconsin through the Advancing a Healthier Wisconsin endowment of the Medical College of Wisconsin.
References
- 1.Huang D, Swanson EA, Lin CP, Schuman JS, Stinson WG, Chang W, Hee MR, Flotte T, Gregory K, Puliafito CA, et al. Optical coherence tomography. Science. 1991;254:1178–1181. doi: 10.1126/science.1957169. [DOI] [PMC free article] [PubMed] [Google Scholar]
- 2.Schmitt JM, Xiang S, Yung KM. Speckle in optical coherence tomography. Journal of biomedical optics. 1999;4:95–105. doi: 10.1117/1.429925. [DOI] [PubMed] [Google Scholar]
- 3.Salinas HM, Fernández DC. Comparison of pde-based nonlinear diffusion approaches for image enhancement and denoising in optical coherence tomography. Medical Imaging, IEEE Transactions on. 2007;26:761–771. doi: 10.1109/TMI.2006.887375. [DOI] [PubMed] [Google Scholar]
- 4.Avanaki MR, Cernat R, Tadrous PJ, Tatla T, Podoleanu AG, Hojjatoleslami SA. Spatial compounding algorithm for speckle reduction of dynamic focus oct images. Photonics Technology Letters, IEEE. 2013;25:1439–1442. [Google Scholar]
- 5.Schmitt J. Array detection for speckle reduction in optical coherence microscopy. Physics in Medicine and Biology. 1997;42:1427. doi: 10.1088/0031-9155/42/7/015. [DOI] [PubMed] [Google Scholar]
- 6.Kobayashi M, Hanafusa H, Takada K, Noda J. Polarization-independent interferometric optical-time-domain reectometer. Light-wave Technology, Journal of. 1991;9:623–628. [Google Scholar]
- 7.Pircher M, Go E, Leitgeb R, Fercher AF, Hitzenberger CK, et al. Speckle reduction in optical coherence tomography by frequency compounding. Journal of Biomedical Optics. 2003;8:565–569. doi: 10.1117/1.1578087. [DOI] [PubMed] [Google Scholar]
- 8.Pizurica A, Jovanov L, Huysmans B, Zlokolica V, De Keyser P, Dhaenens F, Philips W. Multiresolution denoising for optical coherence tomography: a review and evaluation. Current Medical Imaging Reviews. 2008;4:270–284. [Google Scholar]
- 9.Fang L, Li S, McNabb RP, Nie Q, Kuo AN, Toth C, Izatt J, Farsiu S, et al. Fast acquisition and reconstruction of optical coherence tomography images via sparse representation. Medical Imaging, IEEE Transactions on. 2013;32:2034–2049. doi: 10.1109/TMI.2013.2271904. [DOI] [PMC free article] [PubMed] [Google Scholar]
- 10.Baghaie A, D’Souza RM, Yu Z. State-of-the-art in retinal optical coherence tomography image analysis. Quantitative Imaging in Medicine and Surgery. 2015 doi: 10.3978/j.issn.2223-4292.2015.07.02. [DOI] [PMC free article] [PubMed] [Google Scholar]
- 11.Jørgensen TM, Thomadsen J, Christensen U, Soliman W, Sander B. Enhancing the signal-to-noise ratio in ophthalmic optical coherence tomography by image registration method and clinical examples. Journal of biomedical optics. 2007;12:041208–041208. doi: 10.1117/1.2772879. [DOI] [PubMed] [Google Scholar]
- 12.Alonso-Caneiro D, Read SA, Collins MJ. Speckle reduction in optical coherence tomography imaging by affine-motion image registration. Journal of biomedical optics. 2011;16:116027–1160275. doi: 10.1117/1.3652713. [DOI] [PubMed] [Google Scholar]
- 13.Baghaie A, D’souza RM, Yu Z. Sparse and low rank decomposition based batch image alignment for speckle reduction of retinal oct images. arXiv preprint arXiv:1411.4033. 2014 [Google Scholar]
- 14.Schneider CA, Rasband WS, Eliceiri KW. Nih image to imagej: 25 years of image analysis. Nature methods. 2012;9:671–675. doi: 10.1038/nmeth.2089. [DOI] [PMC free article] [PubMed] [Google Scholar]
- 15.Baghaie A, Yu Z, D’souza RM. Advances in Visual Computing. Springer; 2014. Fast mesh-based medical image registration; pp. 1–10. [Google Scholar]
- 16.Baghaie A, Yu Z. Computational Modeling of Objects Presented in Images. Fundamentals, Methods, and Applications. Springer; 2014. Curvature-based registration for slice interpolation of medical images; pp. 69–80. [Google Scholar]
- 17.Naik GR, Kumar DK. An overview of independent component analysis and its applications. Informatica. 2011;35 [Google Scholar]
- 18.Bell AJ, Sejnowski TJ. An information-maximization approach to blind separation and blind deconvolution. Neural computation. 1995;7:1129–1159. doi: 10.1162/neco.1995.7.6.1129. [DOI] [PubMed] [Google Scholar]
- 19.Hyvärinen A. Fast and robust fixed-point algorithms for independent component analysis. Neural Networks, IEEE Transactions on. 1999;10:626–634. doi: 10.1109/72.761722. [DOI] [PubMed] [Google Scholar]
- 20.Cardoso J-F, Souloumiac A. Blind beamforming for non-gaussian signals. IEE Proceedings F (Radar and Signal Processing) 140:362–370. IET. [Google Scholar]
- 21.Belouchrani A, Abed-Meraim K, Cardoso J, Moulines E. Proc. Int. Conf. Digital Signal Processing. Citeseer; Second-order blind separation of temporally correlated sources; pp. 346–351. [Google Scholar]
- 22.Delorme A, Palmer J, Onton J, Oostenveld R, Makeig S, et al. Independent eeg sources are dipolar. PloS one. 2012;7:e30135. doi: 10.1371/journal.pone.0030135. [DOI] [PMC free article] [PubMed] [Google Scholar]
- 23.Shen H, Jegelka S, Gretton A. Fast kernel-based independent component analysis. Signal Processing, IEEE Transactions on. 2009;57:3498–3511. [Google Scholar]
- 24.Kong W, Vanderburg CR, Gunshin H, Rogers JT, Huang X. A review of independent component analysis application to microarray gene expression data. Biotechniques. 2008;45:501. doi: 10.2144/000112950. [DOI] [PMC free article] [PubMed] [Google Scholar]
- 25.Cardoso J-F. High-order contrasts for independent component analysis. Neural computation. 1999;11:157–192. doi: 10.1162/089976699300016863. [DOI] [PubMed] [Google Scholar]
- 26.Hyvärinen A, Oja E. Independent component analysis: algorithms and applications. Neural networks. 2000;13:411–430. doi: 10.1016/s0893-6080(00)00026-5. [DOI] [PubMed] [Google Scholar]
- 27.Langlois D, Chartier S, Gosselin D. An introduction to independent component analysis: Infomax and fastica algorithms. Tutorials in Quantitative Methods for Psychology. 2010;6:31–38. [Google Scholar]
- 28.Choi S, Cichocki A, Park H-M, Lee S-Y. Blind source separation and independent component analysis: A review. Neural Information Processing-Letters and Reviews. 2005;6 [Google Scholar]
- 29.Cichocki A, Amari S-i. Adaptive blind signal and image processing: learning algorithms and applications. Vol. 1. John Wiley & Sons; 2002. [Google Scholar]
- 30.Delorme A, Makeig S. Eeglab: an open source toolbox for analysis of single-trial eeg dynamics including independent component analysis. Journal of neuroscience methods. 2004;134:9–21. doi: 10.1016/j.jneumeth.2003.10.009. [DOI] [PubMed] [Google Scholar]
- 31.Cover TM, Thomas JA. Elements of information theory. John Wiley & Sons; 2012. [Google Scholar]
- 32.Papoulis A, Pillai SU. Probability, random variables, and stochastic processes. Tata McGraw-Hill Education; 2002. [Google Scholar]
- 33.Lim JS. Two-dimensional signal and image processing. Vol. 710. Englewood Cliffs, NJ: Prentice Hall; 1990. p. 1. 1990. [Google Scholar]
- 34.Selesnick IW, Baraniuk RG, Kingsbury NG. The dual-tree complex wavelet transform. Signal Processing Magazine, IEEE. 2005;22:123–151. [Google Scholar]
- 35.Wong A, Mishra A, Bizheva K, Clausi DA. General bayesian estimation for speckle noise reduction in optical coherence tomography retinal imagery. Optics express. 2010;18:8338–8352. doi: 10.1364/OE.18.008338. [DOI] [PubMed] [Google Scholar]
- 36.Weickert J. Anisotropic diffusion in image processing. Vol. 1. Teubner Stuttgart: 1998. [Google Scholar]


