Abstract
Exercise promotes glucose clearance by increasing skeletal muscle GLUT4-mediated glucose uptake. Importantly, exercise upregulates muscle GLUT4 expression in an insulin-independent manner under conditions of insulin resistance, such as with type 2 diabetes. However, the insulin-independent mechanism responsible for rescued muscle GLUT4 expression is poorly understood. We used voluntary wheel running (VWR) in mice to test the prevailing hypothesis that insulin-independent upregulation of skeletal muscle GLUT4 protein expression with exercise is through increased Glut4 transcription. We demonstrate that 4 weeks of VWR exercise in obese mice rescued high-fat diet–induced decreased muscle GLUT4 protein and improved both fasting plasma insulin and hepatic triacylglyceride levels, but did not rescue muscle Glut4 mRNA. Persistent reduction in Glut4 mRNA suggests that a posttranscriptional mechanism regulated insulin-independent muscle GLUT4 protein expression in response to exercise in lean and obese mice. Reduction of GLUT4 protein in sedentary animals upon treatment with rapamycin revealed mTORC1-dependent GLUT4 regulation. However, no difference in GLUT4 protein expression was observed in VWR-exercised mice treated with either rapamycin or Torin 1, indicating that exercise-dependent regulation on GLUT4 was mTOR independent. The findings provide new insight into the mechanisms responsible for exercise-dependent regulation of GLUT4 in muscle.
Introduction
Physical activity promotes metabolic health and wellness, and exercise can help to prevent and treat insulin resistance and type 2 diabetes. Exercise counteracts insulin resistance in part by increasing GLUT4-dependent glucose uptake through increased insulin-independent GLUT4 transporter expression and translocation of GLUT4 to the cell surface in working muscle (1–3). Muscle-specific insulin receptor knockout mice have provided evidence that activity-dependent insulin-independent activation of GLUT4 translocation can maintain normal glucose homeostasis (4). We have previously shown that transgenic overexpression of GLUT4, under the control of the human GLUT4 promoter, enhances glucose tolerance in lean and obese mice (5). Taken together, these studies suggest that increasing GLUT4 expression and function is an important target for improving glucose tolerance. Because exercise allows for both increased insulin-independent GLUT4 expression and GLUT4 translocation, understanding how exercise regulates GLUT4 could be important in determining how we can target GLUT4 therapeutically.
Previous studies have suggested that exercise increases GLUT4 protein levels through increased transcription. Support for a transcriptional mechanism includes data demonstrating a transient increase in Glut4 transcription after a single bout of exercise and increased MEF2 factor binding to the Glut4 promoter (6–8). The majority of studies reported increased GLUT4 protein rather than mRNA levels, and the few articles that reported increased GLUT4 transcription with exercise showed that increased steady-state GLUT4 mRNA is transient (6,7,9–11). Studies on the effects of exercise on Glut4 transcription under conditions of obesity and insulin resistance are lacking. The current study suggests that transcriptional regulation is not the primary mechanism for enhanced GLUT4 protein expression in response to exercise in mice.
Our study demonstrates that 4 weeks of voluntary wheel running (VWR) in mice is sufficient to reverse some effects of high-fat diet (HFD)–induced insulin resistance, including improved plasma insulin, hepatic triacylglyceride (TAG), and skeletal muscle TAG levels. We found that VWR exercise increases skeletal muscle GLUT4 protein expression but not Glut4 transcript levels. From the data, therefore, we propose that the mechanism for insulin-independent exercise-induced upregulation of GLUT4 protein in obese mice is posttranscriptional.
Research Design and Methods
Animals and Diet
All procedures were approved by the Institutional Animal Use and Care Committee at the University of Oklahoma Health Sciences Center. Adult male C57BL/6 from The Jackson Laboratory were used. In some experiments, transgenic mice carried a randomly integrated transgenic construct of the chloramphenicol acetyltransferase (CAT) gene driven by 895 base pairs of the human GLUT4 promoter DNA (hG4-895-CAT). These mice were generated as previously described (12). Mice were fed ad libitum either a regular laboratory chow (regular diet [RD]) (13.1% kcal from fat; LabDiet #5053) or an HFD (60% kcal from fat, D12492; Research Diets) for 8 weeks before VWR exercise and through the exercise period. Mice were given free access to water throughout the experimental period.
Exercise Protocol
Cages were equipped with running wheels 2–3 days before recording distance measurements for mice designated for VWR. Running distance was calculated from weekly wheel revolutions for a 4-week duration and were recorded by electronic monitors. Wheels were taken away 16 h before tissue harvest to allow for exercise recovery.
Blood and Plasma Assays
All mice were fasted 16 h before collection of blood from tail veins of conscious mice. Blood was collected in tubes containing EDTA. Fasting blood glucose levels were measured with a TRUEtrack glucometer. Fasting plasma insulin concentrations were determined by Crystal Chem ELISA for mouse insulin.
Insulin Sensitivity Index
The insulin sensitivity index was calculated by multiplying fasting plasma glucose (mmol/L) and fasting plasma insulin (ng/mL). This calculation is analogous to the HOMA insulin resistance score for rodents but does not use the denominator constant as a correction factor, which is applicable to humans (13).
Glucose Tolerance Test
After a 6-h fast, mice were given glucose 2 mg/kg i.p., and tail vein blood glucose was measured with a TRUEtrack glucometer. Blood glucose was measured at 0.25, 0.5, 1, 1.5, 2, and 3 h after injection.
TAG and Glycogen Measurements
Lipids were extracted from liver and quadriceps muscle tissues by the Folch method (14). Lipids were resuspended in 0.1% Triton X-100, and TAGs were determined by colorimetric TAG determination kit (Sigma). True TAGs were calculated according to a standard curve and the manufacturer’s instructions. Liver and quadriceps muscle glycogen were determined by using the anthrone method (15). Tissue glycogen was calculated on the basis of a standard curve and correction factor of 0.9 for glycogen:glucose conversion.
Protein Analysis
Total tissue extracts from mouse quadriceps muscle were prepared using a lysis buffer containing 20 mmol/L HEPES (pH 7.4), 1% NP-40 (nonylphenoxypolyethoxylethanol), 2 mmol/L EDTA, 10 mmol/L sodium fluoride, 10 mmol/L sodium pyrophosphate, 1 mmol/L sodium orthovanadate, 1 mmol/L molybdate, protease inhibitor cocktail (cOmplete, Mini, EDTA-free Protease Inhibitor Cocktail; Roche), and 1 mmol/L phenylmethylsulfonyl fluoride. Protein concentrations were determined by a Pierce Coomassie (Bradford) Protein Assay Kit (Thermo Fisher Scientific). Denatured samples were fractionated by SDS-PAGE and transferred to polyvinylidene fluoride membranes (Millipore). Membranes were stained with anti-GLUT4 (C-20 goat polyclonal; Santa Cruz Biotechnology), anti-α/β-tubulin (#2148; Cell Signaling), antiphospho 4E-BP1 T37/46 (#2855; Cell Signaling), and antiphospho p70 S6 kinase (S6K) T389 (#9234; Cell Signaling). Membranes were visualized using the appropriate Alexa Fluor 680–conjugated secondary antibody and quantified with an Odyssey imaging system (LI-COR Biosciences).
RNA Extraction and Quantitative Real-Time PCR
Quadriceps muscle tissues were collected 16 h after removing the running wheels. The tissues were snap frozen in liquid nitrogen and stored at −80°C until tissue preparation. Total RNA was isolated using guanidinium isothiocyanate extraction followed by CsCl purification, and samples were stored at −20°C as ethanol precipitates as described previously (16). Real-time quantitative RT-PCR (qRT-PCR) analysis was performed by using the following primers: mouse Glut4, 5′-AAAAGTGCCTGAAACCAGAG-3′ (forward), 5′-TCACCTCCTGCTCTAAAAGG-3′ (reverse); CAT, 5′-TCCGGCAGTTTCTACACATA-3′ (forward), 5′-TGGCTGAGACGAAAAACATA-3′ (reverse); mouse 36B4, 5′-CTGAGTGATGTGCAGCTGAT-3′ (forward), 5′-AGAAGGGGGAGATGTTCAG-3′ (reverse); and mouse actin, 5′-CCTCACTGACTACCTGATGA-3′ (forward), 5′-AGCTCATAGCTCTTCTCCAG- 3′ (reverse). All qRT-PCRs were run by using a CFX96 real-time PCR detection system thermal cycler (Bio-Rad).
mTOR Inhibitor Treatments
Sedentary and exercised animals were given intraperitoneal injections of either 2.4 mg/kg body weight of rapamycin or vehicle solution every other day for 4 weeks during the VWR exercise as described previously (17). Mice in the Torin 1 study were given intraperitoneal injections of either 5 mg/kg Torin 1 or vehicle treatment every day of the running period (18). Rapamycin and Torin 1 treatments were prepared in a vehicle PBS solution containing 5% polyethylene glycol 400/5% Tween 80 as described previously (17). Weights were determined before each injection to obtain corresponding dosages for both rapamycin and Torin 1 injections.
Statistical Analysis
Data are expressed as the mean ± SEM. Comparisons among groups were performed using two-way ANOVA and/or Student t test where appropriate.
Results
Four Weeks of VWR Exercise Does Not Reduce Adiposity in HFD-Fed Mice
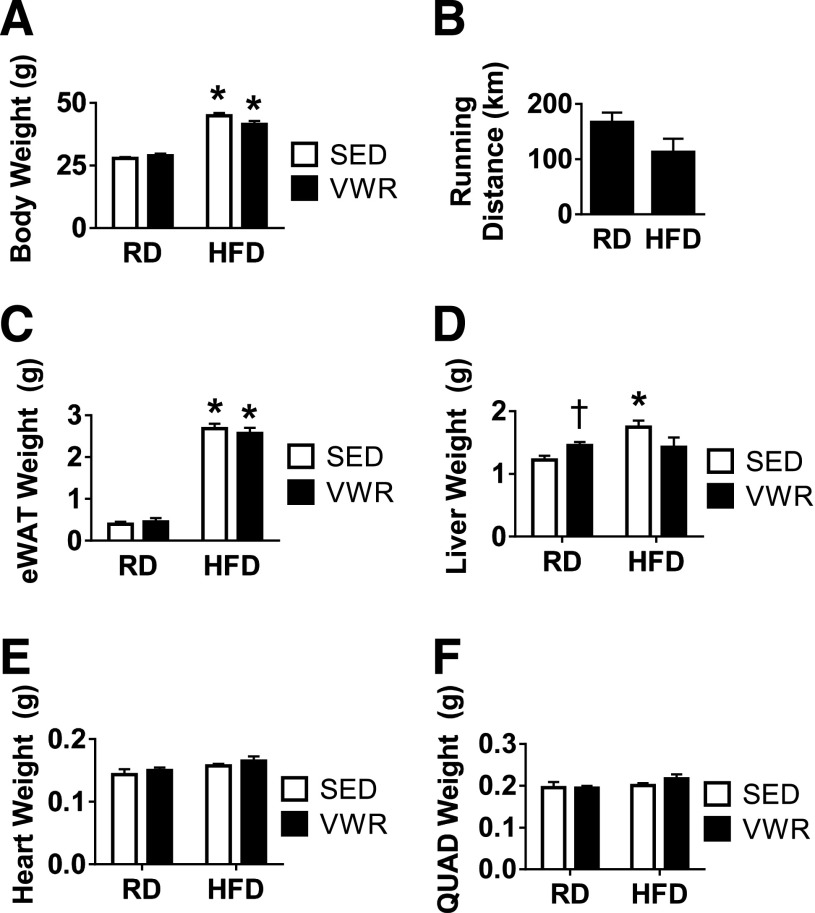
Lean mice fed RD or obese mice fed HFD for 8 weeks were randomly assigned to cages with or without running wheels. For the next 4 weeks, mice were allowed free access to food, water, and running wheels. VWR exercise had no effect on total body weight in lean mice (Fig. 1A). HFD feeding resulted in a predictable increase in body weight. At the end of exercise, VWR mice on HFD had maintained their increased body weight. The electronic wheel monitors confirmed that mice on HFD ran an average distance that was not significantly different from RD mice (Fig. 1B). Furthermore, the distance and variability in total running distance was comparable with that of previous wheel running studies for rodents (19–21).
Figure 1.
Four weeks of VWR exercise has no effect on total body weight, adiposity, or hypertrophy in lean or obese mice. A: Average total body weight at end of study. B: Total accumulated running distance throughout the VWR exercise regimen. C–F: eWAT, liver, heart, and right-side quadriceps skeletal muscle weight on termination of the study. n = 6–19 animals/group. Data are mean ± SEM. *P < 0.05, diet effect; †P < 0.05, VWR effect. QUAD, quadriceps; SED, sedentary.
To assess the effects of VWR exercise on visceral adiposity, we analyzed epididymal white adipose tissues (eWATs) by observing changes in total eWAT weight. HFD feeding increased total eWAT weight compared with mice fed RD (Fig. 1C). VWR did not decrease eWAT mass in mice fed either diet. HFD also increased liver weight by ∼30% (Fig. 1D). Of note, VWR also resulted in larger livers; however, the effect was not as pronounced as with HFD feeding. To evaluate whether our mode and duration of VWR exercise had an effect on muscle hypertrophy, we measured both heart and quadriceps muscle tissues for animals fed both diets. Similar to other rodent wheel running exercise studies, VWR exercise in our animals did not result in increased heart or quadriceps skeletal muscle size, suggesting that no hypertrophy occurs with 4 weeks of VWR (Fig. 1E and F) (20).
Four Weeks of VWR Exercise Improves Fasting Plasma Insulin and Glucose Tolerance
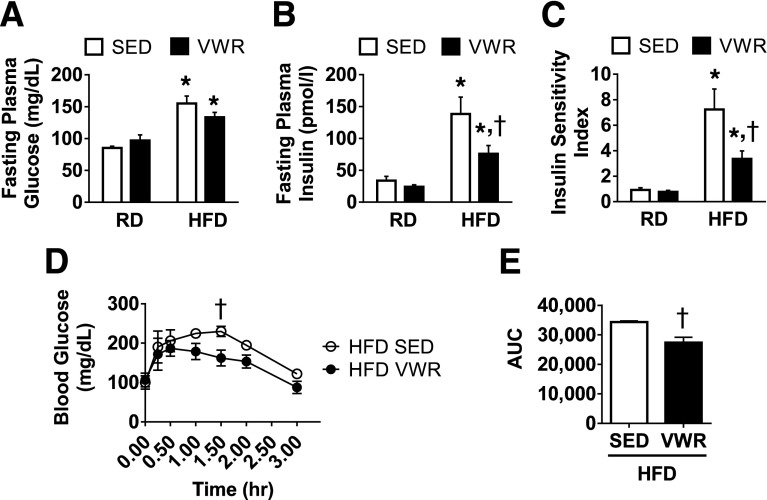
HFD feeding promotes insulin resistance in rodents. To assess the effects of VWR exercise on HFD-induced hyperglycemia and hyperinsulinemia, we measured both fasting plasma glucose and insulin levels. HFD feeding, as expected, increased fasting plasma glucose (Fig. 2A). HFD also increased fasting plasma insulin levels in sedentary animals by more than fourfold (Fig. 2B). VWR exercise alone did not affect blood glucose levels for mice fed either diet compared with their sedentary counterparts. VWR exercise did, however, greatly improve fasting plasma insulin in HFD mice but did not rescue insulin levels of obese animals to the level of lean controls. VWR exercise had no effect on insulin levels in RD mice.
Figure 2.
VWR exercise improves insulin sensitivity index and glucose tolerance in obese mice by decreasing fasting plasma insulin. Fasting plasma glucose (A) and insulin levels (B) were recorded as mg/dL and pmol/L, respectively. The insulin sensitivity index (C) was calculated based by multiplying fasting plasma glucose (mmol/L) by fasting insulin (ng/mL) values. Glucose tolerance test is shown in panels D and E. Data are mean ± SEM. *P < 0.05, diet effect; †P < 0.05, VWR effect. AUC, area under the curve; SED, sedentary.
To provide a measure of overall insulin sensitivity, we calculated an insulin sensitivity index. Sedentary HFD mice had an index value approximately eight times higher than sedentary RD mice. VWR exercise reduced the insulin sensitivity index value by one-half, suggesting improved insulin sensitivity (Fig. 2C). VWR exercise did not affect the insulin sensitivity index for RD mice.
Because the decreased insulin level due to VWR in HFD mice could reflect changes in liver rather than in skeletal muscle metabolism, we also performed a glucose tolerance test. We found that 4 weeks of VWR in HFD mice improved peripheral glucose tolerance as measured by a decrease in both blood glucose at 1.5-h postintraperitoneal glucose injection and total area under the curve (Fig. 2D and E).
Four Weeks of VWR Exercise Reduces Liver and Skeletal Muscle TAGs in HFD Mice
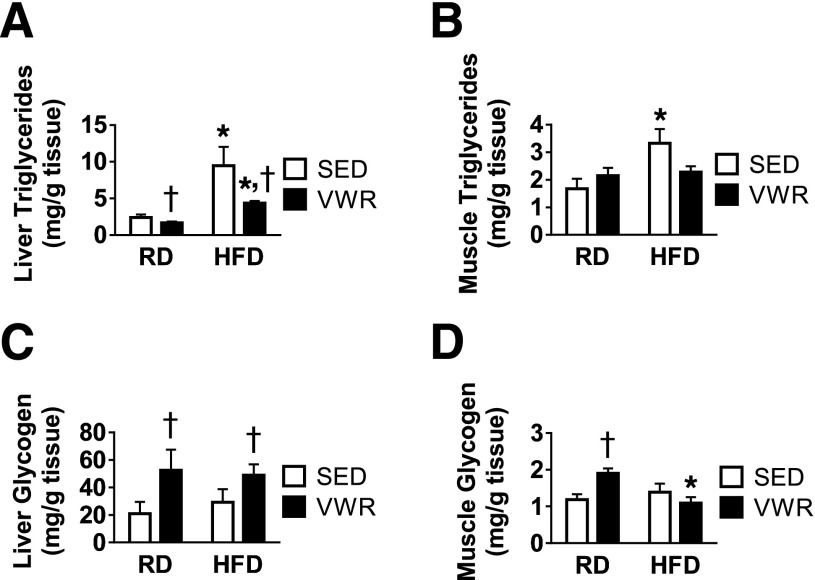
To investigate effects of VWR on lipid storage in our obese mouse model, we measured total TAG levels in liver and hindlimb skeletal muscle tissues in both RD and HFD mice. HFD feeding promoted a dramatic fourfold increase in liver TAGs in sedentary mice (Fig. 3A) and increased skeletal muscle TAGs in sedentary mice (Fig. 3B). VWR exercise promoted a small, but significant decrease in hepatic but not muscular TAG levels in RD mice and reduced both liver and muscle TAGs in HFD mice (Fig. 3A and B). Overall, the results indicate that 4 weeks of VWR exercise in obese mice caused a dramatic reduction in the level of hepatic TAG and was sufficient to return skeletal muscle TAG levels to that of lean littermate controls.
Figure 3.
VWR exercise improves hepatic and muscle TAG levels and promotes hepatic but not skeletal muscle glycogen repletion during exercise recovery. Liver (A) and hindlimb (B) skeletal muscle TAG. Liver (C) and hindlimb (D) skeletal muscle glycogen content. n = 5 animals/group. Data are mean ± SEM. *P < 0.05, diet effect; †P < 0.05, VWR effect. SED, sedentary.
HFD Prevents Skeletal Muscle Glycogen Repletion During VWR Exercise Recovery
To examine the effects of HFD feeding and VWR on hepatic and skeletal muscle carbohydrate storage, we measured glycogen content in these tissues 16 h after wheels were removed. Whereas HFD feeding alone did not affect liver or muscle glycogen levels, VWR increased hepatic glycogen content in both RD and HFD animals (Fig. 3C). Glycogen content in skeletal muscle tissue of RD mice increased 38% after VWR exercise (Fig. 3D). Of note, VWR did not increase glycogen levels in skeletal muscle of HFD animals (Fig. 3D). These data suggest that VWR exercise increases hepatic and skeletal muscle glycogen stores in RD mice as well as hepatic glycogen in obese HFD mice, whereas VWR does not increase glycogen in skeletal muscle tissue of HFD animals in response to VWR exercise.
Four Weeks of VWR Exercise Upregulates GLUT4 Protein Expression Posttranscriptionally
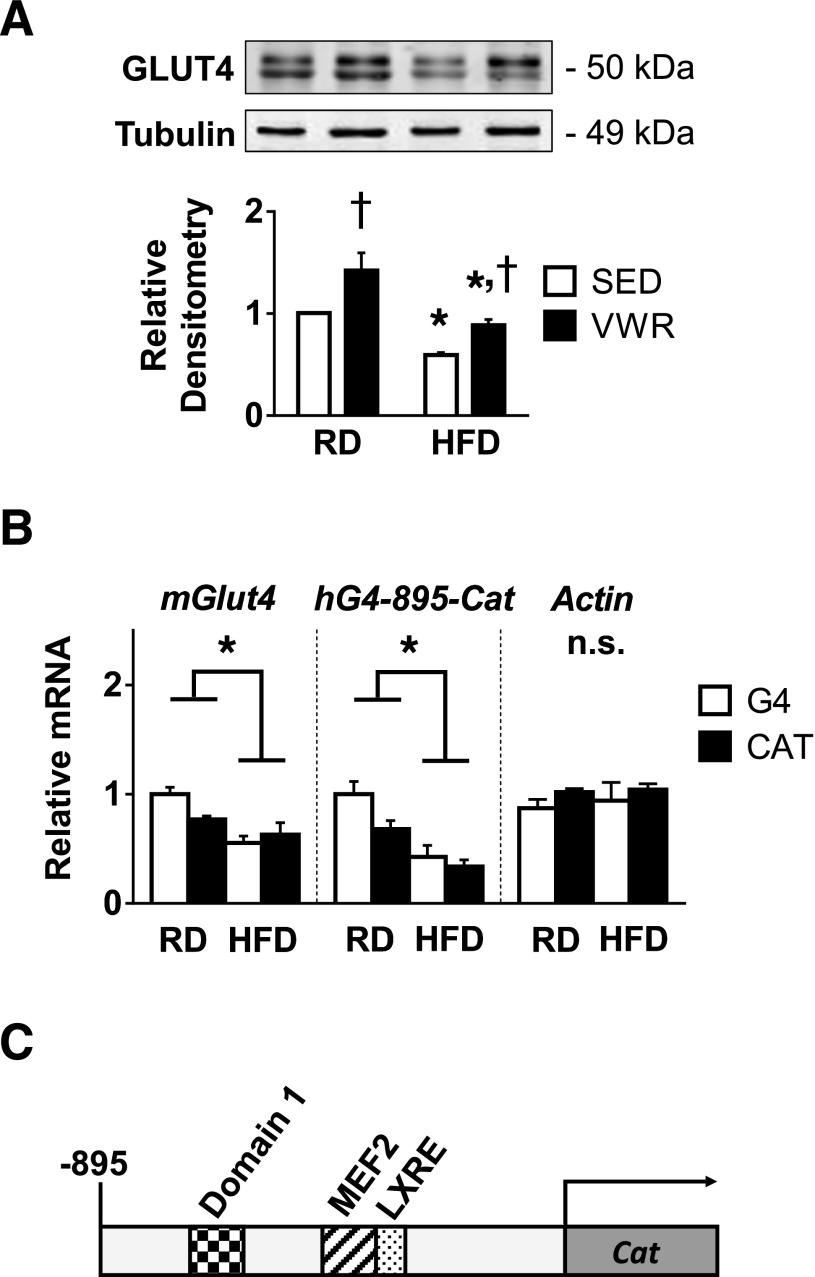
To test the hypothesis that exercise-mediated increases in skeletal muscle GLUT4 protein in obese mice occurs through increased Glut4 transcription, we measured steady-state levels for both GLUT4 protein and mRNA in quadriceps skeletal muscle for sedentary and VWR RD and HFD mice. HFD feeding decreased GLUT4 protein in both sedentary and VWR mice compared with their RD controls (Fig. 4A). In both RD and HFD mice, VWR significantly increased GLUT4 protein compared with the sedentary state. The increase in GLUT4 protein expression in obese animals due to VWR exercise was sufficient to restore GLUT4 protein to the level of sedentary RD controls. HFD feeding significantly reduced the level of Glut4 transcript in both sedentary and VWR animals compared with their RD counterparts (Fig. 4B). Although VWR increased GLUT4 protein levels, the exercise did not significantly increase Glut4 transcript levels, suggesting that a nontranscriptional mechanism plays a role in the upregulation of GLUT4 protein with exercise. To follow up on this unexpected finding, we further validated the results by assessing the effects of VWR exercise in transgenic obese mice carrying hG4-895-CAT (Fig. 4C) (22,23). Expression of the promoter/reporter construct is regulated identically to endogenous mouse Glut4 mRNA with respect to both tissue-specific and nutritional regulation of Glut4 gene expression (24). Similar to our steady-state mouse Glut4 mRNA results, we found that HFD reduced the level of CAT mRNA and that VWR did not increase these mRNA levels. Actin mRNA levels were not affected by HFD feeding or VWR exercise, indicating that the observed HFD-induced transcriptional downregulation is specific to Glut4 mRNA. These results further support a role for posttranscriptional regulation of GLUT4 production with exercise.
Figure 4.
VWR exercise in obese mice rescues steady-state GLUT4 protein but not mRNA. A: Representative immunoblots for relative GLUT4 protein determined by densitometry (n = 3). B: Relative Glut4, CAT reporter, and actin mRNA levels determined by qRT-PCR (n = 3–5). C: Schematic drawing of the transgenic mouse hG4-CAT promoter/reporter construct, including known regulatory sites. n = 3 animals per group. Data are mean ± SEM. *P < 0.05, diet effect; †P < 0.05, VWR effect. n.s., not significant; SED, sedentary.
HFD and VWR Differentially Affect Downstream mTORC1 Substrate Phosphorylation
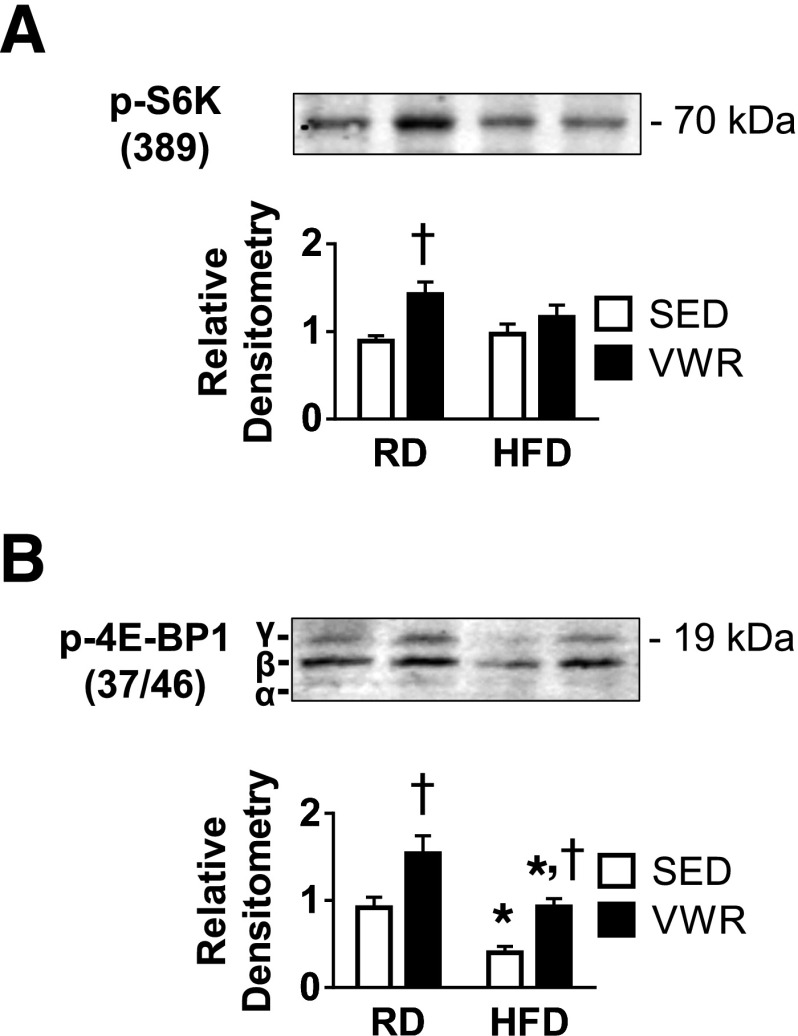
Because VWR increased GLUT4 protein concentration but not mRNA, we hypothesized that GLUT4 protein synthesis was increased. The mTORC1 pathway is involved in protein synthesis and responds to changes in nutrient flux and energy supply. Phosphorylation of the translational activator p70 S6K and hyperphosphorylation of the translational inhibitor eukaryotic translation initiation factor 4E–binding protein 1 (γ-4E-BP1) are commonly used as downstream markers for mTORC1 pathway activation (25–27). We used specific protein antibodies toward S6K T389 phosphorylation and 4E-BP1 T36/47 phosphorylation to determine whether VWR exercise activates these pathways (Fig. 5A and B). VWR exercise increased both phospho-S6K and γ-4E-BP1 in RD mice. HFD feeding in sedentary animals decreased the level of the γ-4E-BP1 (Fig. 5B). Although VWR was unable to increase S6K phosphorylation in HFD mice, VWR prevented the reduction in γ-4E-BP1. These data suggest that exercise-dependent upregulation of GLUT4 with VWR is mediated by increased mTORC1 production of γ-4E-BP1 and subsequent increased GLUT4 protein synthesis.
Figure 5.
VWR exercise in obese mice has no effect on p70 S6K activation but maintains 4E-BP1 inactivation. Representative immunoblots for relative phospho-p70 S6K (A) and phospho-4E-BP1 (B) protein determined by densitometry. Tubulin loading control for this group is shown in Fig. 4A with GLUT4 protein. n = 3 animals/group. Data are mean ± SEM. *P < 0.05, diet effect; †P < 0.05, VWR effect. SED, sedentary.
Increased GLUT4 Protein Expression With VWR Is Independent of Rapamycin-Sensitive and Torin 1–Sensitive mTORC1 Signaling
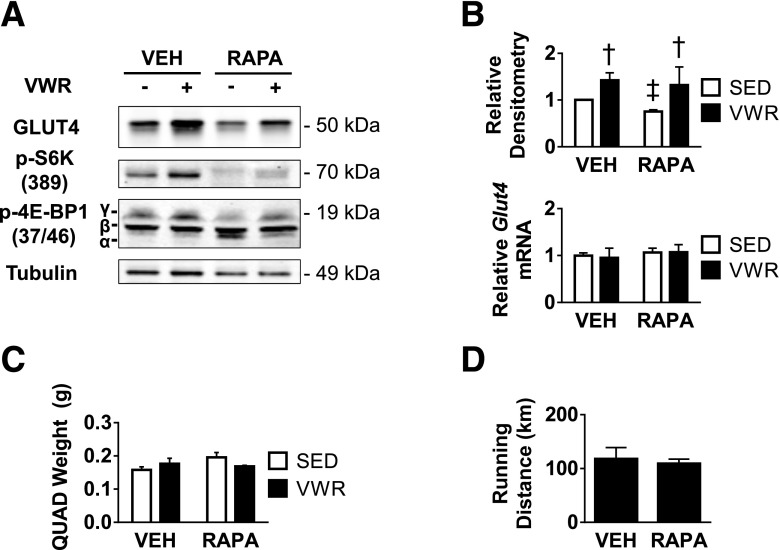
Because we observed the highest levels of phosphorylation of both mTOR substrates in lean mice, we used RD mice to test the hypothesis that mTORC1 plays a role in GLUT4-specific regulation. We found that rapamycin treatment specifically downregulated GLUT4 expression in sedentary mice by ∼25% as well as promoted the appearance of the α-band of 4E-BP1 (Fig. 6A and B). Rapamycin treatment also resulted in strong inhibition of S6K T389 phosphorylation (Fig. 6A). However, VWR-mediated increases in GLUT4 protein were not inhibited by rapamycin treatment, suggesting that GLUT4 upregulation might be mTORC1 independent. Additionally, rapamycin treatment did not decrease the level of γ-4E-BP1 in VWR-trained mice, suggesting that both formation of γ-4E-BP1 and upregulation of GLUT4 protein are rapamycin insensitive. Rapamycin treatment did not affect Glut4 mRNA, running distance, or quadriceps skeletal muscle size in these mice (Fig. 6B–D).
Figure 6.
mTORC1 regulates basal GLUT4 protein expression independent of VWR exercise. Data for rapamycin-treated lean mice. A: Representative immunoblots for relative GLUT4, phospho-S6K, phospho-4E-BP1, and tubulin. B: Quantity of GLUT4 protein determined by densitometry and Glut4 mRNA determined by qRT-PCR. C and D: Right-side quadriceps muscle weight (C) and total accumulated running distance (D) for mice treated with rapamycin. n = 3 animals/group. Data are mean ± SEM. †P < 0.05, VWR effect; ‡P < 0.05, rapamycin treatment effect. QUAD, quadriceps; RAPA, rapamycin treated; SED, sedentary; VEH, vehicle treated.
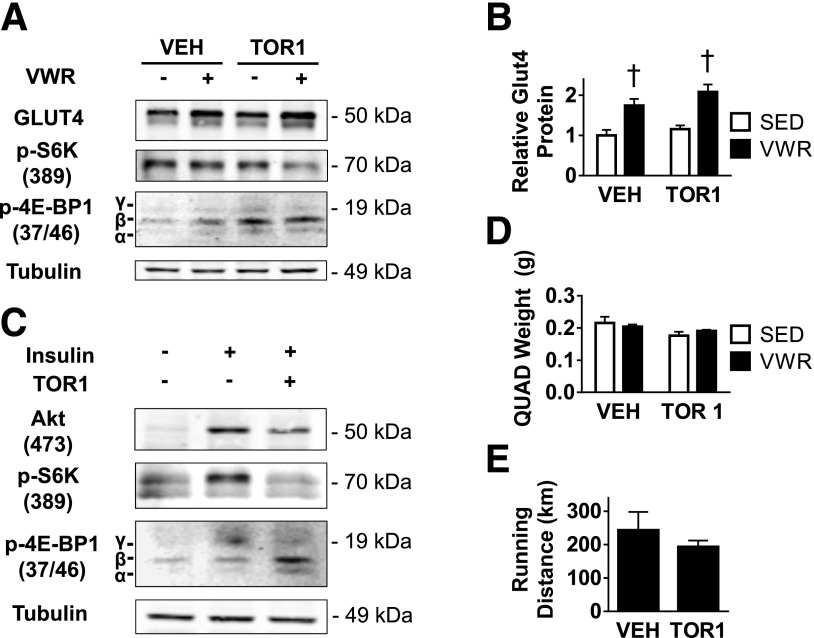
Because rapamycin did not prevent formation of γ-4E-BP1, we could not conclude that 4E-BP1 inhibition was necessary for upregulation of GLUT4 protein expression. Thus, in an attempt to prevent production of γ-4E-BP1, we treated mice with Torin 1, a more-specific inhibitor of 4E-BP1 γ-phosphorylation (28). Torin 1 treatment did not prevent upregulation of GLUT4 with VWR but did result in the accumulation of β-4E-BP1, an active form of the translation inhibitor (Fig. 7A and B). As expected, Torin 1 treatment did not affect S6K phosphorylation under basal and exercised conditions (27). To confirm the effectiveness of Torin 1 treatment in skeletal muscle in vivo, we treated mice with Torin 1 before an acute insulin treatment. We found that Torin 1 prevented insulin-stimulated increases in phospho-S6K and the formation of γ-4E-BP1 (Fig. 7C) (27). No difference in quadriceps weight or total running distance was observed between mice treated with vehicle versus Torin 1 (Fig. 7D and E).
Figure 7.
VWR upregulates GLUT4 protein expression independent of Torin 1–sensitive mTORC1 signaling. Data for lean mice treated with Torin 1. A: Representative immunoblots for relative GLUT4, phospho-S6K, phospho-4E-BP1, and tubulin. B: Quantity of GLUT4 protein determined by densitometry. C: Effect of Torin 1 on insulin-mediated downstream mTORC1 pathway signaling. D and E: Right-side quadriceps muscle weight (D) and total accumulated running distance (E) for mice treated with Torin 1. n = 3 animals/group. Data are mean ± SEM. †P < 0.05, VWR effect. QUAD, quadriceps; SED, sedentary; TOR1, Torin 1 treated; VEH, vehicle treated.
Discussion
This study used the HFD-induced insulin resistant mouse model to investigate the benefits of VWR exercise on nutrient metabolism and to gain insight into the exercise-induced mechanism responsible for insulin-independent upregulation of skeletal muscle GLUT4 protein levels in obese mice. Both endurance and resistance exercise have been shown to increase GLUT4 protein expression. We chose to use a VWR exercise because it is a less stressful alternative to treadmill running.
VWR exercise in HFD mice led to significant improvements in key markers of metabolic health, including reduced fasting insulin levels, improved glucose tolerance, and reduced liver and muscle TAG (Figs. 2 and 3). As expected, HFD feeding promoted increased liver and skeletal muscle TAG content (28–31). The larger liver size in obese sedentary animals is likely accounted for by the increased hepatic TAG (Fig. 1D). Decreased hepatic and quadriceps muscle TAG observed with VWR exercise may reflect increased turnover of endogenous nutrient stores with this moderate form of aerobic exercise. In agreement with previous studies, exercise increased liver glycogen stores in HFD mice (32,33). Of note, VWR was not able to increase muscle glycogen content of HFD mice, indicating that some aspects of HFD-induced metabolic changes persist even with exercise training, including inhibition of muscle glycogen synthesis. Although hexokinase activities have been found to be unchanged with long-term HFD feeding, some studies have found decreased glycogen content and glycogen synthase activity in obese individuals (30,33–35). Therefore, the inability to replenish muscle glycogen after exercise could be due to persistent inhibition of muscle glycogen synthase activity in obese animals.
Our primary objective was to gain insight into the exercise mechanism responsible for increased skeletal muscle GLUT4 protein in an insulin resistant mouse model. Previous studies support that the mechanism for decreased GLUT4 protein in adipose tissue is due to decreased transcriptional expression of Glut4 mRNA through increased association of transcriptionally repressive class II histone deacetylases to the Glut4 promoter (22,36). This mechanism has not been demonstrated in skeletal muscle. Some have speculated that exercise increased GLUT4 by activating pathways that result in removal of these transcriptional repressors, thus promoting increased Glut4 transcription (37,38). However, many of these studies assessed differences in GLUT4 protein but not transcript levels. Previous studies that measured Glut4 transcript levels showed a transient peak in Glut4 expression during the recovery period after exercise termination (6,7). As a result, the suggestion has been made that because the half-life of the GLUT4 protein is longer than that of Glut4 mRNA, the gradual increase in GLUT4 protein observed with exercise training is the product of repeated, though transient, increases in Glut4 transcription, which allows for skeletal muscle remodeling (and increased GLUT4 expression) over time (39). Exercise studies have supported this claim, providing data that show increased phosphorylation and export of class II histone deacetylases from the nucleus in response to activation of signaling pathways associated with exercise and contraction (i.e., AMPK, Ca2+/calmodulin-dependent protein kinase) (38,40,41). However, studies that test the mechanistic effects of exercise on Glut4 transcription, specifically under insulin resistant conditions, are necessary to uphold the hypothesis that upregulation of Glut4 is expressly through increased transcription.
We did not observe upregulation of Glut4 mRNA with increased GLUT4 protein levels in response to VWR exercise in either RD or HFD mice (Fig. 4B), which may be due to the fact that we missed the peak for a transient increase in mRNA because of the inability to control timing for exercise cessation with VWR. Previous studies that demonstrated either a transient or sustained increase in Glut4 mRNA after exercise used either a treadmill or a swimming exercise, the timing and intensity of which could be strictly controlled (6,7,42). Because VWR permitted variable intensity and duration of exercise compared with forced treadmill exercise or swimming, it is possible that the effects of transcription and posttranscription mechanisms regulating Glut4 expression differed between the paradigms.
VWR exercise increased muscle GLUT4 protein levels in HFD mice, but these protein levels did not exceed those found in sedentary RD animals. The restricted increase in GLUT4 protein levels in VWR HFD mice could be due to limited upregulation in the rate of protein synthesis because of the reduced level of Glut4 mRNA in the obese mice. Decreased Glut4 mRNA in HFD skeletal muscle can be due to decreased transcription or increased transcript degradation. We favor decreased transcription because steady-state levels of the hG4-895-CAT mRNA were decreased to the same extent as Glut4. In HFD animals, VWR exercise increased protein synthesis independent of transcriptional downregulation.
The signaling pathways leading to VWR-dependent protein synthesis are unclear. We found that the mTOR-dependent pathway effectors S6K and 4E-BP1, which regulate cap-dependent mRNA translation, were regulated by VWR in RD mice (Fig. 5). Because HFD prevented VWR-induced S6K activation yet permitted increased GLUT4 expression, we hypothesized that γ-4E-BP1 is required for the exercise-dependent GLUT4 protein synthesis. Although an HFD-dependent decrease in γ-4E-BP1 in sedentary animals was observed, VWR exercise prevented the HFD-induced reduction of γ-4E-BP1 in obese mice to the level of RD mice. Together, the data show that both HFD and VWR have distinct effects on phosphorylation of these downstream mTORC1 substrates. Furthermore, the findings support the notion that S6K and 4E-BP1 phosphorylation states undergo differential regulation depending on environmental and physiological conditions, including response to HFD and VWR exercise (43–46).
To test the hypothesis that the VWR-dependent increase in GLUT4 protein requires mTORC1-dependent 4E-BP1 γ-formation, we treated RD mice with rapamycin to inhibit mTORC1 signaling. Rapamycin treatment dramatically decreased phosphorylation of S6K, even in VWR mice. We again observed differential regulation between phospho-S6K and γ-4E-BP1 as the VWR-mediated increase in γ-4E-BP1 levels persisted in mice treated with rapamycin (Fig. 6A). These data suggest that either non-mTORC1 inputs promote 4E-BP1 formation resulting from exercise or rapamycin does not completely inhibit formation of γ-4E-BP1. Therefore, we treated mice with Torin 1 to rule out 4E-BP1 as a regulator of GLUT4 protein expression. The data suggest that the observed VWR-dependent increase in GLUT4 protein was both rapamycin and Torin 1 independent; thus, the VWR-dependent increase in GLUT4 expression may be regulated by a different translational mechanism than basal GLUT4 synthesis in muscle because as we and others have shown, basal GLUT4 levels are lower in rapamycin-treated cells and tissue (Fig. 6A and B) (47).
Although it remains important to understand how exercise transiently increases Glut4 transcription, this study shifts the focus toward understanding how GLUT4 protein synthesis is regulated by exercise. The data demonstrate that although HFD-dependent downregulation of Glut4 mRNA is likely responsible for decreased GLUT4 protein in obese animals, exercise is capable of increasing protein levels through a posttranscriptional mechanism. Although we favor an increase in protein synthesis, GLUT4 protein stability may be enhanced by exercise. The latter possibility seems less likely because exercise is associated with increased muscle protein turnover (48).
Article Information
Funding. This work was supported by National Institute for Diabetes and Digestive and Kidney Diseases grant DK-081545.
Duality of Interest. No potential conflicts of interest relevant to this article were reported.
Author Contributions. J.M.G. contributed to the data research and writing of the manuscript. B.A.G. contributed to the data research. A.L.O. contributed to the study concept, data collection and analysis, and writing, review, and editing of the manuscript. A.L.O. is the guarantor of this work and, as such, had full access to all the data in the study and takes responsibility for the integrity of the data and the accuracy of the data analysis.
References
- 1.Birnbaum MJ. Identification of a novel gene encoding an insulin-responsive glucose transporter protein. Cell 1989;57:305–315 [DOI] [PubMed] [Google Scholar]
- 2.James DE, Strube M, Mueckler M. Molecular cloning and characterization of an insulin-regulatable glucose transporter. Nature 1989;338:83–87 [DOI] [PubMed] [Google Scholar]
- 3.Rodnick KJ, Holloszy JO, Mondon CE, James DE. Effects of exercise training on insulin-regulatable glucose-transporter protein levels in rat skeletal muscle. Diabetes 1990;39:1425–1429 [DOI] [PubMed] [Google Scholar]
- 4.Wojtaszewski JF, Higaki Y, Hirshman MF, et al. Exercise modulates postreceptor insulin signaling and glucose transport in muscle-specific insulin receptor knockout mice. J Clin Invest 1999;104:1257–1264 [DOI] [PMC free article] [PubMed] [Google Scholar]
- 5.Atkinson BJ, Griesel BA, King CD, Josey MA, Olson AL. Moderate GLUT4 overexpression improves insulin sensitivity and fasting triglyceridemia in high-fat diet-fed transgenic mice. Diabetes 2013;62:2249–2258 [DOI] [PMC free article] [PubMed] [Google Scholar]
- 6.Neufer PD, Dohm GL. Exercise induces a transient increase in transcription of the GLUT-4 gene in skeletal muscle. Am J Physiol 1993;265:C1597–C1603 [DOI] [PubMed] [Google Scholar]
- 7.MacLean PS, Zheng D, Jones JP, Olson AL, Dohm GL. Exercise-induced transcription of the muscle glucose transporter (GLUT 4) gene. Biochem Biophys Res Commun 2002;292:409–414 [DOI] [PubMed] [Google Scholar]
- 8.Smith JA, Collins M, Grobler LA, Magee CJ, Ojuka EO. Exercise and CaMK activation both increase the binding of MEF2A to the Glut4 promoter in skeletal muscle in vivo. Am J Physiol Endocrinol Metab 2007;292:E413–E420 [DOI] [PubMed] [Google Scholar]
- 9.Kraniou Y, Cameron-Smith D, Misso M, Collier G, Hargreaves M. Effects of exercise on GLUT-4 and glycogenin gene expression in human skeletal muscle. J Appl Physiol (1985) 2000;88:794–796 [DOI] [PubMed]
- 10.Kraniou GN, Cameron-Smith D, Hargreaves M. Effect of short-term training on GLUT-4 mRNA and protein expression in human skeletal muscle. Exp Physiol 2004;89:559–563 [DOI] [PubMed] [Google Scholar]
- 11.Higashida K, Kim SH, Higuchi M, Holloszy JO, Han DH. Normal adaptations to exercise despite protection against oxidative stress. Am J Physiol Endocrinol Metab 2011;301:E779–E784 [DOI] [PMC free article] [PubMed] [Google Scholar]
- 12.Thai MV, Guruswamy S, Cao KT, Pessin JE, Olson AL. Myocyte enhancer factor 2 (MEF2)-binding site is required for GLUT4 gene expression in transgenic mice. Regulation of MEF2 DNA binding activity in insulin-deficient diabetes. J Biol Chem 1998;273:14285–14292 [DOI] [PubMed] [Google Scholar]
- 13.Matthews DR, Hosker JP, Rudenski AS, Naylor BA, Treacher DF, Turner RC. Homeostasis model assessment: insulin resistance and beta-cell function from fasting plasma glucose and insulin concentrations in man. Diabetologia 1985;28:412–419 [DOI] [PubMed] [Google Scholar]
- 14.Folch J, Lees M, Sloane Stanley GH. A simple method for the isolation and purification of total lipides from animal tissues. J Biol Chem 1957;226:497–509 [PubMed] [Google Scholar]
- 15.Roe JH, Dailey RE. Determination of glycogen with the anthrone reagent. Anal Biochem 1966;15:245–250 [DOI] [PubMed] [Google Scholar]
- 16.Olson AL, Perlman S, Robillard JE. Developmental regulation of angiotensinogen gene expression in sheep. Pediatr Res 1990;28:183–185 [DOI] [PMC free article] [PubMed] [Google Scholar]
- 17.Chen C, Liu Y, Liu Y, Zheng P. mTOR regulation and therapeutic rejuvenation of aging hematopoietic stem cells. Sci Signal 2009;2:ra75. [DOI] [PMC free article] [PubMed] [Google Scholar]
- 18.Vogel KR, Ainslie GR, Jansen EE, Salomons GS, Gibson KM. Torin 1 partially corrects vigabatrin-induced mitochondrial increase in mouse. Ann Clin Transl Neurol 2015;2:699–706 [DOI] [PMC free article] [PubMed] [Google Scholar]
- 19.Tsao TS, Li J, Chang KS, et al. Metabolic adaptations in skeletal muscle overexpressing GLUT4: effects on muscle and physical activity. FASEB J 2001;15:958–969 [DOI] [PubMed] [Google Scholar]
- 20.Gamu D, Trinh A, Bombardier E, Tupling AR. Persistence of diet-induced obesity despite access to voluntary activity in mice lacking sarcolipin. Physiol Rep 2015;3:e12549. [DOI] [PMC free article] [PubMed] [Google Scholar]
- 21.Rodnick KJ, Reaven GM, Haskell WL, Sims CR, Mondon CE. Variations in running activity and enzymatic adaptations in voluntary running rats. J Appl Physiol (1985) 1989;66:1250–1257 [DOI] [PubMed]
- 22.Weems JC, Griesel BA, Olson AL. Class II histone deacetylases downregulate GLUT4 transcription in response to increased cAMP signaling in cultured adipocytes and fasting mice. Diabetes 2012;61:1404–1414 [DOI] [PMC free article] [PubMed] [Google Scholar]
- 23.Griesel BA, Weems J, Russell RA, Abel ED, Humphries K, Olson AL. Acute inhibition of fatty acid import inhibits GLUT4 transcription in adipose tissue, but not skeletal or cardiac muscle tissue, partly through liver X receptor (LXR) signaling. Diabetes 2010;59:800–807 [DOI] [PMC free article] [PubMed] [Google Scholar]
- 24.Olson AL, Pessin JE. Transcriptional regulation of the human GLUT4 gene promoter in diabetic transgenic mice. J Biol Chem 1995;270:23491–23495 [DOI] [PubMed] [Google Scholar]
- 25.Steiner JL, Lang CH. Alcohol impairs skeletal muscle protein synthesis and mTOR signaling in a time-dependent manner following electrically stimulated muscle contraction. J Appl Physiol (1985) 2014;117:1170–1179 [DOI] [PMC free article] [PubMed]
- 26.Wang X, Beugnet A, Murakami M, Yamanaka S, Proud CG. Distinct signaling events downstream of mTOR cooperate to mediate the effects of amino acids and insulin on initiation factor 4E-binding proteins. Mol Cell Biol 2005;25:2558–2572 [DOI] [PMC free article] [PubMed] [Google Scholar]
- 27.Liu Y, Vertommen D, Rider MH, Lai YC. Mammalian target of rapamycin-independent S6K1 and 4E-BP1 phosphorylation during contraction in rat skeletal muscle. Cell Signal 2013;25:1877–1886 [DOI] [PubMed] [Google Scholar]
- 28.Kraegen EW, Clark PW, Jenkins AB, Daley EA, Chisholm DJ, Storlien LH. Development of muscle insulin resistance after liver insulin resistance in high-fat-fed rats. Diabetes 1991;40:1397–1403 [DOI] [PubMed] [Google Scholar]
- 29.Storlien LH, Jenkins AB, Chisholm DJ, Pascoe WS, Khouri S, Kraegen EW. Influence of dietary fat composition on development of insulin resistance in rats. Relationship to muscle triglyceride and omega-3 fatty acids in muscle phospholipid. Diabetes 1991;40:280–289 [DOI] [PubMed] [Google Scholar]
- 30.Oakes ND, Cooney GJ, Camilleri S, Chisholm DJ, Kraegen EW. Mechanisms of liver and muscle insulin resistance induced by chronic high-fat feeding. Diabetes 1997;46:1768–1774 [DOI] [PubMed] [Google Scholar]
- 31.Petersen KF, Dufour S, Savage DB, et al. The role of skeletal muscle insulin resistance in the pathogenesis of the metabolic syndrome. Proc Natl Acad Sci U S A 2007;104:12587–12594 [DOI] [PMC free article] [PubMed] [Google Scholar]
- 32.Conlee RK, Hammer RL, Winder WW, Bracken ML, Nelson AG, Barnett DW. Glycogen repletion and exercise endurance in rats adapted to a high fat diet. Metabolism 1990;39:289–294 [DOI] [PubMed] [Google Scholar]
- 33.Saitoh S, Shimomura Y, Tasaki Y, Suzuki M. Effect of short-term exercise training on muscle glycogen in resting conditions in rats fed a high fat diet. Eur J Appl Physiol Occup Physiol 1992;64:62–67 [DOI] [PubMed] [Google Scholar]
- 34.Zierath JR, Houseknecht KL, Gnudi L, Kahn BB. High-fat feeding impairs insulin-stimulated GLUT4 recruitment via an early insulin-signaling defect. Diabetes 1997;46:215–223 [DOI] [PubMed] [Google Scholar]
- 35.Højlund K, Staehr P, Hansen BF, et al. Increased phosphorylation of skeletal muscle glycogen synthase at NH2-terminal sites during physiological hyperinsulinemia in type 2 diabetes. Diabetes 2003;52:1393–1402 [DOI] [PubMed] [Google Scholar]
- 36.Weems J, Olson AL. Class II histone deacetylases limit GLUT4 gene expression during adipocyte differentiation. J Biol Chem 2011;286:460–468 [DOI] [PMC free article] [PubMed] [Google Scholar]
- 37.McGee SL, Fairlie E, Garnham AP, Hargreaves M. Exercise-induced histone modifications in human skeletal muscle. J Physiol 2009;587:5951–5958 [DOI] [PMC free article] [PubMed] [Google Scholar]
- 38.McGee SL, van Denderen BJ, Howlett KF, et al. AMP-activated protein kinase regulates GLUT4 transcription by phosphorylating histone deacetylase 5. Diabetes 2008;57:860–867 [DOI] [PubMed] [Google Scholar]
- 39.MacLean PS, Zheng D, Dohm GL. Muscle glucose transporter (GLUT 4) gene expression during exercise. Exerc Sport Sci Rev 2000;28:148–152 [PubMed] [Google Scholar]
- 40.Mukwevho E, Kohn TA, Lang D, Nyatia E, Smith J, Ojuka EO. Caffeine induces hyperacetylation of histones at the MEF2 site on the Glut4 promoter and increases MEF2A binding to the site via a CaMK-dependent mechanism. Am J Physiol Endocrinol Metab 2008;294:E582–E588 [DOI] [PubMed] [Google Scholar]
- 41.McGee SL, Hargreaves M. Exercise and myocyte enhancer factor 2 regulation in human skeletal muscle. Diabetes 2004;53:1208–1214 [DOI] [PubMed] [Google Scholar]
- 42.Ren JM, Semenkovich CF, Gulve EA, Gao J, Holloszy JO. Exercise induces rapid increases in GLUT4 expression, glucose transport capacity, and insulin-stimulated glycogen storage in muscle. J Biol Chem 1994;269:14396–14401 [PubMed] [Google Scholar]
- 43.Philp A, Schenk S, Perez-Schindler J, et al. Rapamycin does not prevent increases in myofibrillar or mitochondrial protein synthesis following endurance exercise. J Physiol 2015;593:4275–4284 [DOI] [PMC free article] [PubMed] [Google Scholar]
- 44.Choo AY, Blenis J. Not all substrates are treated equally: implications for mTOR, rapamycin-resistance and cancer therapy. Cell Cycle 2009;8:567–572 [DOI] [PubMed] [Google Scholar]
- 45.Choo AY, Yoon SO, Kim SG, Roux PP, Blenis J. Rapamycin differentially inhibits S6Ks and 4E-BP1 to mediate cell-type-specific repression of mRNA translation. Proc Natl Acad Sci U S A 2008;105:17414–17419 [DOI] [PMC free article] [PubMed] [Google Scholar]
- 46.Gingras AC, Gygi SP, Raught B, et al. Regulation of 4E-BP1 phosphorylation: a novel two-step mechanism. Genes Dev 1999;13:1422–1437 [DOI] [PMC free article] [PubMed] [Google Scholar]
- 47.Deblon N, Bourgoin L, Veyrat-Durebex C, et al. Chronic mTOR inhibition by rapamycin induces muscle insulin resistance despite weight loss in rats. Br J Pharmacol 2012;165:2325–2340 [DOI] [PMC free article] [PubMed] [Google Scholar]
- 48.Pikosky MA, Gaine PC, Martin WF, et al. Aerobic exercise training increases skeletal muscle protein turnover in healthy adults at rest. J Nutr 2006;136:379–383 [DOI] [PubMed] [Google Scholar]


