There is an error in the third-to-last sentence of the “BmMetRS in complex with inhibitors” section. The correct sentence is: A superposition of 4PY2 Chain B and 4MVW Chain A gives a good illustration of this (Fig 7).
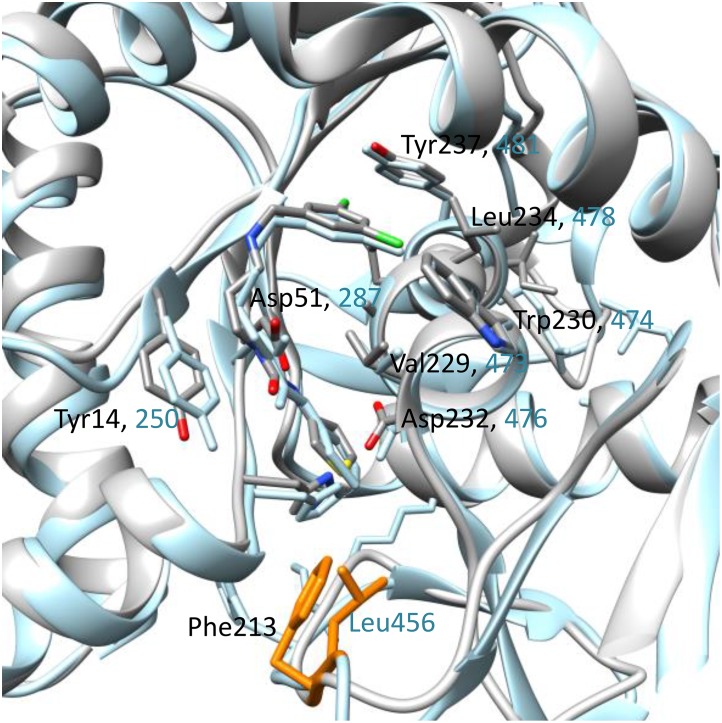
Fig 7. A superposition of BmMetRS (PDB ID 4PY2 Chain B) and TbMetRS (PDB ID 4MVW Chain) bound to compound 1433.
A key difference is the interaction of BmMetRS Phe213 which is functionally equivalent to Leu456 in TbMetRS but led to different protein geometry. The TbMetRS structure is shown in blue and the 2 different residues in orange.
There is an error in the caption for Fig 7. Please see the correct Fig 7 caption here.
Additionally, in Table 2, the “PDB code” value for “1433” should read “4PY2”. Please view the corrected Table 2 here.
Table 2. Data collection and model refinement statistics.
| Crystal | SeMet | 1312 | 1415 | 1433 |
|---|---|---|---|---|
| PDB code | 4DLP | 5K0S | 5K0T | 4PY2 |
| Data collection | ||||
| Space Group | P 1 21 1 | P 1 | P 1 | P 1 |
| Cell dimensions | ||||
| a, b, c (Å) | 116.25, 77.62, 116.27 | 45.27, 99.74, 104.63 | 45.16, 99.65, 104.30 | 45.01, 99.48, 104.00 |
| Α, β, γ (°) | 90, 119.67, 90 | 110.58, 87.63, 99.91 | 110.46, 88.09, 99.72 | 110.47, 87.24, 99.99 |
| Resolution range (Å) | 50.00–2.65 (2.72–2.65) | 50.00–2.40 (2.46–2.40) | 50.00–2.60 (2.67–2.60) | 50.00–2.15 (2.21–2.15) |
| No. of unique reflections | 52379 | 63652 | 49660 | 88924 |
| Rmerge (%)a | 7.1 (48.6) | 6.4 (52.5) | 7.5 (47.0) | 6.6 (53.6) |
| Redudancy a | 3.7 (3.7) | 2.4 (2.4) | 2.4 (2.4) | 3.9 (4.0) |
| Completeness (%)a | 99.3 (99.5) | 96.3 (85.2) | 96.0 (97.5) | 98.2 (97.3) |
| l/σIa | 15.21 (2.63) | 11.43 (2.13) | 10.12 (2.07) | 15.76 (2.73) |
| Refinement | ||||
| Resolution range | 50.00–2.65 (2.72–2.65) | 50.00–2.40 (2.46–2.40) | 50.00–2.60 (2.67–2.60) | 50.00–2.15 (2.21–2.15) |
| No. of protein atoms | 10934 | 11469 | 11189 | 11480 |
| No. of water molecules | 88 | 219 | 169 | 135 |
| Rcryst (%) | 19.7 | 21.0 | 25.6 | 17.8 |
| Rfree (%) | 23.7 | 25.6 | 28.6 | 21.1 |
| Root-mean-square deviations from ideal stereochemistry | ||||
| Bond lengths (Å) | 0.012 | 0.003 | 0.008 | 0.011 |
| Bond angles (°) | 1.421 | 0.577 | 1.183 | 1.384 |
| Mean B factor (all atoms) (Å2) | 48.25 | 43.29 | 49.76 | 35.98 |
| Ramachandran plot | ||||
| Favored region (%) | 96.87 | 98.77 | 98.67 | 97.43 |
| Allowed regions (%) | 3.13 | 1.23 | 1.33 | 2.57 |
| Outlier regions (%) | 0.00 | 0.00 | 0.00 | 0.00 |
| Clashscore | 2.3 | 2.5 | 0.46 | 0.79 |
| Molprobity Score | 1.18 | 1.15 | 0.74 | 0.75 |
Reference
- 1.Ojo KK, Ranade RM, Zhang Z, Dranow DM, Myers JB, Choi R, et al. (2016) Brucella melitensis Methionyl-tRNA-Synthetase (MetRS), a Potential Drug Target for Brucellosis. PLoS ONE 11(8): e0160350 doi: 10.1371/journal.pone.0160350 [DOI] [PMC free article] [PubMed] [Google Scholar]


