

Abstract
The mechanisms behind the development of hepatic encephalopathy (HE) are unclear although hyperammonemia and systemic inflammation through gut dysbiosis have been proposed.
Aim
Define the individual contribution of hyperammonemia and systemic inflammation on neuro-inflammation in cirrhosis using germ-free (GF) and conventional mice.
Methods
GF and conventional C57BL/6 mice were made cirrhotic using CCl4 gavage. These were compared to their non-cirrhotic counterparts. Intestinal microbiota, systemic and neuro-inflammation (including microglial and glial activation), serum ammonia, intestinal glutaminase activity and cecal glutamine content were compared between groups.
Results
GF-cirrhotic mice developed similar cirrhotic changes to the conventional mice after four extra weeks (16 vs. 12 weeks) of CCL4 gavage. GF-cirrhotic mice exhibited higher ammonia compared to the GF controls but this was not associated with systemic or neuro-inflammation. Ammonia was generated through increased small intestinal glutaminase activity with concomitantly reduced intestinal glutamine levels. However, conventional cirrhotic mice had intestinal dysbiosis as well as systemic inflammation, associated with increased serum ammonia compared to conventional controls. This was associated with neuro-inflammation and glial/microglial activation. Correlation network analysis in conventional mice showed significant linkages between systemic/neuro-inflammation, intestinal microbiota and ammonia. Specifically beneficial, autochthonous taxa were negatively linked with brain and systemic inflammation, ammonia and with Staphylococcaceae, Lactobacillaceae and Streptococcaceae. Enterobacteriaceae were positively linked with serum inflammatory cytokines
Conclusions
Gut microbiota changes drive the development of neuro- and systemic inflammatory responses in cirrhotic animals.
Keywords: Hepatic Encephalopathy, Ammonia, Germ-free, Systems Biology, Dysbiosis
Hepatic encephalopathy (HE) or brain dysfunction due to cirrhosis represents a major healthcare burden in subjects with cirrhosis(1). Cirrhosis is associated with dysbiosis or an altered gut microbiota that potentiates a systemic pro-inflammatory milieu(2). This inflammatory environment can potentiate neuro-inflammation and brain dysfunction in the setting of hyperammonemia(3–5). However the specific contribution of the gut microbiota towards neuro-inflammation and hyperammonemia in cirrhosis is unclear since ammonia production can also occur through intestinal glutaminase activity in germ-free (GF) animals (6). This is relevant because the majority of HE treatments act by modifying gut microbial function, while others can improve outcomes by scavenging ammonia from the systemic circulation without acting on the gut(1).
The aim of this study was to determine the role of gut microbiota in the development of experimental neuro-inflammation and hyperammonemia by inducing cirrhosis in germ-free and conventional mice.
METHODS
To study the impact of absence of microbiota on neuro-inflammatory response in cirrhosis, we created cirrhotic mice under GF and conventional conditions.
We included four groups of 10-week old C57BL/6 mice. Group 1: GF mice (n=8), Group 2: GF mice that underwent twice weekly CCL4 gavage to induce cirrhosis (n=36; see section below), Group 3: Conventional mice (n=6) and Group 4: Conventional mice that underwent CCL4 gavage to induce cirrhosis (n=6).
Creation of GF CCl4 gavage cirrhosis model
Mice were born and maintained in GF conditions in flexible film Trexler isolators at the National Gnotobiotic Rodent Resource Center (NGRRC) at UNC-Chapel Hill and were fed autoclaved mouse chow and water. Sterility was verified by fecal Gram stain and aerobic and anaerobic culture taken prior to manipulation. If any Gram stains were equivocal, sterility was verified by quantitative PCR using universal 16Sribosomal RNA primers, as per published experiences (7, 8). This was repeated for all GF mice at pre-specified intervals throughout the study.
We performed gavage of 1ml CCL4/kg twice a week for 16 weeks in thirty six GF mice. Given the uncertainty of cirrhosis development using oral CCL4 gavage in GF conditions, we performed serial sacrifices of a proportion of the group at weeks 8, 12 and 16 until fully established cirrhosis was established using an expert pathology analysis. We sacrificed 12 mice at week 8, which showed liver injury and minor fibrosis without nodules. The 12 mice sacrificed at week 12 showed early nodule formation and the decision was made to continue to the gavage till week 16 at which point, all mice developed established cirrhosis. Therefore we had 12 GF CCL4 cirrhotic mice at week 16 for analysis.
Conventional mice
All conventional mice had their own microbiota from birth. Gavage was carried out at 1ml CCL4/kg twice a week for 12 weeks for CCL4-assigned group based on our prior studies (9). Mice were followed daily for the study duration, were fed identical diets and underwent necropsy at week 12.
At necropsy, cirrhosis was confirmed using histology for both CCL4 groups (GF at week 16 and conventional at week 12) using trichrome staining associated with complete nodule formation and similar extent of injury by an experienced pathologist blinded to the groups. We harvested the liver, brain and intestinal mucosa. Microbiota analysis was performed on the intestinal mucosa (cecum, large and small intestines) using MTPS for the conventional mice groups and also to reconfirm the germ-free status of the GF groups. UNIFRAC, LEFSe and PiCRUST analyses were performed and the groups were compared.
Analysis of microbiota
Microbiota
Stool was collected and DNA extracted using published techniques(10). We first used Length Heterogeneity PCR (LH-PCR) fingerprinting of the 16S rRNA to rapidly survey our samples and standardize the community amplification. We then interrogated the microbial taxa associated using Multitag Pyrosequencing (MTPS) (11). This technique allows the rapid sequencing of multiple samples at one time.
Microbiome Community Fingerprinting
About 10 ng of extracted DNA was amplified by PCR using a fluorescently labeled forward primer 27F (5′-(6FAM) AGAGTTTGATCCTGGCTCA G-3′) and unlabeled reverse primer 355R’ (5′-GCTGCCTCCCGTAGGAGT-3′). Both primers are universal primers for bacteria. The LH-PCR products were diluted according to their intensity on agarose gel electrophoresis and mixed with ILS-600 size standards (Promega) and HiDi Formamide (Applied Biosystems, Foster City, CA). The diluted samples were then separated on a ABI 3130xl fluorescent capillary sequencer (Applied Biosystems, Foster City, CA) and processed using the Genemapper™ software package (Applied Biosystems, Foster City, CA). Normalized peak areas were calculated using a custom PERL script and operational taxonomic units (OTUs) constituting less than 1% of the total community from each sample were eliminated from the analysis to remove the variable low abundance components within the communities.
MTPS(11)
Specifically, we have generated a set of 96 emulsion PCR fusion primers that contain the 454 emulsion PCR linkers on the 27F and 355R primers and a different 8 base “barcode” between the A adapter and 27F primer. Thus, each fecal sample was amplified with unique bar-coded forward 16S rRNA primers and then up to 96 samples were pooled and subjected to emulsion PCR and pyrosequenced using a GS-FLX pyrosequencer (Roche). Data from each pooled sample were “deconvoluted” by sorting the sequences into bins based on the barcodes using custom PERL scripts. Thus, we were able to normalize each sample by the total number of reads from each barcode. We have noted that ligating tagged primers to PCR amplicons distorts the abundances of the communities and thus it is critical to incorporate the tags during the original amplification step.
Microbiome Community Analysis
We identified the taxa present in each sample using the Bayesian analysis tool in Version 10 of the Ribosomal Database Project (RDP10, http://rdp.cme.msu.edu/)(12). The abundances of the bacterial identifications were then normalized using a custom PERL script and genera present at >1% of the community were tabulated. We chose this cutoff because of our a priori assumption that genera present in < 1% of the community vary between individuals and have minimal contribution to the functionality of that community and 2,000 reads per sample will only reliably identify community components that are greater than 1% in abundance.
QIIME analysis, LEFSe and Kruskal-Wallis tests were used to evaluate changes in overall microbial abundance (13). We also performed Metastats to evaluate changes in relative abundance between groups with correction for the false discovery rate (FDR)(14). Predicted bacterial functions were then assessed using PiCRUST (phylogenetic investigation of communities by reconstruction of unobserved states)(15).
In all groups, brain tissue was separated into cortex (Cx) and cerebellum (Cbl). Analysis was performed for mRNA of inflammatory mediators (IL-1β, MCP-1) and activation of microglia and glia (IBA-1, GFAP) using qPCR (normalized for GADPH) as well as mRNA expression of markers suggesting oligodendrocyte (MOG) and neuronal (NeuNFox) expression. Brain proteins were extracted after homogenization separately from the cortex and cerebellum. Analyses of proteins of pro-inflammatory (IL-1β, MCP-1, TNF-α) and anti-inflammatory (IL-10) cytokines was performed using ELISA. We also performed serum TNF-α and IL-1β analysis (Assaygate Inc, Ijamsville, MD) using validated techniques(10). Serum ammonia and change in ammonia levels (delta) between GF and GF-cirrhosis and conventional control and cirrhotic mice were compared. Glutaminase activity was measured using the methods of Miller et al in small and large intestine in all groups(16). LC-MS using published techniques were used to analyze cecal, small intestinal and colonic glutamine content in all four groups at the West Coast Metabolomics Center at University of California, Davis(17). Kruskal-Wallis tests were used to compare values.
Correlation network analysis
We created correlation networks using tools in the Galaxy Portal at the Microbiome Analysis Center. We only included nodes consisting of microbiota, serum, brain inflammatory markers and markers of neuronal, microglial and glial activation, which had a p value <0.01 and correlation coefficient of >0.6 or <−0.6. These networks were created conventional mice with and without cirrhosis (18) and were then visualized in Cytoscape (19).
This protocol was approved by the IACUC at University of North Carolina and VCU Medical Center.
RESULTS
All mice survived till the end of the experiment. At week 16 for GF CCl4 mice and at week 12 for conventional CCL4 mice, there was no obvious ascites, jaundice, asthenia or change in behavior on observation. On sacrifice however, there was evidence of the nodular liver, which was confirmed by histology on each mouse. Both CCL4-treated groups showed cirrhosis on sacrifice on visual and histological examination (Supplementary figures 1A and B).
Neuro-inflammation and glial/microglial activation was only seen in conventional cirrhotic mice
There was a significant increase in mRNA expression of IL-1β and MCP-1 in conventional cirrhotic mice cerebellum and IL-1β in the cortex compared to the other groups (Figures 1A/B). This was higher in both conventional groups compared to GF groups. There was significant microglial and glial activation as noted by IBA-1 and GFAP mRNA increase in conventional cirrhotics compared to other groups in the cortex and cerebellum. These findings were accompanied by a significantly higher IL-1β, TNF-α and MCP-1 protein and lower IL-10 protein levels in the brains of conventional cirrhotic mice compared to conventional controls and both GF groups. No changes regarding inflammation within the GF groups were seen. In addition, no significant alterations in NeuN/Fox-3 and MOG expression were seen between groups.
Figure 1. Ammonia and inflammation-related results.
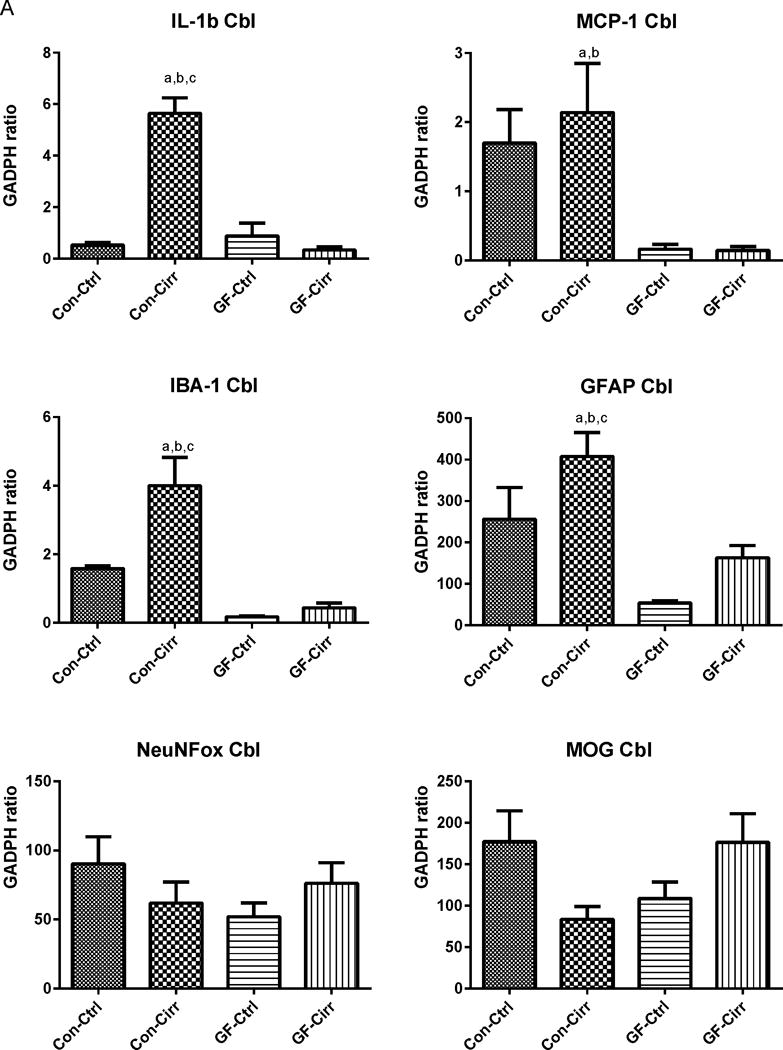
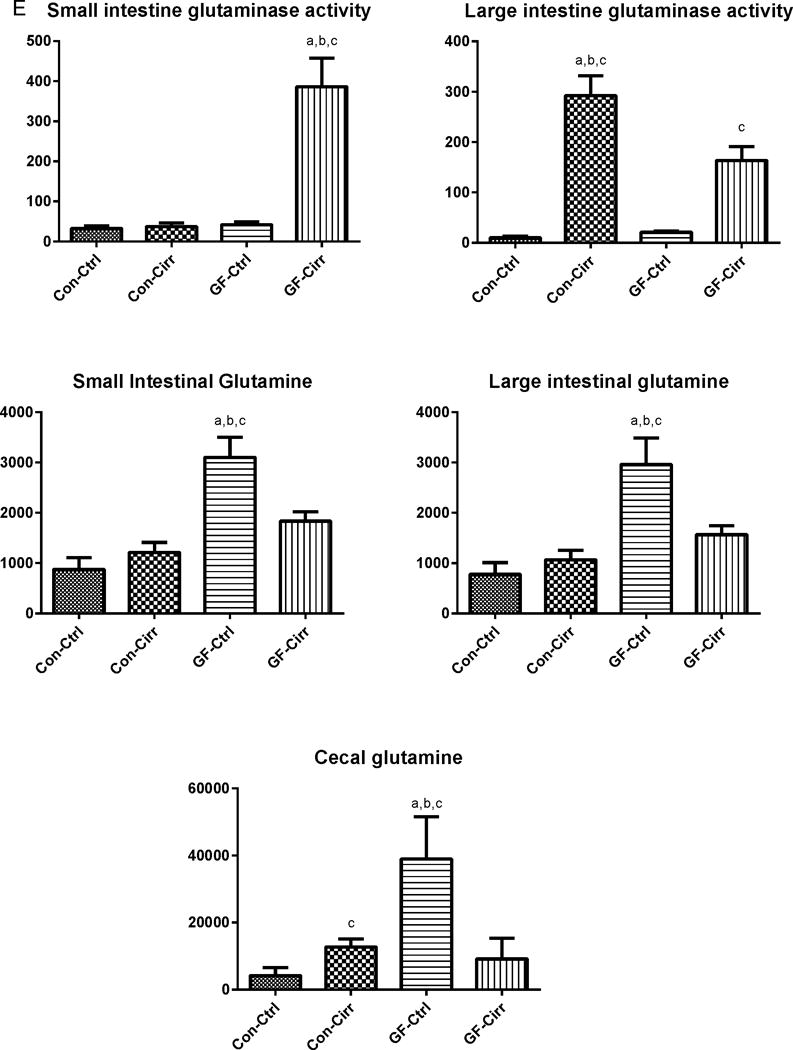
Legends common to all figures: Data is shown as mean±SEM, ap<0.05 on one-way ANOVA, bp<0.05 GF vs conventional, cp<0.05 control vs. cirrhosis within that group Con: conventional, Ctrl: control or non-cirrhotic, GF: Germ-free, Cirr: cirrhotic, Cbl: cerebellum, Cx: cerebral cortex, MCP-1: monocyte chemoattractant protein-1, GFAP: glial fibrillary acidic protein, MOG: myelin oligodendrocyte glycoprotein IBA-1: microglial ionized calcium binding adaptor molecule 1, NeuNFox: neuronal nuclei Fox3
A. Changes in mRNA expression in the mouse cerebellum: Conventional cirrhotic mice had the highest expression of IL-1b, MCP-1 along with IBA-1 and GFAP compared to other groups. Both conventional groups had higher expression of MCP-1, GFAP and IBA-1 compared to germ-free groups (p<0.002 for all comparisons). No changes within the germ-free groups were seen. No significant differences in MOG or NeuNFox were identified.
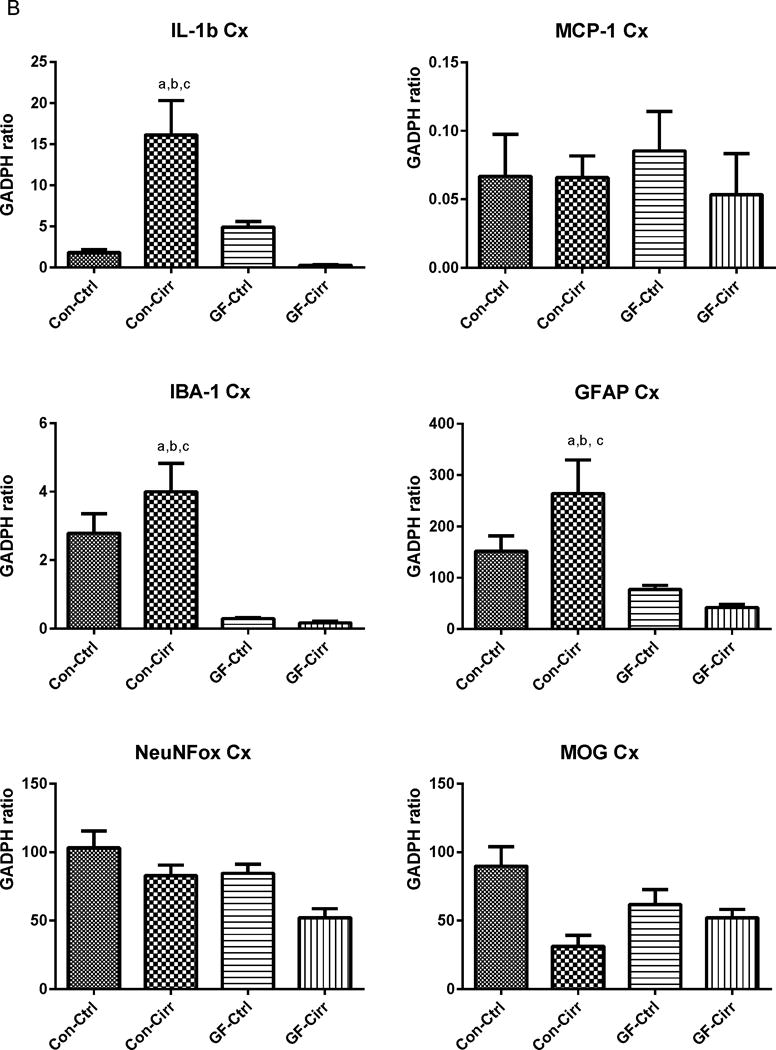
B. Changes in mRNA expression in the mouse cerebral cortex: Similar to the cerebellum, conventional cirrhotic mice had the highest expression of IL-1balong with IBA-1 and GFAP compared to other groups. Both conventional groups had higher expression of MCP-1, GFAP and IBA-1 compared to germ-free groups (p<0.005 for all comparisons). No changes within the germ-free groups were seen. No significant differences in MCP-1, MOG or NeuNFox were identified.
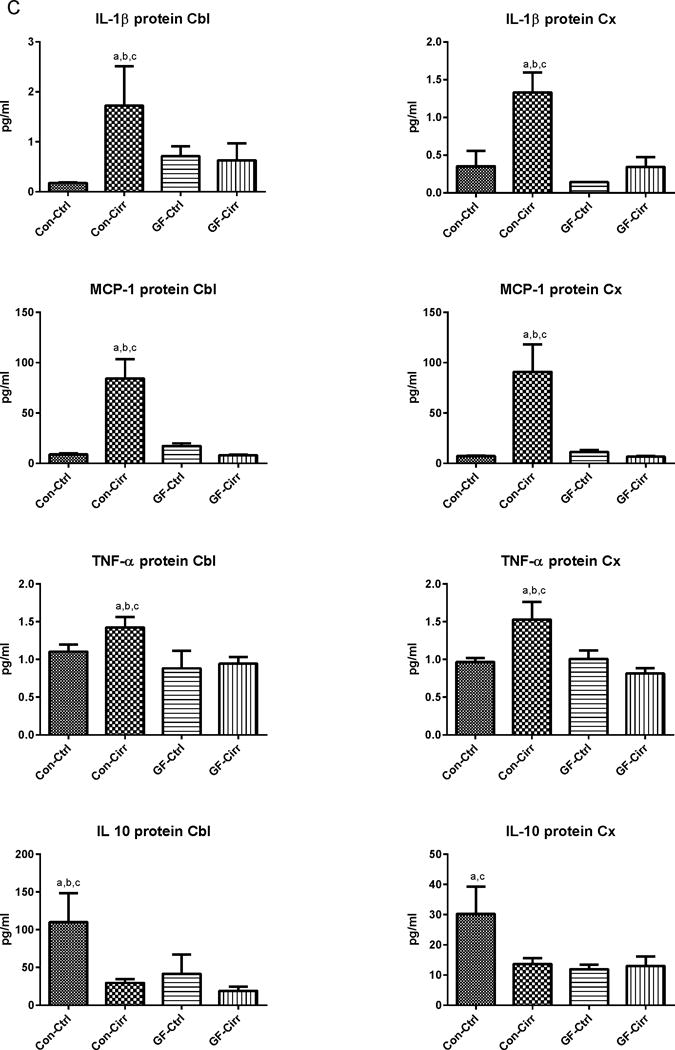
C. Changes in brain protein expression in cerebellum and cortex: Pro-inflammatory cytokines were significantly higher in the cortex and cerebellum in conv-cirr compared to others (ANOVA p<0.001 in all except TNF-α where it was p<0.03). In contrast, the anti-inflammatory cytokine IL-10 was the highest in conventional controls and reduced with the development of cirrhosis. All cytokines (pro and anti-inflammatory) were significantly higher in conventional compared to GF mice. No differences within GF and GF-cirr mice were seen while apart from cortical IL-10, all conv-cirr mice had significantly different cytokine expression compared to their respective controls.
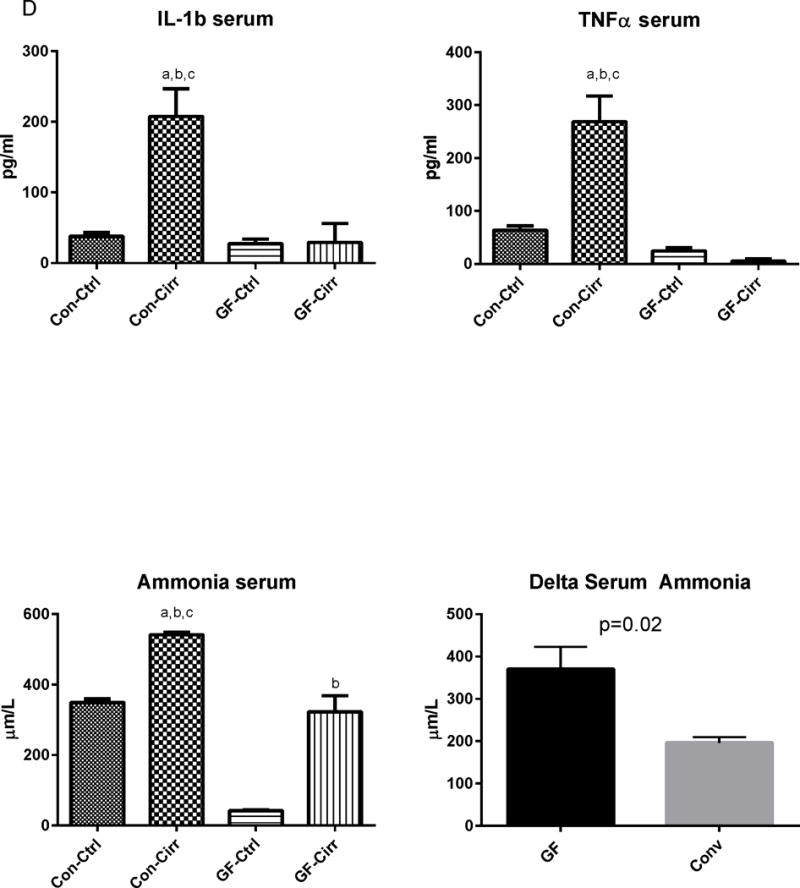
D. Changes in serum markers: A significant increase in serum IL-1b and TNF-α were seen in conventional cirrhotic mice compared to other groups. Serum ammonia was the lowest in germ-free controls and highest in conventional cirrhotics. Serum ammonia levels were significantly higher in GF-cirr compared to GF (p<0.0001), in conv-cirr compared to GF-cirr (p=0.002), and in conv-cirr compared to conv-control (p<0.001). Delta ammonia was significantly higher in GF mice compared to conventional mice (p=0.02).
E. Changes in glutaminase activity and glutamine content: A significantly increased glutaminase activity was seen in the small intestine of GF-cirr mice (p<0.003) compared to the other groups. In the large intestine, both cirrhotic groups had significantly higher glutaminase activity compared to non-cirrhotic ones (p<0.001). Conv-cirr had a significantly higher large intestinal glutaminase activity compared to GF-cirr (p=0.03). Glutamine content was highest in GF-control mice which reduced significantly after development of cirrhosis (p=0.01). In contrast, cecal glutamine increased after cirrhosis development in conventional mice (p=0.02). In the small intestine and large intestine, the highest glutamine was again seen in conventional mice compared to the rest (p=0.005 small and p=0.002 large intestine). This was also higher compared to conventional groups (p=0.01 in both intestinal contents) and in GF-cirrhotic compared to control mice (p<0.001 in both intestinal contents). There was no significant difference in glutamine content of small and large intestines between the two conventional groups.
Systemic inflammation and ammonia were discordant in GF compared to conventional cirrhotic mice
There were significantly higher serum levels of IL-1β and TNF-α in conventional cirrhotic mice compared to the other groups and in all conventional groups compared to the GF ones. On the other hand, ammonia levels were the lowest in GF control mice and highest in conventional cirrhotic mice. Ammonia levels in conventional cirrhotic mice were significantly higher than in conventional control and in GF-cirrhotic mice. GF cirrhotic mice had a higher ammonia level than their GF control counterparts. Conventional controls were much higher than GF controls (Figure 1C). Although absolute ammonia levels between GF-cirrhosis and conventional control were similar, there was a significantly higher increase in ammonia levels in the GF group after cirrhosis development compared to the conventional group (delta ammonia 402±51.1 in GF vs 196.5±13.6 μm/L in conventional mice).
To identify potential sources of ammonia production, glutaminase activity was studied in the small and large bowel linings. In GF cirrhotic mice compared to GF controls there was a significant increase in small and large intestinal glutaminase activity. When conventional cirrhotic mice were compared to conventional control mice, there was a significant increase in large bowel glutaminase activity in cirrhotic mice but no change in small bowel activity was observed. When all four groups were evaluated, the highest small bowel glutaminase activity was seen in GF cirrhotic mice. The large intestinal glutaminase activity was higher in both cirrhotic groups (highest in conventional cirrhotic mice) compared to non-cirrhotic ones and within the cirrhotic mice, was higher in conventional cirrhotic ones (Figure 1D). Cecal glutamine content was the highest in GF mice, which got significantly lower with development of cirrhosis (Figure 1E). On the other hand, the glutamine content in the conventional cirrhotic mouse group was higher than that of controls.
Conventional cirrhotic mice showed dysbiosis and altered predicted microbial functionality, which was linked with systemic and neuro-inflammation
When microbiota were compared between the two conventional mouse groups, there was a significant difference in composition on UNIFRAC at the small intestine, cecum and large intestine level (all p values <=1.0e−02) in cirrhotic mice compared to controls. There were specific bacterial changes related to families (Figure 2) in these tissues. There was a significantly lower relative abundance of autochthonous families (Lachnospiraceae, Ruminococcaceae and Clostridiales XIV, Bifidobacteriaceae) and higher Staphylococcaceae, Enterobacteriaceae and Lactobacillaceae in large intestinal and cecal lining in stool of cirrhotic mice compared to control conventional mice (Figure 2A and B). Small intestinal lining changes showed relative increases in Enterobacteriaceae and Staphylococcaceae along with predominantly oral families such as Streptococcaceae in cirrhotic mice (Figure 2C). On PiCRUST, predicted functions related to endotoxin and endotoxin-related protein production with changes towards reduced branched chain and higher aromatic amino acids in large intestine and cecum of cirrhotic mice, while in the small intestine a higher functionality related to bacterial invasion of epithelial cells was demonstrated in cirrhotic mice (Supplementary figures 2C–E). While control mice microbiota had functions predicted towards synthesis of aromatic amino acids, the cirrhotic functionality was towards their degradation, which is associated with HE.
Figure 2. Microbial composition changes between conventional control mice compared to those with CCL4-induced cirrhosis.
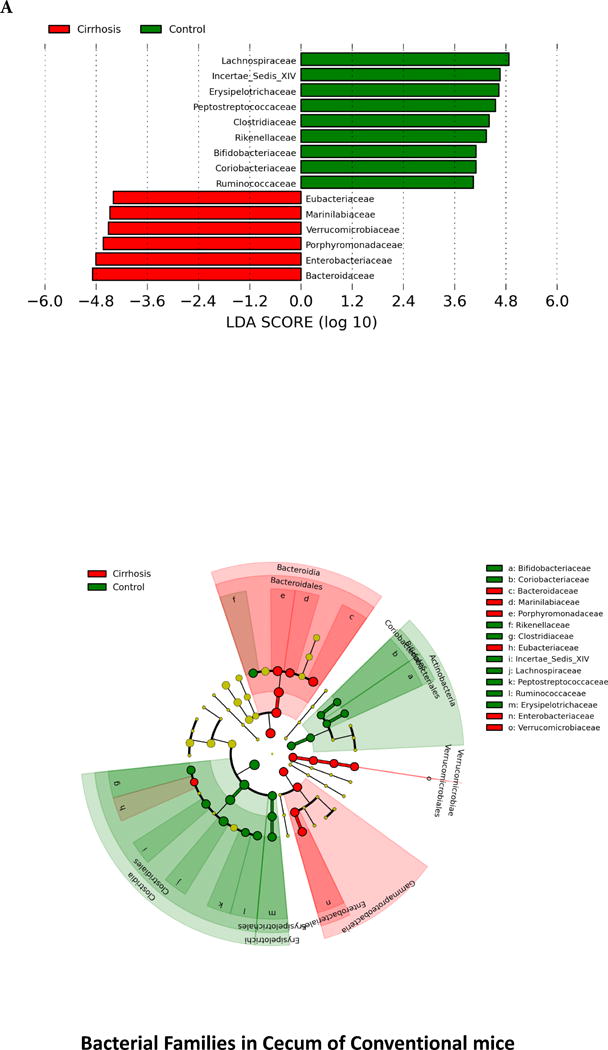
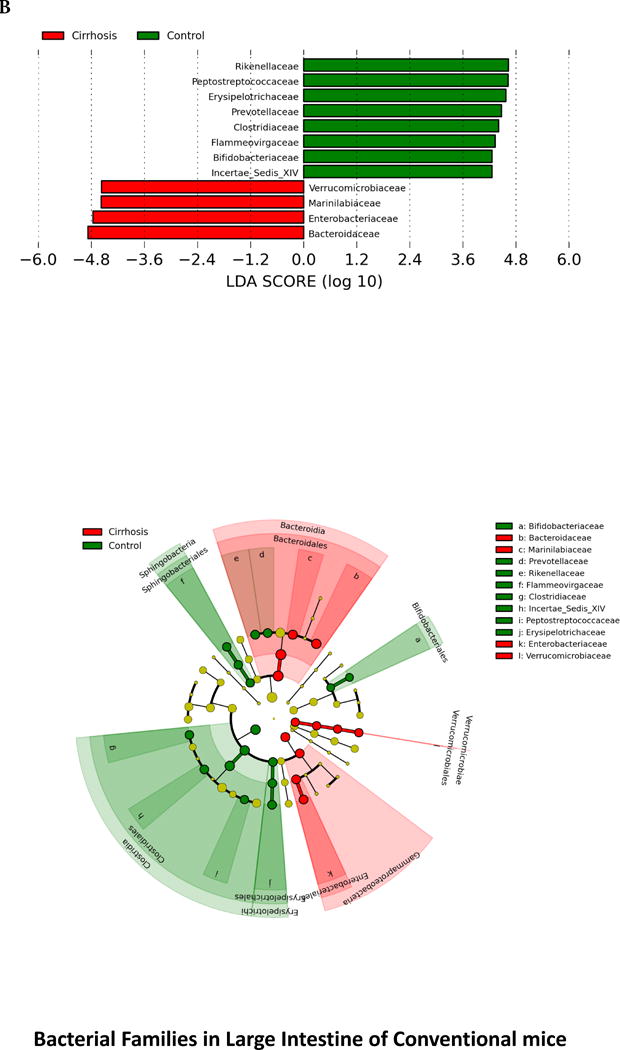
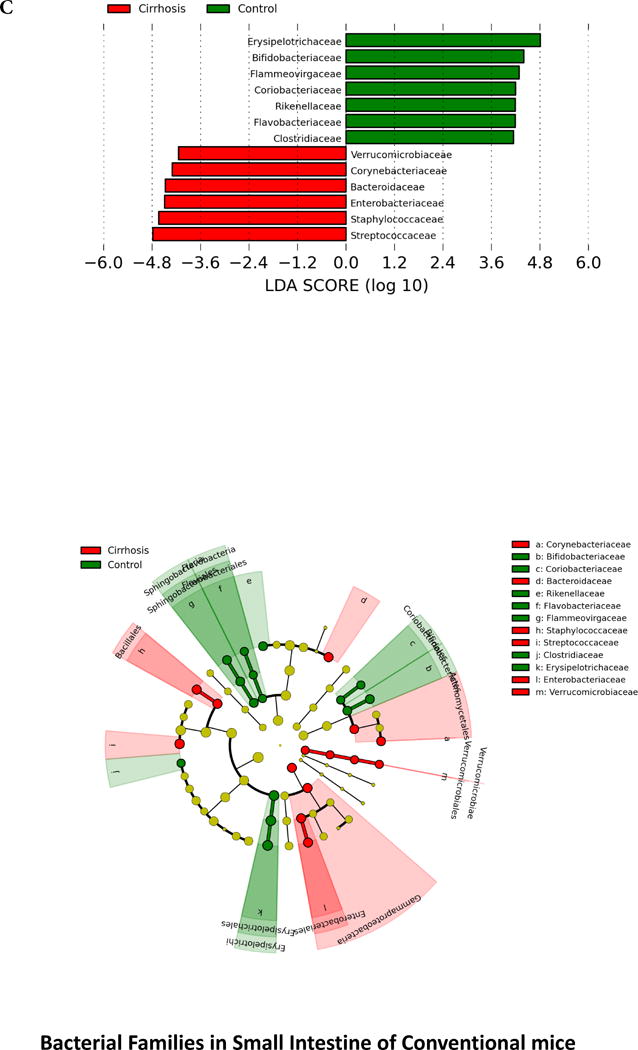
Legend common to all sub-parts: LEfSe predictions for bacterial families. LDA score represents log changes in relative bacterial family representation. The cladogram shows the phylogenetic relationship between the bacterial families. LDA, linear discriminant analysis, red=cirrhotic mice, green=control mice
2A. LEfSe predictions for bacterial families found in Cecum
2B. LEfSe predictions for bacterial families found in large intestine
2C. LEfSe predictions for bacterial families found in small intestine
There were strong negative linkages between conventional mouse intestinal microbiota autochthonous bacterial families and ammonia, systemic inflammation and brain inflammatory markers (Figure 3 A–F). This was similar in cirrhotic and non-cirrhotic mice underlining the inherent beneficial nature of these taxa. On the other hand, specific families such as Staphylococcaceae, Lactobacillaceae and Streptococcaceae were negatively correlated with autochthonous taxa and Enterobacteriaceae were positively linked with systemic inflammation as manifested by inflammatory cytokines.
Figure 3. Correlation networks between microbiota, systemic and neuro-inflammatory markers in conventional mice.
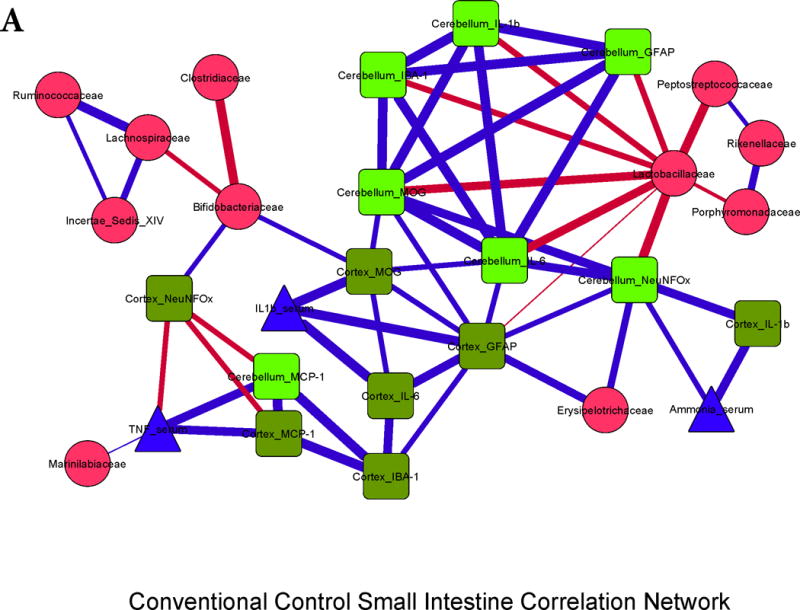
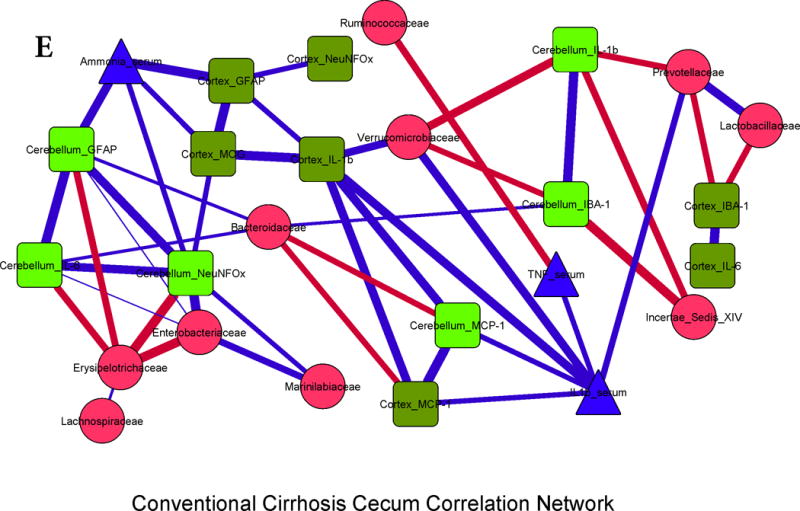
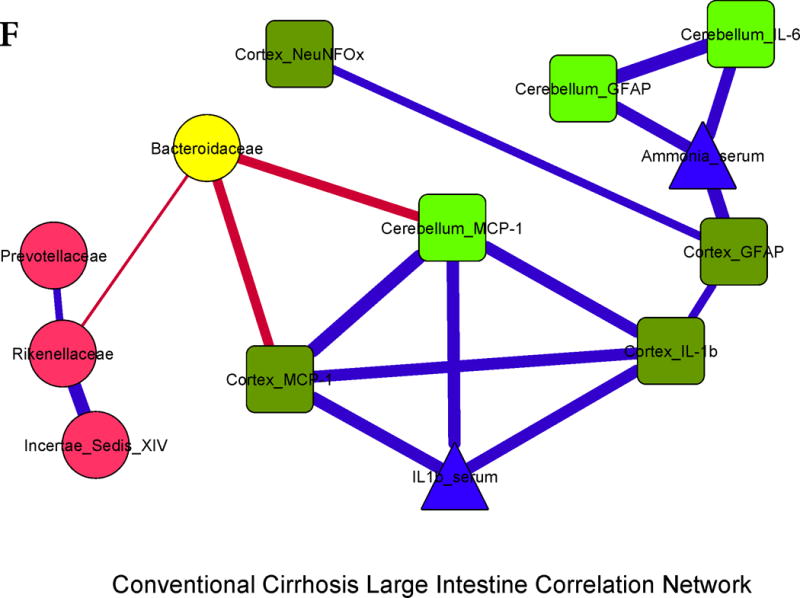
Legends common to all sub-parts:
Red nodes: stool bacterial families, light green: cerebellar markers, dark green: cortical markers, blue nodes: serum results. MCP-1: monocyte chemoattractant protein-1, GFAP: glial fibrillary acidic protein, MOG: myelin oligodendrocyte glycoprotein IBA-1: microglial ionized calcium binding adaptor molecule 1, NeuNFox: neuronal nuclei Fox3
In all correlation networks, blue lines joining nodes represent positive correlations between those nodes while red lines indicate negative correlations. All correlations represented are significant at p<0.01 with a correlation coefficient of r>0.6 or <−0.6. Thick correlation lines indicate p<0.001 while thin lines indicate p values between 0.01 and 0.001.
3A. Control small intestine: Cerebellar and cortical inflammatory markers were positively correlated with glial, microglial, oligodendrocyte and neuronal markers as well as with systemic inflammatory cytokines. These markers were negatively correlated with Lactobacillaceae and positively with Erysipelothricaceae. Ammonia was positively correlated with cortical IL-1β.
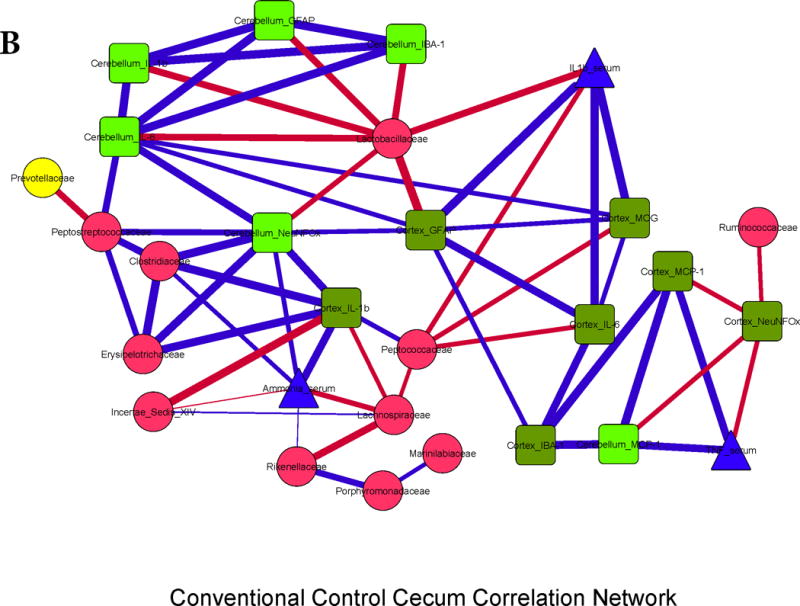
3B. Control cecum: Similar to the small intestine, brain markers were positively linked to each other, to serum ammonia and peripheral inflammatory cytokines. Brain inflammatory cytokines and neuronal markers, and ammonia were negatively linked with autochthonous bacterial families (Lactobacillaceae, Ruminococcaceae, Lachnospiraceae and Clostridiales XIV) and positively with Erysipelothricaceae and Clostridiaceae.
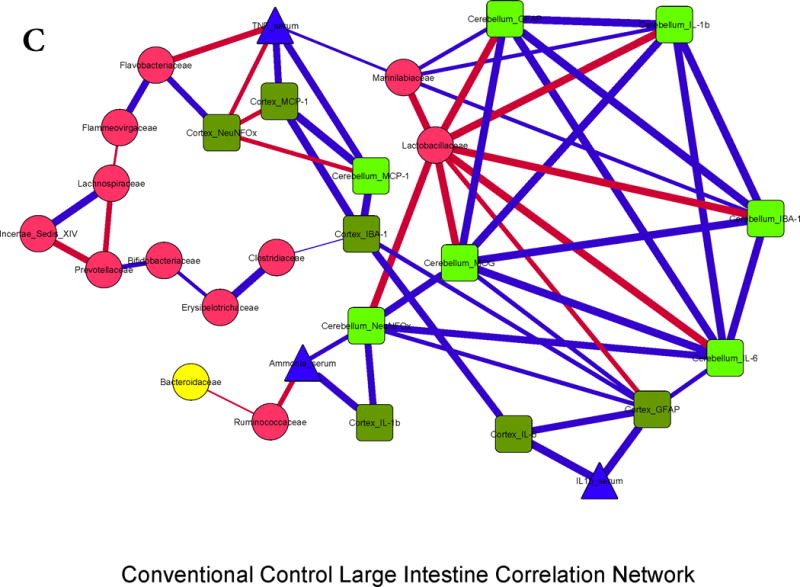
3C. Control large intestine: Similar trends to the small intestine and cecum were seen with regards to inter-relationship between brain activation and inflammatory markers with serum inflammation and ammonia. Also the negative relationship between autochthonous bacteria (Lactobacillaceae and Ruminococcacae) with ammonia and brain markers of inflammation, microglial and glial activation was again seen.
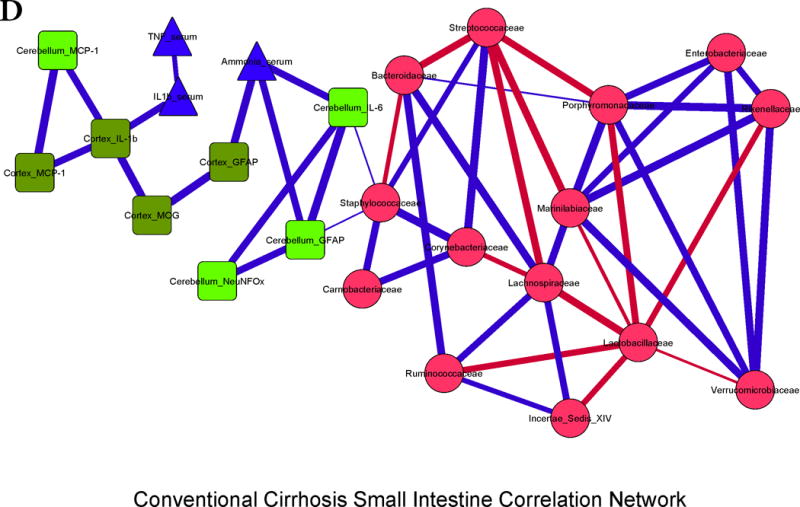
3D. Cirrhosis small intestine: There was a positive correlation between ammonia and brain inflammation and glial activation markers. Brain inflammation was linked with serum inflammatory cytokines and with Staphylococcaceae. Lactobacillaceae and Streptococcaceae were negatively linked with autochthonous bacterial families and positively with Staphylococcaceae, while Porphyromonadaceae, Enterobacteriaceae and Rikenellaceae were positively linked with each other.
3E. Cirrhosis cecum: Positive linkages within brain inflammatory markers, ammonia and serum inflammation were seen. Autochthonous bacteria (Ruminococcaceae, Clostriales XIV) and Bacteroidaceae, Erysipelothriaceae, were negatively linked with systemic and cerebellar inflammation, while Enterobacteriaceae were positively correlated.
3F. Cirrhosis large intestine: Similar inter-relationships between brain inflammatory markers and serum inflammation and ammonia were found. Similar to the cecal findings, Bacteroidaceae were negatively correlated with brain inflammation.
No microbial DNA was isolated from any tissues in both GF groups.
DISCUSSION
The relative contribution of the gut microbiota towards the cognitive dysfunction is not completely understood. While therapies for HE are overwhelmingly gut-based, there is often an additive role for synergistic, systemic ammonia-scavenging treatments in humans(1). There is patho-physiologic evidence supporting both hyperammonemia and inflammation in the causation of HE(20, 21). Specifically the inducement of hyperammonemia in cirrhotic patients greatly increases systemic inflammation and the development of neuro-psychological abnormalities(3). We found that increased ammonia levels in GF cirrhotic mice, due to an activated small bowel glutaminase activity, did not result in systemic inflammation, glial or microglial activation and neuro-inflammation, while similar conditions in conventional mice resulted in higher ammonia along with systemic and neuro-inflammation that was correlated with gut microbiota.
It has been hypothesized that in humans the dysbiotic gut microbiota is the major source of both ammonia and the systemic pro-inflammatory milieu(22). Specifically with the progression of cirrhosis, the relative reduction in autochthonous commensals and the increase in microbiota such as those belonging to Enterobacteriaceae and Streptococcaceae that can produce endotoxin and ammonia through their urease activity respectively(23). This dichotomy between ammonia and systemic inflammation in the pathogenesis of cirrhosis-associated neuro-inflammation was tested in GF and conventional mice that were made cirrhotic through toxic CCL4 injury. GF cirrhotic mice demonstrated an increase in ammonia compared to GF-controls to increased small bowel glutaminase activity that did not result in systemic or neuro-inflammation and did not engender microglial or glial activation. This was in contrast with the conventional CCL4 cirrhosis models that demonstrated not only increase in relative ammonia levels, but also systemic inflammation that was associated with cerebellar and cortical inflammation and microglial and glial activation. Moreover, we found that conventional control mice have higher anti-inflammatory cytokines (IL-10) in the brain, which significantly decreases after dysbiosis sets in after cirrhosis, and is not found with or without cirrhosis in GF animals.
Glutaminase activity was highest in the conventional cirrhosis group in the large intestine, which usually has the highest bacterial abundance and not the small intestine in contrast to the GF cirrhosis group where small intestinal glutaminase expression predominated. Glutaminase polymorphisms have been shown to impact the occurrence of HE in humans and certainly have a role in the modulation of nitrogen metabolism at the intestinal level(6). However, the mechanism behind this increase in small intestinal glutaminase activity in GF cirrhosis is unclear. The ammonia generation from this differential activation is evident by the significantly lower small intestinal, cecal and large intestinal glutamine in GF-cirrhotic mice corroborating the increased intestinal glutaminase activity. In contrast there was little change in intestinal glutamine contents in conventional cirrhotic mice reflecting the lack of change in glutaminase activity. Studies have shown that the small intestine can be a source of ammonia that is equivalent to the colon(24) and is proportional to the glutamine uptake. However, we found that despite a higher cecal glutamine content and an activity pattern of small intestinal glutaminase that was equivalent to the non-cirrhotic mice, that serum ammonia was the highest in conventional cirrhotic mice. This indicates that in the presence of microbiota, it is likely that the relative contribution of intestinal glutaminase activity towards hyperammonemia is modest. This is in contrast to the GF state where small intestinal glutaminase activity largely determines the serum ammonia levels. Therefore, it is likely that in the presence of microbiota, alternative sources of gut ammonia generation such as degradation of amino acids other than glutamine could predominate. This is also borne out by predicted bacterial functionality differences between conventional control and cirrhotic mice that does not show glutamine metabolism as a major differentiator between groups. Given the same chow and lack of asthenic changes between the groups, it is unlikely the amount of glutamine consumed could explain these differential changes. Proximal intestinal and gastric glutamine contents, which were not available in this study, could have increased our insight into the overall glutamine consumption. Ultimately, glutaminase activity is an important source of ammonia production, whose relative importance may be tempered in the presence of microbiota.
The significant gut dysbiosis in the conventional cirrhotic mice compared to conventional controls mirrors recent animal studies(25). Moreover, this dysbiosis that exists in cirrhotic mice is similar to that seen in humans with cirrhosis(26). In prior studies using thioacetamide-treated (TAA) conventional mice, a specific microbial mixture or specifically engineered probiotics with sustained low ammoniagenesis were able to improve cognition and mortality respectively(27). However, the question of synergistic hyperammonemia and inflammation in cirrhotic mice was left open. Unlike the TAA model, the CCL4 model does not reliably develop visible neuro-behavioral changes nor is associated with early mortality. However, this model remains useful to study brain mRNA expression and the impact of liver fibrosis over a relatively longer time period(28). Therefore, our animals were not specifically tested for neuro-behavioral changes and brain inflammation was used as a corollary. This is the first report of an oral gavage producing CCl4 cirrhosis in GF mice. In contrast with the intra-peritoneally injected CCL4 GF cirrhosis model in which greater liver injury was achieved in GF compared to conventional mice(29), we found that the oral gavage required four extra weeks for generation of complete cirrhosis compared to the conventional mice. This could reflect a potential requirement for microbial modulation of CCL4 to be absorbed and cause liver injury when given orally, unlike intra-peritoneal injections, in which CCl4 has already crossed the intestinal barrier. These findings could also reflect the absence of endotoxin and other TLR ligands in GF conditions, which would otherwise increase intestinal permeability and perpetuate liver injury and disease progression in conventional mice. We did not use the bile-duct ligation model due to the impact of biliary diversion on intestinal microbiota that does not reflect changes seen in cirrhosis that is not related to severe cholestasis(25, 30). A few prior studies have evaluated the impact of hyperammonemia in GF animals; one was a type A HE study in which hepatectomy in GF rats induced hyperammonemia similar to conventional ones(31), while others are GF dog Eck fistula studies of type B HE(32). However both these models of type A and B HE are not reflective of type C or cirrhosis-associated HE which has both liver insufficiency and shunting(28).
While the ideal model for type C HE is lacking, the current CCL4 model findings show concordance with prior published human data with respect to the mouse correlation networks(33). This is specifically in the linkages between autochthonous bacteria, Enterobacteriaceae, ammonia and neuro/systemic inflammation. Stool microbial predicted functionality showed a significant increase in pathways related to both inflammatory (endotoxin/endotoxin-protein synthesis) and ammoniagenic functionality (higher branched chain amino acid degradation and metabolism of aromatic amino acids) in conventional cirrhotic mice large intestinal and cecal bacteria also showed a similar change related to endotoxin and ammoniagenic amino acid functions compared to control conventional mice(34). However, in the mouse small intestine, the focus was towards the bacterial invasion of epithelial cells with a similar pattern of aromatic/branched-chain amino acid functionality but not endotoxin-related functions. This is could be due to the significantly larger bacterial and hence Gram-negative population in the large intestinal and cecal microbiota compared to those of the small intestine.
Interestingly, Lactobacillaceae, which in control mice appeared beneficial, i.e. negatively associated with neuro-inflammation, reversed their associations in cirrhotic mice on correlation network analysis. This was corroborated with an increased relative abundance of Lactobacillaceae in human stool of HE patients in prior studies(33). It was assumed in past human studies that the increased Lactobacillaceae abundance was due to the use of lactulose for HE therapy, which was not fed to the mice(35). However, our prior and current human results and prior animal CCL4 studies demonstrate that Lactobacillaceae increase may be a part of an expansion of selected urease-producing Firmicutes in humans and mouse cirrhosis models(2, 25, 36). An increased cerebral lactate, which has now been hypothesized to be synergistic with glutamine for HE development in some animal models, could also be precipitated by Lactobacillaceae spp(37). This seems to be in contrast with the use of members of Lactobacillaceae as probiotics but this is a large family of bacteria, from which it is possible that some members could be actually pro-inflammatory in their impact(33).
We conclude that a dysbiotic profile of gut microbiota may be required for the development of systemic inflammation and neuro-inflammation in cirrhosis with or without an increase in ammonia levels. Specific alterations, which provide potential novel therapeutic targets to restore intestinal and neuronal homeostasis, in the gut microbial milieu could impact different aspects of brain function in cirrhotic individuals.
Supplementary Material
Acknowledgments
Funding for this study was partly using grants from NIDDK Grant R01DK089713, VA Merit Review grant CX10076, and the McGuire Research Institute (JSB), while the NGRRC is supported by grant numbers 5-P30-DK034987 and 5-P40-OD010995 (RBS).
Abbreviations
- HE
hepatic encephalopathy
- GF
Germ-free
- LH-PCR
Length Heterogeneity PCR
- MTPS
Multitag Pyrosequencing
- PiCRUST
phylogenetic investigation of communities by reconstruction of unobserved states
- LEFSe
Linear discriminant analysis effect size
- MCP-1
monocyte chemoattractant protein-1
- GFAP
glial fibrillary acidic protein
- MOG
myelin oligodendrocyte glycoprotein
- IBA-1
microglial ionized calcium binding adaptor molecule 1
- NeuNFox
neuronal nuclei Fox3
- CCL4
carbon tetrachloride
- TAA
thioacetamide-treated
Footnotes
No competing interests exist for any author.
References
- 1.Vilstrup H, Amodio P, Bajaj J, Cordoba J, Ferenci P, Mullen KD, Weissenborn K, et al. Hepatic encephalopathy in chronic liver disease: 2014 Practice Guideline by the American Association for the Study of Liver Diseases and the European Association for the Study of the Liver. Hepatology. 2014;60:715–735. doi: 10.1002/hep.27210. [DOI] [PubMed] [Google Scholar]
- 2.Bajaj JS, Heuman DM, Hylemon PB, Sanyal AJ, White MB, Monteith P, Noble NA, et al. Altered profile of human gut microbiome is associated with cirrhosis and its complications. J Hepatol. 2014;60:940–947. doi: 10.1016/j.jhep.2013.12.019. [DOI] [PMC free article] [PubMed] [Google Scholar]
- 3.Shawcross DL, Davies NA, Williams R, Jalan R. Systemic inflammatory response exacerbates the neuropsychological effects of induced hyperammonemia in cirrhosis. J Hepatol. 2004;40:247–254. doi: 10.1016/j.jhep.2003.10.016. [DOI] [PubMed] [Google Scholar]
- 4.Romero-Gomez M, Jover M, Galan JJ, Ruiz A. Gut ammonia production and its modulation. Metab Brain Dis. 2009;24:147–157. doi: 10.1007/s11011-008-9124-3. [DOI] [PubMed] [Google Scholar]
- 5.Tenorio-Laranga J, Montoliu C, Urios A, Hernandez-Rabaza V, Ahabrach H, Garcia-Horsman JA, Felipo V. The expression levels of prolyl oligopeptidase responds not only to neuroinflammation but also to systemic inflammation upon liver failure in rat models and cirrhotic patients. J Neuroinflammation. 2015;12:183. doi: 10.1186/s12974-015-0404-7. [DOI] [PMC free article] [PubMed] [Google Scholar]
- 6.Romero-Gomez M. Role of phosphate-activated glutaminase in the pathogenesis of hepatic encephalopathy. Metab Brain Dis. 2005;20:319–325. doi: 10.1007/s11011-005-7913-5. [DOI] [PubMed] [Google Scholar]
- 7.Maharshak N, Packey CD, Ellermann M, Manick S, Siddle JP, Huh EY, Plevy S, et al. Altered enteric microbiota ecology in interleukin 10-deficient mice during development and progression of intestinal inflammation. Gut Microbes. 2013;4:316–324. doi: 10.4161/gmic.25486. [DOI] [PMC free article] [PubMed] [Google Scholar]
- 8.Packey CD, Shanahan MT, Manick S, Bower MA, Ellermann M, Tonkonogy SL, Carroll IM, et al. Molecular detection of bacterial contamination in gnotobiotic rodent units. Gut Microbes. 2013;4:361–370. doi: 10.4161/gmic.25824. [DOI] [PMC free article] [PubMed] [Google Scholar]
- 9.Carl DE, Ghosh SS, Gehr TW, Abbate A, Toldo S, Sanyal AJ. A model of acute kidney injury in mice with cirrhosis and infection. Liver Int. 2015 doi: 10.1111/liv.13023. [DOI] [PubMed] [Google Scholar]
- 10.Bajaj JS, Hylemon PB, Ridlon JM, Heuman DM, Daita K, White MB, Monteith P, et al. Colonic mucosal microbiome differs from stool microbiome in cirrhosis and hepatic encephalopathy and is linked to cognition and inflammation. Am J Physiol Gastrointest Liver Physiol. 2012;303:G675–685. doi: 10.1152/ajpgi.00152.2012. [DOI] [PMC free article] [PubMed] [Google Scholar]
- 11.Gillevet P, Sikaroodi M, Keshavarzian A, Mutlu EA. Quantitative assessment of the human gut microbiome using multitag pyrosequencing. Chem Biodivers. 2010;7:1065–1075. doi: 10.1002/cbdv.200900322. [DOI] [PMC free article] [PubMed] [Google Scholar]
- 12.Cole JR, Wang Q, Fish JA, Chai B, McGarrell DM, Sun Y, Brown CT, et al. Ribosomal Database Project: data and tools for high throughput rRNA analysis. Nucleic Acids Res. 2014;42:D633–642. doi: 10.1093/nar/gkt1244. [DOI] [PMC free article] [PubMed] [Google Scholar]
- 13.Segata N, Izard J, Waldron L, Gevers D, Miropolsky L, Garrett WS, Huttenhower C. Metagenomic biomarker discovery and explanation. Genome Biol. 2011;12:R60. doi: 10.1186/gb-2011-12-6-r60. [DOI] [PMC free article] [PubMed] [Google Scholar]
- 14.White JR, Nagarajan N, Pop M. Statistical methods for detecting differentially abundant features in clinical metagenomic samples. PLoS Comput Biol. 2009;5:e1000352. doi: 10.1371/journal.pcbi.1000352. [DOI] [PMC free article] [PubMed] [Google Scholar]
- 15.Langille MG, Zaneveld J, Caporaso JG, McDonald D, Knights D, Reyes JA, Clemente JC, et al. Predictive functional profiling of microbial communities using 16S rRNA marker gene sequences. Nat Biotechnol. 2013;31:814–821. doi: 10.1038/nbt.2676. [DOI] [PMC free article] [PubMed] [Google Scholar]
- 16.Miller KE, Balbas JC, Benton RL, Lam TS, Edwards KM, Kriebel RM, Schechter R. Glutaminase immunoreactivity and enzyme activity is increased in the rat dorsal root ganglion following peripheral inflammation. Pain Res Treat. 2012;2012:414697. doi: 10.1155/2012/414697. [DOI] [PMC free article] [PubMed] [Google Scholar]
- 17.Kind T, Wohlgemuth G, Lee do Y, Lu Y, Palazoglu M, Shahbaz S, Fiehn O. FiehnLib: mass spectral and retention index libraries for metabolomics based on quadrupole and time-of-flight gas chromatography/mass spectrometry. Anal Chem. 2009;81:10038–10048. doi: 10.1021/ac9019522. [DOI] [PMC free article] [PubMed] [Google Scholar]
- 18.Naqvi A, Rangwala H, Keshavarzian A, Gillevet P. Network-based modeling of the human gut microbiome. Chem Biodivers. 2010;7:1040–1050. doi: 10.1002/cbdv.200900324. [DOI] [PMC free article] [PubMed] [Google Scholar]
- 19.Shannon P, Markiel A, Ozier O, Baliga NS, Wang JT, Ramage D, Amin N, et al. Cytoscape: a software environment for integrated models of biomolecular interaction networks. Genome Res. 2003;13:2498–2504. doi: 10.1101/gr.1239303. [DOI] [PMC free article] [PubMed] [Google Scholar]
- 20.Butterworth RF. Hepatic encephalopathy: a central neuroinflammatory disorder? Hepatology. 2011;53:1372–1376. doi: 10.1002/hep.24228. [DOI] [PubMed] [Google Scholar]
- 21.Bosoi CR, Tremblay M, Rose CF. Induction of systemic oxidative stress leads to brain oedema in portacaval shunted rats. Liver Int. 2014;34:1322–1329. doi: 10.1111/liv.12414. [DOI] [PubMed] [Google Scholar]
- 22.Shawcross DL. Is it time to target gut dysbiosis and immune dysfunction in the therapy of hepatic encephalopathy? Expert Rev Gastroenterol Hepatol. 2015;9:539–542. doi: 10.1586/17474124.2015.1035257. [DOI] [PubMed] [Google Scholar]
- 23.Zhang Z, Zhai H, Geng J, Yu R, Ren H, Fan H, Shi P. Large-scale survey of gut microbiota associated with MHE Via 16S rRNA-based pyrosequencing. Am J Gastroenterol. 2013;108:1601–1611. doi: 10.1038/ajg.2013.221. [DOI] [PubMed] [Google Scholar]
- 24.Weber FL, Veach GL. The Importance of the Small Intestine in Gut Ammonium Production in the Fasting Dog. Gastroenterology. 1979;77:230–240. [PubMed] [Google Scholar]
- 25.Fouts DE, Torralba M, Nelson KE, Brenner DA, Schnabl B. Bacterial translocation and changes in the intestinal microbiome in mouse models of liver disease. J Hepatol. 2012;56:1283–1292. doi: 10.1016/j.jhep.2012.01.019. [DOI] [PMC free article] [PubMed] [Google Scholar]
- 26.Bajaj JS, Betrapally NS, Gillevet PM. Decompensated cirrhosis and microbiome interpretation. Nature. 2015;525:E1–2. doi: 10.1038/nature14851. [DOI] [PMC free article] [PubMed] [Google Scholar]
- 27.Shen TC, Albenberg L, Bittinger K, Chehoud C, Chen YY, Judge CA, Chau L, et al. Engineering the gut microbiota to treat hyperammonemia. J Clin Invest. 2015;125:2841–2850. doi: 10.1172/JCI79214. [DOI] [PMC free article] [PubMed] [Google Scholar]
- 28.Butterworth RF, Norenberg MD, Felipo V, Ferenci P, Albrecht J, Blei AT, Members of the ICoEMoHE Experimental models of hepatic encephalopathy: ISHEN guidelines. Liver Int. 2009;29:783–788. doi: 10.1111/j.1478-3231.2009.02034.x. [DOI] [PubMed] [Google Scholar]
- 29.Mazagova M, Wang L, Anfora AT, Wissmueller M, Lesley SA, Miyamoto Y, Eckmann L, et al. Commensal microbiota is hepatoprotective and prevents liver fibrosis in mice. FASEB J. 2015;29:1043–1055. doi: 10.1096/fj.14-259515. [DOI] [PMC free article] [PubMed] [Google Scholar]
- 30.Islam KB, Fukiya S, Hagio M, Fujii N, Ishizuka S, Ooka T, Ogura Y, et al. Bile acid is a host factor that regulates the composition of the cecal microbiota in rats. Gastroenterology. 2011;141:1773–1781. doi: 10.1053/j.gastro.2011.07.046. [DOI] [PubMed] [Google Scholar]
- 31.Schalm SW, van der Mey T. Hyperammonemic coma after hepatectomy in germ-free rats. Gastroenterology. 1979;77:231–234. [PubMed] [Google Scholar]
- 32.Nance FC, Kaufman HJ, Kline DG. Role of urea in the hyperammonemia of germ-free Eck fistula dogs. Gastroenterology. 1974;66:108–112. [PubMed] [Google Scholar]
- 33.Bajaj JS, Ridlon JM, Hylemon PB, Thacker LR, Heuman DM, Smith S, Sikaroodi M, et al. Linkage of gut microbiome with cognition in hepatic encephalopathy. Am J Physiol Gastrointest Liver Physiol. 2012;302:G168–175. doi: 10.1152/ajpgi.00190.2011. [DOI] [PMC free article] [PubMed] [Google Scholar]
- 34.Dam G, Sorensen M, Buhl M, Sandahl TD, Moller N, Ott P, Vilstrup H. Muscle metabolism and whole blood amino acid profile in patients with liver disease. Scand J Clin Lab Invest. 2015;75:674–680. [PubMed] [Google Scholar]
- 35.Riggio O, Varriale M, Testore GP, Di Rosa R, Di Rosa E, Merli M, Romiti A, et al. Effect of lactitol and lactulose administration on the fecal flora in cirrhotic patients. J Clin Gastroenterol. 1990;12:433–436. doi: 10.1097/00004836-199008000-00016. [DOI] [PubMed] [Google Scholar]
- 36.Bajaj JS, Gillevet PM, Patel NR, Ahluwalia V, Ridlon JM, Kettenmann B, Schubert CM, et al. A longitudinal systems biology analysis of lactulose withdrawal in hepatic encephalopathy. Metab Brain Dis. 2012;27:205–215. doi: 10.1007/s11011-012-9303-0. [DOI] [PubMed] [Google Scholar]
- 37.Bosoi CR, Zwingmann C, Marin H, Parent-Robitaille C, Huynh J, Tremblay M, Rose CF. Increased brain lactate is central to the development of brain edema in rats with chronic liver disease. J Hepatol. 2014;60:554–560. doi: 10.1016/j.jhep.2013.10.011. [DOI] [PubMed] [Google Scholar]
Associated Data
This section collects any data citations, data availability statements, or supplementary materials included in this article.