

Abstract
BACKGROUND. Paneth cell dysfunction has been implicated in a subset of Crohn’s disease (CD) patients. We previously stratified clinical outcomes of CD patients by using Paneth cell phenotypes, which we defined by the intracellular distribution of antimicrobial proteins. Animal studies suggest that Paneth cells shape the intestinal microbiome. However, it is unclear whether Paneth cell phenotypes alter the microbiome complexity in CD subjects. Therefore, we analyzed the correlation of Paneth cell phenotypes with mucosal microbiome composition and ileal RNA expression in pediatric CD and noninflammatory bowel disease (non-IBD) patients.
METHODS. Pediatric CD (n = 44) and non-IBD (n = 62) patients aged 4 to 18 were recruited prior to routine endoscopic biopsy. Ileal mucosal samples were analyzed for Paneth cell phenotypes, mucosal microbiome composition, and RNA transcriptome.
RESULTS. The prevalence of abnormal Paneth cells was higher in pediatric versus adult CD cohorts. For pediatric CD patients, those with abnormal Paneth cells showed significant changes in their ileal mucosal microbiome, highlighted by reduced protective microbes and enriched proinflammatory microbes. Ileal transcriptome profiles showed reduced transcripts for genes that control oxidative phosphorylation in CD patients with abnormal Paneth cells. These transcriptional changes in turn were correlated with specific microbiome alterations. In non-IBD patients, a subset contained abnormal Paneth cells. However, this subset was not associated with alterations in the microbiome or host transcriptome.
CONCLUSION. Paneth cell abnormalities in human subjects are associated with mucosal dysbiosis in the context of CD, and these changes are associated with alterations in oxidative phosphorylation, potentially in a feedback loop.
FUNDING. The research was funded by Helmsley Charitable Trust (to T.S. Stappenbeck, R.J. Xavier, and D.P.B. McGovern), Crohn’s and Colitis Foundation of America (to N.H. Salzman, T.S. Stappenbeck, R.J. Xavier, and C. Huttenhower), and Doris Duke Charitable Foundation grant 2014103 (to T.C. Liu).
Dysbiosis in Crohn’s disease patients is associated with Paneth cell abnormalities, with alterations in oxidative phosphorylation as a potential mechanism.
Introduction
Crohn’s disease (CD) is a form of inflammatory bowel disease (IBD) rooted in environmental triggers of immune dysregulation that occur in genetically susceptible hosts (1). There is mounting clinical evidence that environmental factors are critical in CD pathogenesis (2). While environmental factors may play a more significant role in patients who harbor common variants of susceptibility genes than those with rare variants, in vivo models have shown that environmental factors are still required to trigger disease, even in the case of Mendelian inheritance (3). However, the exposure and impact of potential environmental factors, and their interplay with host genetics, are difficult to quantify. Therefore, the development of a cellular readout that synthesizes the impact from host genetics and environmental exposures will improve our understanding of pathogenesis and functionally subclassify CD.
Small intestinal Paneth cells are a candidate biomarker. Paneth cells are secretory epithelial cells important in innate immunity (4). Their proper function limits enteric pathogens and prevents commensal microbe translocations through the production of a diverse array of antimicrobial peptides and proteins (4–7). For example, deletion of Mmp7, which encodes the enzyme critical for processing Paneth cell α-defensins in mice, increases susceptibility to Salmonella typhimurium (8), while engineered expression of the human defensin HD5 in mice is protective (9). In addition, alteration of defensin expression in mouse Paneth cells is associated with alterations in the small intestinal microbiota and subsequent modulation of the mucosal immune response (7). In humans, reduced mRNA expression of α-defensins has been shown in CD patients with ileal disease (10, 11), suggesting that the microbiome compositions between CD and non-IBD patients may be different. The interaction between Paneth cells and gut microbiota has been postulated to be one of the key elements of CD pathogenesis (6, 12–14). Indeed, several studies have shown that there is reduced microbiome diversity and changes in abundance in certain phyla in CD (15–21). In a large cohort of treatment-naive pediatric CD patients, the microbiome contained an increased abundance in specific bacterial families including Enterobacteriaceae, Pasteurellacaea, Veillonellaceae, and Fusobacteriaceae, and decreased abundance in Erysipelotrichales, Bacteroidales, and Clostridiales (22). Together, these studies suggest that defects in Paneth cells could lead to reduced antimicrobial peptide production, which could result in dysbiosis and ultimately IBD. However, an alternative mechanism has recently been postulated in which dysbiosis may precede intestinal inflammation and subsequent Paneth cell dysfunction in genetically susceptible hosts. In a TNFΔARE mouse model, gut dysbiosis led to chronic intestinal inflammation that resulted in loss of Paneth cells (23). Thus, it is likely that there is a complex cross talk between Paneth cells and the gut microbiota.
Localization and distribution of cytoplasmic granules containing antimicrobial proteins within Paneth cells can be used to subtype CD (24, 25). Abnormal localization and distribution of antimicrobial peptide–containing cytoplasmic granules within Paneth cells has been observed in association with autophagy defects in mouse models and humans with CD. A subset of adult CD patients with mutations in the autophagy-associated CD susceptibility genes ATG16L1 and NOD2 has alterations in antimicrobial protein distribution in Paneth cells (24, 25). These alterations are similar to those seen in mice engineered for decreased expression of the autophagy protein Atg16l1 (24) and infected with murine norovirus (26). These mice also showed worsened injury in a dextran sodium sulfate colitis model (26). Additional candidate genes that are identified as CD susceptibility genes that may affect Paneth cells include Xbp1 and Irgm1 (5, 27). Mice deficient in Xbp1 not only showed defective Paneth cells but also intestinal inflammation (5).
In adult CD patients, the abnormal Paneth cell–enriched phenotype (defined as greater than or equal to 20% total Paneth cells showing morphologic defects; herein classified as Type I Paneth cell phenotype) shows an immune activation gene expression signature (25), consistent with a role of these cells in the initiation of inflammation (6). Importantly, in adult CD patients, Paneth cell phenotypes strongly correlate with early disease recurrence after resection for CD (25).
Given the role of Paneth cells in gut homeostasis, we address the central question of whether Paneth cell phenotypes may be associated with specific aspects of mucosal microbiome composition in CD patients. Herein, we report that a CD subtype characterized by enrichment for abnormal Paneth cells correlates with alterations in the mucosal microbiome. The abnormal Paneth cell phenotype and microbiome composition alterations were both associated with profound changes in the expression of a unique set of genes involved in oxidative phosphorylation, suggesting the latter as a potential underlying mechanism in the host-microbial interaction in CD.
Results
Pediatric CD patients showed higher prevalence of Type I Paneth cell phenotype than adult CD patients.
We previously analyzed two cohorts of adult CD resection cases from St. Louis (n = 170) and Los Angeles (n = 361) (Figure 1A and Supplemental Figure 1A; supplemental material available online with this article; doi:10.1172/jci.insight.86907DS1). Prevalence of the Type I Paneth cell phenotype was 26% and 19%, respectively (Figure 1A and Supplemental Figure 1, A and B). In addition, we also analyzed a cohort of pediatric resection cases from St. Louis (n = 73) and found that the prevalence of the Type I Paneth cell phenotype in this cohort was much higher (40%; Figure 1A and Supplemental Figure 1C). To investigate the biological relevance of the Paneth cell phenotype in pediatric CD, we recruited and analyzed an independent, prospectively collected pediatric cohort (Milwaukee; Figure 1, A and B, and Table 1). For this part of the study, multiple mucosal biopsies were obtained for analysis of Paneth cell phenotype, microbiome, and host mucosal transcriptome. We previously showed that biopsy samples can be used to accurately determine Paneth cell phenotypes independent of active inflammation (28). The prevalence of the Type I Paneth cell phenotype in CD patients was 52% in this cohort (n = 44; Figure 1A and Supplemental Figure 1D). In parallel, we also recruited a cohort of non-IBD patients, and the prevalence of Type I Paneth cell phenotype in those patients was 40% (25 of 62). The combined pediatric cohorts showed a significantly higher percentage of Type I Paneth cell phenotype as compared to the combined adult cohorts (P < 0.0001). The approximately 50:50 split of Paneth cell phenotypes in the Milwaukee cohort facilitated additional analysis of the microbiome and transcriptome. A representative Paneth cell lysozyme immunofluorescence is shown in Figure 1C.
Figure 1. High prevalence of Type I Paneth cell phenotype in pediatric Crohn’s disease (CD) patients.

(A) Pediatric CD patients (St. Louis cohort: n = 73; Milwaukee cohort: n = 44) showed significantly higher prevalence of Type I Paneth cell phenotype than adult CD patients (St. Louis cohort: n = 170; Los Angeles cohort: n = 361) (****P < 0.001 by ANOVA). (B) Flow chart of the recruitment and exclusion of the Milwaukee pediatric CD cohort. (C) Representative Paneth cell staining by lysozyme immunofluorescence. Red: lysozyme; blue: DAPI. Dashed circle: intestinal crypts. D0: normal Paneth cells; D1, D3: abnormal Paneth cells. Scale bar: 1 μm.
Table 1. Basic information of the pediatric CD and non-IBD patients with mucosal microbiome, transcriptome, and Paneth cell phenotype analysis.

Paneth cell phenotype did not correlate with ATG16L1 T300A or NOD2 risk alleles in pediatric CD.
We previously correlated the degree of Paneth cell defect (percentage of Paneth cells with normal morphology) with numbers of ATG16L1 T300A or NOD2 risk alleles identified in adult CD cohorts (24, 25). As shown in Supplemental Figure 2, A and B, neither the numbers of risk alleles of ATG16L1 T300A nor NOD2 correlated with Paneth cell phenotype in our pediatric cohorts. Likewise, the sum total of ATG16L1 T300A and NOD2 risk alleles did not correlate with Paneth cell phenotype (Supplemental Figure 2C). This suggests that in this population of pediatric CD patients, environmental factor(s) may play a more significant role than ATG16L1 T300A or NOD2 risk alleles in modulating Paneth cell function, or that additional, unidentified risk variants in pediatric CD patients are genetic drivers of the Paneth cell phenotype in these patients.
Characterization of the ileal mucosal microbiome in pediatric CD patients.
After quality control, microbiome data from only 36 CD and 47 non-IBD patients with corresponding Paneth cell phenotype information were available for further analysis. Likewise, 38 of the CD patients and 51 non-IBD patients had sufficient corresponding ileal RNA for transcriptome profiling (Figure 1B). 16S rRNA sequencing of ileal biopsies showed that the mucosa-associated bacteria from pediatric CD patients had reduced alpha diversity (Faith’s phylogenetic diversity) compared to non-IBD patients (Figure 2, A and B). In addition, by examining the beta diversity, we found that microbial communities were more dissimilar among CD patients than a separately recruited, slightly younger non-IBD patient cohort (Figure 2, C and D). In the pediatric population, healthy volunteers are not available. The non-IBD controls were culled from pediatric patients with abdominal pain, who had no evidence of intestinal inflammation by histology, and were primarily comprised of individuals with functional abdominal pain and irritable bowel syndrome. Analysis of the bacterial composition of CD and non-IBD patients revealed distinguishing taxa between non-IBD and CD patients (Supplemental Figure 3, A–C). These results suggest that the non-IBD controls in this study, while slightly younger on average and exhibiting gastrointestinal complaints without evidence of inflammation, were nevertheless more homogeneous and maintained an overall diverse microbial community.
Figure 2. The mucosal microbiome of pediatric Crohn’s disease (CD) (n = 36) and noninflammatory bowel disease (non-IBD) (n = 47) patients (Milwaukee cohort).

(A and B) Alpha diversity of mucosal microbial composition in pediatric CD and non-IBD patients. Shown here with Shannon diversity index (A) (P = 0.1106, Mann-Whitney test) and Faith’s phylogenetic diversity index (B) (P = 0.0241, Mann-Whitney test). (C and D) Unweighted (C) (Kruskal-Wallis test P < 0.0001, Dunn’s multiple comparisons test P < 0.0001) and weighted (D) (Kruskal-Wallis test P = 0.0011, Dunn’s multiple comparisons test P < 0.01) beta diversity comparison within and between each group (Milwaukee cohort). *P < 0.05; ****P < 0.0001. Boxes extend from the 25th to 75th percentiles. The whiskers were plotted from the minimum to the maximum value, with each individual value as a dot on the graph. There was no outlying value that was not shown.
Paneth cell phenotypes were associated with changes in a subset of bacterial taxa altered in pediatric CD patients.
We next examined the correlation of the Paneth cell phenotype with the composition of the mucosal microbiome. Amongst CD patients, the microbiome composition showed overlap in certain taxa when comparing Type I and II Paneth cell phenotypes (Supplemental Figure 4, A and B). However, CD patients with the Type I Paneth cell phenotype showed significantly reduced alpha diversity compared to those with the Type II Paneth cell phenotype, a difference not observed in non-IBD patients (Figure 3, A–D). Further analysis by correlating the alpha diversity and the degree of Paneth cell defect (percentage of normal Paneth cells) showed that the degree of Paneth cell defect correlated with Faith’s phylogenetic diversity in CD but not in non-IBD (Supplemental Figure 5, A–D). CD patients with the Type I Paneth cell phenotype also showed significantly higher within-group beta diversity than those with Type II Paneth cell phenotype (Figure 3, E and F), suggesting that CD patients with the Type I Paneth cell phenotype were a subset of patients whose microbial communities were more heterogeneous. While Type I Paneth cell phenotype also correlated with greater within-group heterogeneity in beta diversity in non-IBD patients (Supplemental Figure 6, A and B), fewer pronounced taxonomic differences were observed between Type I and II Paneth cell phenotypes in non-IBD compared to CD patients. A cladogram is shown in Supplemental Figure 6C.
Figure 3. Stratifying pediatric Crohn’s disease (CD) patients by Paneth cell phenotype reveals differences in alpha and beta diversity in CD patients with Type I Paneth cell phenotype.

(A–D) Alpha diversity (Shannon and Faith’s phylogenetic diversity by Mann-Whitney test) of Type I versus Type II Paneth cell phenotype in CD (n = 36) and noninflammatory bowel disease (non-IBD) (n = 47). (E and F) Unweighted and weighted beta diversity comparison (by Kruskal-Wallis and Dunn’s tests) within and between CD patients with Type I versus Type II Paneth cell phenotype. *P < 0.05; **P < 0.01; ***P < 0.001. Boxes extend from the 25th to 75th percentiles. The whiskers were plotted from the minimum to the maximum value, with each individual value as a dot on the graph. There was no outlying value that was not shown.
Detailed analysis of taxonomic differences between CD patients with Types I and II Paneth cell phenotypes (Supplemental Figure 7, A and B) showed that Corynebacterium and Erysipelotrichaceae were more abundant in CD patients with the Type I Paneth cell phenotype (Figure 4, A and B), whereas Faecalibacterium, Blautia, Ruminococcaceae, Porphyromonas, Lachnospira, Peptostreptococcus, Anaerostipes, and Odoribacteraceae were more abundant in CD patients with the Type II Paneth cell phenotype (Figure 4, C–J). Interestingly, whereas there was reduced abundance of Faecalibacterium and Lachnospriaceae in the ileal mucosa of pediatric CD patients in the RISK study (22, 29), here these taxa were reduced only in CD patients with the Type I Paneth cell phenotype. Faecalibacterium prausnitzii is of interest as it possesses antiinflammatory properties and is reduced in CD patients (30), in particular in those with ileal involvement (15). In addition, Corynebacterium and Erysipelotrichaceae are considered to be proinflammatory (31, 32), and the alteration of abundance of Erysipelotrichaceae was also identified in the RISK cohort study (22). While we expected to find increased relative abundance of these microbes in CD patients with the Type I Paneth cell phenotype, the finding that these microbes are present in relatively similar abundance in non-IBD patients (regardless of Paneth cell phenotype), was unexpected (Figure 4, A and B). Our findings suggest that CD patients with the Type I Paneth cell phenotype contained reduced abundance of antiinflammatory microbes while maintaining the abundance of proinflammatory microbes. In contrast, those with Type II Paneth cell phenotype contained a combination of reduced proinflammatory microbes while maintaining normal abundance of antiinflammatory microbes.
Figure 4. Stratifying pediatric Crohn’s disease (CD) patients (total n = 36) by Paneth cell phenotype reveals taxonomic differences in CD patients.

(A and B) Microbes that are significantly more abundant in CD patients with Type I Paneth cell phenotype identified by Differential Feature analysis (LEfSe). (A) Corynebacterium. (B) Erysipeloctrichaceae. (C–J) Selected microbes whose abundance is reduced in CD patients with Type I Paneth cell phenotype but not in noninflammatory bowel disease (non-IBD) patients with either Paneth cell phenotype identified by Differential Feature analysis (LEfSe). (C) Faecalibacterium. (D) Blautia. (E) Ruminococcaceae. (F) Porphyromonas. (G) Lachnospira. (H) Peptostreptococcus. (I) Anaerostipes. (J) Odoribacteraceae. *P < 0.05; **P < 0.01; ***P < 0.001 (Mann-Whitney test). Boxes extend from the 25th to 75th percentiles. The whiskers were plotted from the minimum to the maximum value, with each individual value as a dot on the graph. There was no outlying value that was not shown.
Paneth cell phenotype was associated with unique oxidative phosphorylation signature in CD patients.
We next analyzed the ileal transcriptome and observed similar up- and downregulation of gene expression (including DUOXA2, APOA1, etc.) in our pediatric CD patients as previously described (29). We then correlated gene expression with Paneth cell phenotypes by principle coordinate analysis (Supplemental Figure 8) and clustering analysis (Figure 5A) and found a strong association between Paneth cell phenotype and ileal gene expression. One striking finding was the association of reduced expression of a large cluster of oxidative phosphorylation genes (n = 50) with the Type I Paneth cell phenotype in CD patients but not in non-IBD patients with the Type I Paneth cell phenotype (Figure 5, B–D, see complete oxidative phosphorylation gene list in Supplemental Table 1). Using COX6A1 as an example, we found that the expression of this gene correlated with the percentage of abnormal Paneth cells (Figure 5E). Importantly, we found significant correlation between oxidative phosphorylation gene expression and specific taxa of the ileal microbiome (e.g., Faecalibacterium) that were dysregulated in CD patients with the Type I Paneth cell phenotype (Figure 5, F and G).
Figure 5. The ileal mucosa of pediatric Crohn’s disease (CD) patients (total n = 38 with sufficient RNA) with Type I Paneth cell phenotype is associated with reduced expression of genes involved in oxidative phosphorylation.

(A) Heat map based on hierarchical clustering (Pearson with complete linkage) of gene expression profiles of Type I (n = 21) and Type II (n = 17) Paneth CD patients. Blue and red indicate lower and higher levels of expression, respectively. The cluster region containing the oxidative phosphorylation genes is labeled. (B–D) Expression of selected nuclear-encoded oxidative phosphorylation genes is associated with Paneth cell phenotype in CD patients (n = 38) but not in non-IBD patients (n = 51 with sufficient RNA), including COX6B1 (B), ATP5J2 (C), and NDUFA8 (D). Data in B–D analyzed by 1-way ANOVA. (E) Expression level of the oxidative phosphorylation gene COX6A1 correlates with the percentage of normal Paneth cells (D0) by Pearson’s correlation test. (F) Selected bacterial taxa that are significantly more abundant in CD patients with high expression level of oxidative phosphorylation genes (Faecalibacterium, Actinomyces, Verrrucomicrobiaceae) identified by Differential Feature analysis (LEfSe). (G) Reduced abundance of Faecalibacterium in CD patients with low oxidative phosphorylation expression levels (by Mann-Whitney test). *P < 0.05; **P < 0.01. Boxes extend from the 25th to 75th percentiles. The whiskers were plotted from the minimum to the maximum value, with each individual value as a dot on the graph. There was no outlying value that was not shown.
A second cluster of genes with differential expression in CD patients by Paneth cell phenotypes was associated with Paneth cells themselves (Supplemental Table 2 and Supplemental Figure 9). Rather than decreased expression of the Paneth cell gene cluster, we found a failure of induction of Paneth cell genes in CD patients with Type 1 Paneth cell phenotype. This finding is consistent with a recent report demonstrating that monocytes from CD patients fail to induce Paneth cell defensin expression, suggesting an additional layer of cross talk between Paneth cells and the systemic immune system in CD (33). The failure of induction of this Paneth cell cluster did not correlate with Paneth cell phenotypes in non-IBD patients (Supplemental Figure 9, A–C). In contrast with the oxidative phosphorylation gene cluster, using the Paneth cell gene cluster for microbiome stratification only showed differences in Porphyromonadaceae, a family under the phylum Bacteroidetes, previously linked to several metabolic parameters (Supplemental Figure 9D). However this was not further associated with Paneth cell phenotypes. Thus, the oxidative phosphorylation gene cluster showed a more robust correlation with microbiome and Paneth cell phenotype.
Discussion
We previously showed that Paneth cell phenotypes are a clinically relevant prognostic biomarker for postoperative CD and are associated with host genotype, pathologic hallmark, and immune-activation gene expression (25). However, there was a lack of a broader biological relevance of this phenotype, in particular its role in modulating mucosal microbiome composition, a major change observed across multiple CD cohorts (22, 34). In the current study, we showed that pediatric CD patients, in contrast to adult CD patients, had a higher prevalence of the Type I (abnormal) Paneth cell phenotype. We further showed that the Type I Paneth cell phenotype was associated with taxonomic differences in the mucosal microbiome in CD but not in non-IBD patients. Finally, the relative abundance of specific taxa correlated with Paneth cell phenotypes was associated with alterations in oxidative phosphorylation gene expression.
CD patients have been suggested to possess reduced α-defensins in the ileum (10), raising the possibility that defects in Paneth cells could lead to dysbiosis and IBD. Interestingly, whereas there was reduced abundance of barrier-associated microbes Faecalibacterium and Lachnospriaceae in the ileal mucosa of pediatric CD patients in the RISK study (22, 29), who were not analyzed on the basis of Paneth cell phenotype, in our study these taxa were reduced predominantly in CD patients with the Type I Paneth cell phenotype. Thus, one possible scenario is that the reduction of F. prausnitzii creates an additional stress for Paneth cells to produce and secrete antimicrobial peptides to combat potential invasive microbes, which eventually leads to the dysfunction of Paneth cells. Alternatively, dysmorphic Paneth cells, which are associated with reduced antimicrobial peptides, may allow proinflammatory microbes to outcompete the barrier-associated microbes such as F. prausnitzii.
A second main finding in our microbiome analysis is that the abundance of Erysipelotrichaceae is reduced predominantly in CD patients with the Type II Paneth cell phenotype. This alteration was also identified in CD patients compared to non-IBD in the RISK cohort (22). Our findings suggest that normal Paneth cell function may be crucial in the defense/clearance of these proinflammatory microbes in the context of CD. In contrast, Enterobacteriaceae, another family of proinflammatory microbes found to have increased relative abundance in CD patients in both our cohort and the RISK study, did not correlate with Paneth cell phenotype, suggesting that the presence of inflammation may play a more important role than Paneth cell phenotype for Enterobacteriaceae colonization in CD. Together, our study and other previous reports suggest multiple mechanisms for how proinflammatory microbes become associated with CD patients (35–41).
Based on our previous finding in adult CD patients that Type I Paneth cell phenotype was associated with CD-associated single nucleotide polymorphisms (SNPs) in autophagy-associated ATG16L1 and NOD2 (24, 25), the lack of correlation between ATG16L1 T300A SNP and Type I Paneth cell phenotype in the Milwaukee cohort was unexpected. While it is possible that the sample size was too small to detect a correlation, it is also possible that additional genes involved in the development of CD in these patients also affect the development of Type I Paneth cell phenotype. Compared to adult CD, genetics plays a more important pathogenic role in pediatric CD, in particular those with very early onset disease (42–44), although in mouse models the Paneth cell antimicrobial function is independent of Nod2 (45). Thus, it is possible that additional CD susceptibility genes may cause the Paneth cell defect. An alternative/complementary explanation is that environmental factor(s) play a more important role than genetics in inducing Paneth cell defect in this population. This highlights the importance of using Paneth cell phenotype as a biomarker as it may provide greater value over genetic or microbiota signatures alone.
Although we cannot measure antimicrobial activity in the subjects’ ileal biopsies, altered expression of Paneth cell–specific genes among CD patients with Types I and II Paneth cell phenotypes may reflect diminished Paneth cell function under stress, as suggested by previous reports (6, 46). In contrast, the correlation of Paneth cell phenotypes with the expression of the oxidative phosphorylation gene cluster, and that these genes could be transcriptionally coexpressed and coregulated (47), suggest that an alternative, central transcriptional regulation mechanism may be responsible. Future functional studies examining Paneth cells and oxidative phosphorylation will provide additional insight.
The observation that the correlation between Paneth cell phenotype, mucosal dysbiosis, and epithelial oxidative phosphorylation gene expression is seen exclusively in CD but not non-IBD patients is intriguing. This suggests that the presence of disease is essential in mediating these complex interactions. However, the mechanisms by which non-IBD patients develop Type I Paneth cell phenotype remain unclear. One approach would be to investigate the long-term outcome of the non-IBD patients with Type I Paneth cell phenotype to see whether this is a sentinel biomarker for development of intestinal inflammation, and whether patients with worse Paneth cell defect will develop more complex diseases. Alternatively, other potential environmental factors that could lead to Paneth cell defect (e.g., viral infection, etc.) need to be investigated (26). In addition, while our data suggest that the level of microbiome alpha diversity and epithelial oxidative phosphorylation gene expression correlate with the degree of Paneth cell defect in CD patients, it is unclear whether this correlates with more severe disease activity in these patients.
In addition, future studies that include longitudinal sampling would allow a more detailed understanding of the dynamics of the Paneth cell-microbiome-ileal transcriptome interaction, including the determination of temporal changes in Paneth cell phenotype and the microbiome, and their relationship with disease susceptibility, progression, and response to therapy. A recent in vivo study in mice has found that gut dysbiosis leads to chronic ileal inflammation with subsequent failure of Paneth cell function (23), suggesting an alternative “pathway” that could regulate both Paneth cell phenotype and CD development. Furthermore, another recent study examining a cohort of pediatric CD patients found that fecal microbiota composition is dynamic and can be affected by diet, antibiotics, and the presence of inflammation (21). Our previous finding suggests that the Paneth cell phenotypes do not vary significantly over time (28). Thus, a longitudinal study will allow us to address the biological and clinical relevance of such a finding. Although it has been shown that the gut microbiome matures and stabilizes after 3 years of age (48), expansion of the current cohort to improve age matching of the CD and non-IBD cohorts will provide sufficient statistical power to interrogate multiple potential clinically confounding factors. However, it should be noted that it is not possible to ethically recruit asymptomatic healthy subjects for endoscopic biopsies in a pediatric population.
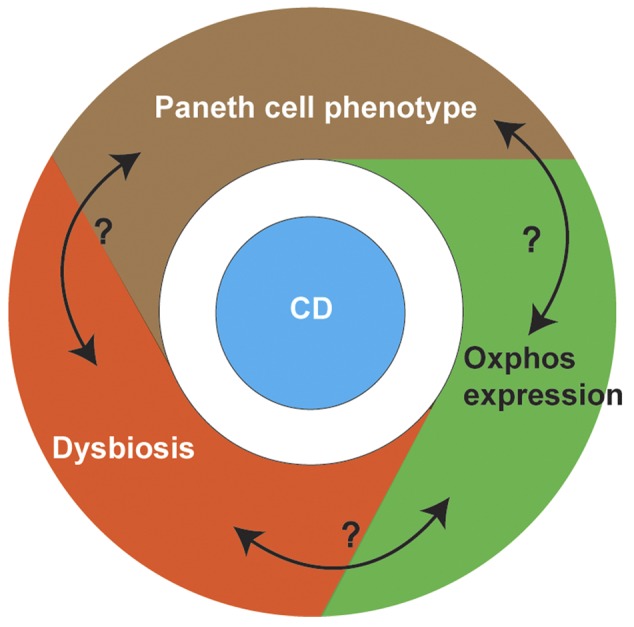
Importantly, our study suggests a potential, complex interplay between Paneth cell phenotype and microbiome in CD, with oxidative phosphorylation being a potential mediator (Figure 6). Of note, the microbiota has been proposed to play an important role in regulating host energy homeostasis through oxidative phosphorylation (49). Furthermore, a recent mouse study showed that alterations in diet can alter colonic microbial composition as well as downregulation of oxidative phosphorylation genes (50). Further investigation is needed to reveal the mechanistic insight between Paneth cell function, microbiota changes, and oxidative phosphorylation status in the context of CD.
Figure 6. Proposed interactions between Paneth cell function, microbiota changes, and oxidative phosphorylation status in Crohn’s disease (CD) patients.
In summary, to our knowledge we have shown for the first time that a Paneth cell defect in CD patients correlates with changes in the mucosal microbiota, and identified the oxidative phosphorylation pathway as a potential mechanism. The imbalance of proinflammatory/barrier-associated microbial profiles associated with Paneth cell phenotypes and alterations in cellular metabolism provides us further insight into the disease pathogenesis. Future studies that include longitudinal sampling would allow a more detailed understanding of the temporal dynamics of the Paneth cell-microbiome-ileal transcriptome interaction, and their relationship with disease susceptibility, progression, and response to therapy.
Methods
Patients.
For the Washington University and Cedars-Sinai cohorts, CD patients who underwent ileocolectomy between 1999 and 2013 were identified through medical records. De-identified tissue samples from proximal (ileal) resection margins were used for Paneth cell phenotype analysis (25).
CD was defined and classified according to standard criteria (51, 52). A total of 70 CD patients were prospectively recruited from Medical College of Wisconsin, Milwaukee (Milwaukee cohort) from January 2011 to December 2013. After excluding those with inadequate biopsy samples for Paneth cell phenotyping (i.e., 40 or more crypts free of biopsy/processing artifact) (28), 44 CD patients with Paneth cell phenotype remained. Among the 44 CD patients, 36 had microbiome data and 38 had transcriptome data that passed quality control. In parallel, a cohort of 83 symptomatic, non-IBD patients (not healthy volunteers) who underwent endoscopy for nonspecific gastrointestinal symptoms and without clinical or endoscopic evidence of CD were also recruited. Five with endoscopic inflammation (but otherwise did not meet diagnostic criteria for CD) and 16 with inadequate biopsy material for Paneth cell phenotype analysis were excluded. Therefore, only 62 patients with Paneth cell phenotype were included. Among the 62 non-IBD patients, 47 had microbiome data and 51 had transcriptome data that passed quality control. The detailed demographic and clinical information for these patients are shown in Table 1. Due to the exclusion of many samples due to quality control, the final cohorts of CD and non-IBD groups used for further analyses differ in age (P < 0.0001; Table 1). Biopsies were taken from the terminal ileum using standard endoscopy forceps and placed in a sterile cryovial with RNAlater (QIAGEN) on ice in the endoscopy suite. Biopsy specimens were used for ileal microbiome and transcriptome studies, and Paneth cell phenotype analysis (see Supplemental Methods). The non-IBD controls underwent screening endoscopy for underlying gastrointestinal symptoms, but lacked macroscopic and microscopic inflammation. All subjects were free of any known infection at the time of sample collection.
Paneth cell phenotype analysis.
Lysozyme and defensin 5 immunofluorescence assays were performed (by T.C.L.) as described previously (24–26, 28). Lysozyme antibody was obtained from Santa Cruz Biotechnology (clone C-19; catalog number sc-27958), and defensin 5 antibody was obtained from Novus (clone 8C8; catalog number NB110-60002). Only samples with 40 or more well-oriented crypts that were free of biopsy artifact (and thus staining could be interpretable) were included for correlation analysis (28). For the Milwaukee cohort, the interpreter (T.C.L.) was blinded to the identity of the patients (CD vs. non-IBD) at the time of analysis. Classification of Type I and II Paneth cell phenotype was performed as previously described (25, 28). In brief, each Paneth cell can be classified into normal (previously designated D0) or one of the 5 abnormal categories, including: disordered (abnormal distribution and size of the granules; previously designated D1), diminished (less than or equal to 10 granules; previously designated D2), diffuse (smear of lysozyme or defensin within the cytoplasm with no recognizable granules; previously designated D3), excluded (majority of the granules do not contain stainable material; previously designated D4), and enlarged (rare, megagranules; previously designated D5) (25, 28). The Paneth cell phenotype of each patient is then defined by the percentage of total abnormal Paneth cells in the sample. Type I Paneth cell phenotype is defined as greater than or equal to 20% of total Paneth cells showing morphologic defects, whereas Type II Paneth cell phenotype is defined as less than 20% of total Paneth cells showing morphologic defects.
Microbiome analysis.
Genomic DNA was extracted from ileal biopsies using the MO BIO PowerLyzer PowerSoil DNA Isolation kit (MO BIO) with slight modification of the protocol. After addition of C1 solution and heating the samples at 65°C for 10 minutes, the sample was further heated at 95°C for 10 minutes followed by vigorous bead beating using PowerLyzer (MO BIO). The 16S gene dataset consists of Illumina MiSeq sequences targeting the V4 variable region. Detailed protocols used for 16S amplification and sequencing are as described before (53). In brief, genomic DNA was subjected to 16S amplifications using primers designed incorporating the Illumina adapters and a sample barcode sequence, allowing directional sequencing covering variable region V4 (Primers: 515F [GTGCCAGCMGCCGCGGTAA] and 806R [GGACTACHVGGGTWTCTAAT]). PCR mixtures contained 10 μl of diluted template (1:50), 10 μl of HotMasterMix with the HotMaster Taq DNA Polymerase (5 Prime), and 5 μl of primer mix (2 μM of each primer). The cycling conditions consisted of an initial denaturation of 94°C for 3 minutes, followed by 30 cycles of denaturation at 94°C for 45 seconds, annealing at 50°C for 60 seconds, extension at 72°C for 5 minutes, and a final extension at 72°C for 10 minutes. Amplicons were quantified on the Caliper LabChipGX (PerkinElmer), pooled in equimolar concentrations, size selected (375–425 bp) on the Pippin Prep (Sage Sciences) to reduce nonspecific amplification products from host DNA, and a final library size and quantification was performed on an Agilent Bioanalyzer 2100 DNA 1000 chips (Agilent Technologies). Sequencing was performed on the Illumina MiSeq v2 platform according to the manufacturer’s specifications with addition of 5% PhiX, generating paired-end reads of 175 bases in length in each direction. The overlapping paired-end reads were stitched together (approximately 97-bp overlap), size selected to reduce nonspecific amplification products from host DNA (225–275 bp), and further processed in a data curation pipeline implemented in QIIME 1.5.0 as pick_reference_otus.py (54). In brief, this pipeline will pick operational taxonomic units (OTUs) using a reference-based method and constructs an OTU table. Taxonomy is assigned using the Greengenes predefined taxonomy map of reference sequence OTUs to taxonomy (55). The resulting OTU tables are checked for mislabeling (56) and contamination (57), and further microbial community analysis and visualizations. A mean sequence depth of 29,914/sample was obtained, and samples with less than 3,000 filtered sequences were excluded from analysis.
All samples were rarefied to a depth of 10,000 sequences. Analysis of alpha diversity, including Faith’s phylogenetic diversity (58) and Shannon diversity, was performed using alpha_diversity.py in QIIME on rarefied data. Beta diversity was determined in QIIME using beta_diversity_through_plots.py to determine both weighted and unweighted UniFrac distances and to generate principal coordinates analysis plots through Emperor (59).
RNA-seq data quality control and processing.
RNA-seq reads were aligned to the GRCm38.76 assembly from Ensembl with STAR version 2.0.4b. Gene counts were derived from the number of uniquely aligned unambiguous reads by Subread:featureCount version 1.4.5. Sequencing performance was assessed for total number of aligned reads, total number of uniquely aligned reads, genes detected, ribosomal fraction, known junction saturation, and read distribution over known gene models with RSeQC version 2.3. All gene counts were subsequently normalized utilizing a generalized normalization package IRON version 2.1.5 (60) with RNA-Seq options.
Statistics.
Descriptive characteristics of the sample were summarized by median and interquartile range (IQR). A nonparametric Mann-Whitney-Wilcoxon test was used to compare continuous variables and a Chi-square test or Fisher’s test was used to calculate the associations between categorical variables. Comparison of more than two groups was performed using the Kruskal-Wallis test followed by Dunn’s multiple comparisons adjustment. Principle coordinate analysis was performed using ANOSIM with 999 permutations. Relative OTU abundance data were input into LEfSe to determine biomarkers with significant linear discriminant analysis effect size (61). Biomarkers for CD or non-IBD were identified by comparison of all samples. Biomarkers for Type I or II Paneth cell phenotypes were identified by within-group comparison of samples from CD patients or from non-IBD patients. After Kruskal-Wallis analysis (α value = 0.05) of all features, a linear discriminant analysis model was used to rank discriminant features by the effect size with which they differentiated classes. The threshold for logarithmic linear discriminant analysis score for discriminative features was set at 2.0. Biomarkers were graphically annotated on a taxonomic tree with GraPhlAn (publicly available at http://huttenhower.sph.harvard.edu/graphlan; ref 62). For transcriptome analysis, comparison between gene expression in each group stratified by patient group (CD vs. non-IBD) and Paneth cell phenotype was performed by one-way ANOVA followed by Tukey’s multiple comparison adjustment. Pearson’s correlation coefficient was used to calculate the correlations between gene expression level and percentage of normal Paneth cells (25). All tests were 2-tailed and a P value of less than 0.05 was considered significant. Data were plotted and analyzed using GraphPad Prism (version 6.05) and SAS version 9.4 (SAS Institute). Data represent the mean ± SEM.
Study approval.
The study was approved by the Institutional Review Board of Washington University School of Medicine, Cedars-Sinai Medical Center, and Medical College of Wisconsin. For the Milwaukee cohort, written informed consent was obtained from subjects or their parents/legal guardians.
Data depository.
The accession number for the next-generation sequencing data deposition at NCBI BioProject is PRJNA317429.
Additional information is included in Supplemental Methods.
Author contributions
TCL, TSS, and NHS designed the study. TCL, BG, MTB, VL, MH, PB, and RH acquired data. BG, MS, JN, JC, VB, and DL recruited patients. TCL, MTB, VL, RH, YC, PS, CL, CH, RJX, TSS, and NHS analyzed data. TCL, MTB, RH, TSS, and NHS drafted the manuscript. MTB, VL, YC, PS, and RH performed statistical analysis. DPBM provided samples.
Supplementary Material
Acknowledgments
The research was funded by The Helmsley Charitable Trust (to T.S. Stappenbeck, R.J. Xavier, and D.P.B. McGovern), Crohn’s and Colitis Foundation of America (to N.H. Salzman, T.S. Stappenbeck, R.J. Xavier, and C. Huttenhower), and Doris Duke Charitable Foundation grant 2014103 (to T.C. Liu).
Footnotes
Role of funding source: The study sponsor has no role in study design, collection, analysis, and interpretation of data, the writing of the manuscript, and the decision to submit the manuscript for publication.
Conflict of interest: The authors have declared that no conflict of interest exists.
Reference information:JCI Insight. 2016;1(8):e86907. doi:10.1172/jci.insight.86907.
Contributor Information
Ta-Chiang Liu, Email: tliu@path.wustl.edu.
Bhaskar Gurram, Email: gurram9@gmail.com.
Richard Head, Email: rhead@path.wustl.edu.
Vy Lam, Email: vylam03@gmail.com.
Chengwei Luo, Email: cluo@broadinstitute.org.
Yumei Cao, Email: yucao@mcw.edu.
Pippa Simpson, Email: psimpson@mcw.edu.
Michael Hayward, Email: mhayward@mcw.edu.
Pavlos Bousounis, Email: pdbous@gmx.com.
Diana Lerner, Email: dglerner@mcw.edu.
Jose Cabrera, Email: jcabrera@mcw.edu.
Vincent Biank, Email: Vbiank@northshore.org.
Michael Stephens, Email: Stephens.Michael@mayo.edu.
Curtis Huttenhower, Email: chuttenh@hsph.harvard.edu.
Dermot P.B. McGovern, Email: dermot.mcgovern@cshs.org.
Ramnik J. Xavier, Email: xavier@molbio.mgh.harvard.edu.
Nita H. Salzman, Email: nsalzman@mcw.edu.
References
- 1.Jostins L, et al. Host-microbe interactions have shaped the genetic architecture of inflammatory bowel disease. Nature. 2012;491(7422):119–124. doi: 10.1038/nature11582. [DOI] [PMC free article] [PubMed] [Google Scholar]
- 2.Rogler G, Vavricka S. Exposome in IBD: recent insights in environmental factors that influence the onset and course of IBD. Inflamm Bowel Dis. 2015;21(2):400–408. doi: 10.1097/MIB.0000000000000229. [DOI] [PubMed] [Google Scholar]
- 3.Bloom SM, et al. Commensal Bacteroides species induce colitis in host-genotype-specific fashion in a mouse model of inflammatory bowel disease. Cell Host Microbe. 2011;9(5):390–403. doi: 10.1016/j.chom.2011.04.009. [DOI] [PMC free article] [PubMed] [Google Scholar]
- 4.Bevins CL, Salzman NH. Paneth cells, antimicrobial peptides and maintenance of intestinal homeostasis. Nat Rev Microbiol. 2011;9(5):356–368. doi: 10.1038/nrmicro2546. [DOI] [PubMed] [Google Scholar]
- 5.Kaser A, et al. XBP1 links ER stress to intestinal inflammation and confers genetic risk for human inflammatory bowel disease. Cell. 2008;134(5):743–756. doi: 10.1016/j.cell.2008.07.021. [DOI] [PMC free article] [PubMed] [Google Scholar]
- 6.Adolph TE, et al. Paneth cells as a site of origin for intestinal inflammation. Nature. 2013;503(7475):272–276. doi: 10.1038/nature12599. [DOI] [PMC free article] [PubMed] [Google Scholar]
- 7.Salzman NH, et al. Enteric defensins are essential regulators of intestinal microbial ecology. Nat Immunol. 2010;11(1):76–83. doi: 10.1038/ni.1825. [DOI] [PMC free article] [PubMed] [Google Scholar]
- 8.Wilson CL, et al. Regulation of intestinal alpha-defensin activation by the metalloproteinase matrilysin in innate host defense. Science. 1999;286(5437):113–117. doi: 10.1126/science.286.5437.113. [DOI] [PubMed] [Google Scholar]
- 9.Salzman NH, Ghosh D, Huttner KM, Paterson Y, Bevins CL. Protection against enteric salmonellosis in transgenic mice expressing a human intestinal defensin. Nature. 2003;422(6931):522–526. doi: 10.1038/nature01520. [DOI] [PubMed] [Google Scholar]
- 10.Wehkamp J, et al. Reduced Paneth cell alpha-defensins in ileal Crohn’s disease. Proc Natl Acad Sci U S A. 2005;102(50):18129–18134. doi: 10.1073/pnas.0505256102. [DOI] [PMC free article] [PubMed] [Google Scholar]
- 11.Perminow G, et al. Defective paneth cell-mediated host defense in pediatric ileal Crohn’s disease. Am J Gastroenterol. 2010;105(2):452–459. doi: 10.1038/ajg.2009.643. [DOI] [PubMed] [Google Scholar]
- 12.Belkaid Y, Hand TW. Role of the microbiota in immunity and inflammation. Cell. 2014;157(1):121–141. doi: 10.1016/j.cell.2014.03.011. [DOI] [PMC free article] [PubMed] [Google Scholar]
- 13.Kostic AD, Xavier RJ, Gevers D. The microbiome in inflammatory bowel disease: current status and the future ahead. Gastroenterology. 2014;146(6):1489–1499. doi: 10.1053/j.gastro.2014.02.009. [DOI] [PMC free article] [PubMed] [Google Scholar]
- 14.Deuring JJ, et al. Genomic ATG16L1 risk allele-restricted Paneth cell ER stress in quiescent Crohn’s disease. Gut. 2014;63(7):1081–1091. doi: 10.1136/gutjnl-2012-303527. [DOI] [PubMed] [Google Scholar]
- 15.Willing B, et al. Twin studies reveal specific imbalances in the mucosa-associated microbiota of patients with ileal Crohn’s disease. Inflamm Bowel Dis. 2009;15(5):653–660. doi: 10.1002/ibd.20783. [DOI] [PubMed] [Google Scholar]
- 16.Kolho KL, et al. Fecal microbiota in pediatric inflammatory bowel disease and its relation to inflammation. Am J Gastroenterol. 2015;110(6):921–930. doi: 10.1038/ajg.2015.149. [DOI] [PubMed] [Google Scholar]
- 17.Hansen R, et al. Microbiota of de-novo pediatric IBD: increased Faecalibacterium prausnitzii and reduced bacterial diversity in Crohn’s but not in ulcerative colitis. Am J Gastroenterol. 2012;107(12):1913–1922. doi: 10.1038/ajg.2012.335. [DOI] [PubMed] [Google Scholar]
- 18.Schwiertz A, et al. Microbiota in pediatric inflammatory bowel disease. J Pediatr. 2010;157(2):240–244.e1. doi: 10.1016/j.jpeds.2010.02.046. [DOI] [PubMed] [Google Scholar]
- 19.Conte MP, et al. Gut-associated bacterial microbiota in paediatric patients with inflammatory bowel disease. Gut. 2006;55(12):1760–1767. doi: 10.1136/gut.2005.078824. [DOI] [PMC free article] [PubMed] [Google Scholar]
- 20.Manichanh C, et al. Reduced diversity of faecal microbiota in Crohn’s disease revealed by a metagenomic approach. Gut. 2006;55(2):205–211. doi: 10.1136/gut.2005.073817. [DOI] [PMC free article] [PubMed] [Google Scholar]
- 21.Lewis JD, et al. Inflammation, antibiotics, and diet as environmental stressors of the gut microbiome in pediatric Crohn’s disease. Cell Host Microbe. 2015;18(4):489–500. doi: 10.1016/j.chom.2015.09.008. [DOI] [PMC free article] [PubMed] [Google Scholar]
- 22.Gevers D, et al. The treatment-naive microbiome in new-onset Crohn’s disease. Cell Host Microbe. 2014;15(3):382–392. doi: 10.1016/j.chom.2014.02.005. [DOI] [PMC free article] [PubMed] [Google Scholar]
- 23.Schaubeck M, et al. Dysbiotic gut microbiota causes transmissible Crohn’s disease-like ileitis independent of failure in antimicrobial defence. Gut. 2016;65(2):225–237. doi: 10.1136/gutjnl-2015-309333. [DOI] [PMC free article] [PubMed] [Google Scholar]
- 24.Cadwell K, et al. A key role for autophagy and the autophagy gene Atg16l1 in mouse and human intestinal Paneth cells. Nature. 2008;456(7219):259–263. doi: 10.1038/nature07416. [DOI] [PMC free article] [PubMed] [Google Scholar]
- 25.VanDussen KL, et al. Genetic variants synthesize to produce paneth cell phenotypes that define subtypes of Crohn’s disease. Gastroenterology. 2014;146(1):200–209. doi: 10.1053/j.gastro.2013.09.048. [DOI] [PMC free article] [PubMed] [Google Scholar]
- 26.Cadwell K, et al. Virus-plus-susceptibility gene interaction determines Crohn’s disease gene Atg16L1 phenotypes in intestine. Cell. 2010;141(7):1135–1145. doi: 10.1016/j.cell.2010.05.009. [DOI] [PMC free article] [PubMed] [Google Scholar]
- 27.Liu B, et al. Irgm1-deficient mice exhibit Paneth cell abnormalities and increased susceptibility to acute intestinal inflammation. Am J Physiol Gastrointest Liver Physiol. 2013;305(8):G573–G584. doi: 10.1152/ajpgi.00071.2013. [DOI] [PMC free article] [PubMed] [Google Scholar]
- 28.Liu TC, Gao F, McGovern DP, Stappenbeck TS. Spatial and temporal stability of paneth cell phenotypes in Crohn’s disease: implications for prognostic cellular biomarker development. Inflamm Bowel Dis. 2014;20(4):646–651. doi: 10.1097/01.MIB.0000442838.21040.d7. [DOI] [PMC free article] [PubMed] [Google Scholar]
- 29.Haberman Y, et al. Pediatric Crohn disease patients exhibit specific ileal transcriptome and microbiome signature. J Clin Invest. 2014;124(8):3617–3633. doi: 10.1172/JCI75436. [DOI] [PMC free article] [PubMed] [Google Scholar]
- 30.Sokol H, et al. Faecalibacterium prausnitzii is an anti-inflammatory commensal bacterium identified by gut microbiota analysis of Crohn disease patients. Proc Natl Acad Sci U S A. 2008;105(43):16731–16736. doi: 10.1073/pnas.0804812105. [DOI] [PMC free article] [PubMed] [Google Scholar]
- 31.Kobayashi T, et al. Dysbiosis and Staphyloccus aureus colonization drives inflammation in atopic dermatitis. Immunity. 2015;42(4):756–766. doi: 10.1016/j.immuni.2015.03.014. [DOI] [PMC free article] [PubMed] [Google Scholar]
- 32.Dinh DM, et al. Intestinal microbiota, microbial translocation, and systemic inflammation in chronic HIV infection. J Infect Dis. 2015;211(1):19–27. doi: 10.1093/infdis/jiu409. [DOI] [PMC free article] [PubMed] [Google Scholar]
- 33.Courth LF, et al. Crohn’s disease-derived monocytes fail to induce Paneth cell defensins. Proc Natl Acad Sci U S A. 2015;112(45):14000–14005. doi: 10.1073/pnas.1510084112. [DOI] [PMC free article] [PubMed] [Google Scholar]
- 34.Virgin HW, Todd JA. Metagenomics and personalized medicine. Cell. 2011;147(1):44–56. doi: 10.1016/j.cell.2011.09.009. [DOI] [PMC free article] [PubMed] [Google Scholar]
- 35.Tschurtschenthaler M, et al. Type I interferon signalling in the intestinal epithelium affects Paneth cells, microbial ecology and epithelial regeneration. Gut. 2014;63(12):1921–1931. doi: 10.1136/gutjnl-2013-305863. [DOI] [PubMed] [Google Scholar]
- 36.Palm NW, et al. Immunoglobulin A coating identifies colitogenic bacteria in inflammatory bowel disease. Cell. 2014;158(5):1000–1010. doi: 10.1016/j.cell.2014.08.006. [DOI] [PMC free article] [PubMed] [Google Scholar]
- 37.Dalal SR, Chang EB. The microbial basis of inflammatory bowel diseases. J Clin Invest. 2014;124(10):4190–4196. doi: 10.1172/JCI72330. [DOI] [PMC free article] [PubMed] [Google Scholar]
- 38.Huttenhower C, Kostic AD, Xavier RJ. Inflammatory bowel disease as a model for translating the microbiome. Immunity. 2014;40(6):843–854. doi: 10.1016/j.immuni.2014.05.013. [DOI] [PMC free article] [PubMed] [Google Scholar]
- 39.Albenberg LG, Wu GD. Diet and the intestinal microbiome: associations, functions, and implications for health and disease. Gastroenterology. 2014;146(6):1564–1572. doi: 10.1053/j.gastro.2014.01.058. [DOI] [PMC free article] [PubMed] [Google Scholar]
- 40.Chassaing B, Darfeuille-Michaud A. The commensal microbiota and enteropathogens in the pathogenesis of inflammatory bowel diseases. Gastroenterology. 2011;140(6):1720–1728. doi: 10.1053/j.gastro.2011.01.054. [DOI] [PubMed] [Google Scholar]
- 41.Round JL, Mazmanian SK. The gut microbiota shapes intestinal immune responses during health and disease. Nat Rev Immunol. 2009;9(5):313–323. doi: 10.1038/nri2515. [DOI] [PMC free article] [PubMed] [Google Scholar]
- 42.McGovern DP, Kugathasan S, Cho JH. Genetics of inflammatory bowel diseases. Gastroenterology. 2015;149(5):1163–1176.e2. doi: 10.1053/j.gastro.2015.08.001. [DOI] [PMC free article] [PubMed] [Google Scholar]
- 43.Avitzur Y, et al. Mutations in tetratricopeptide repeat domain 7A result in a severe form of very early onset inflammatory bowel disease. Gastroenterology. 2014;146(4):1028–1039. doi: 10.1053/j.gastro.2014.01.015. [DOI] [PMC free article] [PubMed] [Google Scholar]
- 44.Uhlig HH, et al. The diagnostic approach to monogenic very early onset inflammatory bowel disease. Gastroenterology. 2014;147(5):990–1007.e3. doi: 10.1053/j.gastro.2014.07.023. [DOI] [PMC free article] [PubMed] [Google Scholar]
- 45.Shanahan MT, et al. Mouse Paneth cell antimicrobial function is independent of Nod2. Gut. 2014;63(6):903–910. doi: 10.1136/gutjnl-2012-304190. [DOI] [PMC free article] [PubMed] [Google Scholar]
- 46.Hodin CM, et al. Reduced Paneth cell antimicrobial protein levels correlate with activation of the unfolded protein response in the gut of obese individuals. J Pathol. 2011;225(2):276–284. doi: 10.1002/path.2917. [DOI] [PubMed] [Google Scholar]
- 47.van Waveren C, Moraes CT. Transcriptional co-expression and co-regulation of genes coding for components of the oxidative phosphorylation system. BMC Genomics. 2008;9:e86907. doi: 10.1186/1471-2164-9-18. [DOI] [PMC free article] [PubMed] [Google Scholar]
- 48.Yatsunenko T, et al. Human gut microbiome viewed across age and geography. Nature. 2012;486(7402):222–227. doi: 10.1038/nature11053. [DOI] [PMC free article] [PubMed] [Google Scholar]
- 49.Donohoe DR, et al. The microbiome and butyrate regulate energy metabolism and autophagy in the mammalian colon. Cell Metab. 2011;13(5):517–526. doi: 10.1016/j.cmet.2011.02.018. [DOI] [PMC free article] [PubMed] [Google Scholar]
- 50.Mu C, Yang Y, Luo Z, Guan L, Zhu W. The colonic microbiome and epithelial transcriptome are altered in rats fed a high-protein diet compared with a normal-protein diet. J Nutr. 2016;146(3):474–483. doi: 10.3945/jn.115.223990. [DOI] [PubMed] [Google Scholar]
- 51.Bernstein CN, et al. World Gastroenterology Organization Practice Guidelines for the diagnosis and management of IBD in 2010. Inflamm Bowel Dis. 2010;16(1):112–124. doi: 10.1002/ibd.21048. [DOI] [PubMed] [Google Scholar]
- 52.Levine A, et al. Pediatric modification of the Montreal classification for inflammatory bowel disease: the Paris classification. Inflamm Bowel Dis. 2011;17(6):1314–1321. doi: 10.1002/ibd.21493. [DOI] [PubMed] [Google Scholar]
- 53.Caporaso JG, et al. Ultra-high-throughput microbial community analysis on the Illumina HiSeq and MiSeq platforms. ISME J. 2012;6(8):1621–1624. doi: 10.1038/ismej.2012.8. [DOI] [PMC free article] [PubMed] [Google Scholar]
- 54.Caporaso JG, et al. QIIME allows analysis of high-throughput community sequencing data. Nat Methods. 2010;7(5):335–336. doi: 10.1038/nmeth.f.303. [DOI] [PMC free article] [PubMed] [Google Scholar]
- 55.McDonald D, et al. An improved Greengenes taxonomy with explicit ranks for ecological and evolutionary analyses of bacteria and archaea. ISME J. 2012;6(3):610–618. doi: 10.1038/ismej.2011.139. [DOI] [PMC free article] [PubMed] [Google Scholar]
- 56.Knights D, et al. Supervised classification of microbiota mitigates mislabeling errors. ISME J. 2011;5(4):570–573. doi: 10.1038/ismej.2010.148. [DOI] [PMC free article] [PubMed] [Google Scholar]
- 57.Knights D, et al. Bayesian community-wide culture-independent microbial source tracking. Nat Methods. 2011;8(9):761–763. doi: 10.1038/nmeth.1650. [DOI] [PMC free article] [PubMed] [Google Scholar]
- 58.Faith DP, Baker AM. Phylogenetic diversity (PD) and biodiversity conservation: some bioinformatics challenges. Evol Bioinform Online. 2006;2:121–128. [PMC free article] [PubMed] [Google Scholar]
- 59.Vazquez-Baeza Y, Pirrung M, Gonzalez A, Knight R. EMPeror: a tool for visualizing high-throughput microbial community data. Gigascience. 2013;2(1):e86907. doi: 10.1186/2047-217X-2-16. [DOI] [PMC free article] [PubMed] [Google Scholar]
- 60.Welsh EA, Eschrich SA, Berglund AE, Fenstermacher DA. Iterative rank-order normalization of gene expression microarray data. BMC Bioinformatics. 2013;14:e86907. doi: 10.1186/1471-2105-14-153. [DOI] [PMC free article] [PubMed] [Google Scholar]
- 61.Segata N, et al. Metagenomic biomarker discovery and explanation. Genome Biol. 2011;12(6):e86907. doi: 10.1186/gb-2011-12-6-r60. [DOI] [PMC free article] [PubMed] [Google Scholar]
- 62.The Huttenhower Lab GraPhlAn. [August 22, 2012]; [May 4, 2016];Harvard University Web site. http://huttenhower.sph.harvard.edu/graphlan
Associated Data
This section collects any data citations, data availability statements, or supplementary materials included in this article.