

Abstract
BACKGROUND. Kidney transplant biopsies offer an opportunity to understand the pathogenesis of organ fibrosis. We studied the relationships between the time of biopsy after transplant (TxBx), histologic fibrosis, diseases, and transcript expression.
METHODS. Expression microarrays from 681 kidney transplant indication biopsies taken either early (n = 282, <1 year) or late (n = 399, >1 year) after transplant were used to analyze the molecular landscape of fibrosis in relationship to histologic fibrosis and diseases.
RESULTS. Fibrosis was absent at transplantation but was present in some early biopsies by 4 months after transplant, apparently as a self-limited response to donation implantation injury not associated with progression to failure. The molecular phenotype of early biopsies represented the time sequence of the response to wounding: immediate expression of acute kidney injury transcripts, followed by fibrillar collagen transcripts after several weeks, then by the appearance of immunoglobulin and mast cell transcripts after several months as fibrosis appeared. Fibrosis in late biopsies correlated with injury, fibrillar collagen, immunoglobulin, and mast cell transcripts, but these were independent of time. Pathway analysis revealed epithelial response-to-wounding pathways such as Wnt/β-catenin.
CONCLUSION. Fibrosis in late biopsies had different associations because many kidneys had potentially progressive diseases and subsequently failed. Molecular correlations with fibrosis in late biopsies were independent of time, probably because ongoing injury obscured the response-to-wounding time sequence. The results indicate that fibrosis in kidney transplants is driven by nephron injury and that progression to failure reflects continuing injury, not autonomous fibrogenesis.
TRIAL REGISTRATION. INTERCOM study (www.clinicalTrials.gov; NCT01299168).
FUNDING. Canada Foundation for Innovation and Genome Canada.
Transcriptome analysis of human kidney transplant biopsies suggests that fibrosis reflects an adaptive response to injury.
Introduction
In both primary kidney diseases (1) and kidney transplants (2), the extent of fibrosis is a key indicator of stage, progression, and prognosis (3–5). In kidney transplants, fibrosis is absent at the time of implantation due to donor selection but is common in troubled late kidneys (6, 7). The high frequency of fibrosis in late biopsies has given rise to terms that imply processes unique to transplants, including “chronic allograft nephropathy” (8) and “IFTA” (interstitial fibrosis and tubular atrophy) (9, 10). However, while kidney transplants undergo injuries that separate them from native kidneys, such as donation implantation injury (including reperfusion and the early postoperative period) as well as rejection and infection, there is no evidence that the mechanisms of response to injury are unique to transplants. In that sense, the kidney transplant population, with its wealth of biopsies, wide variety of injuries and diseases, and complete follow-up, is an excellent model for understanding the interrelationships among injury, disease, fibrosis, and outcomes in human organs.
Much debate focuses on whether fibrosis in kidney transplants and chronic kidney disease (CKD) is a maladaptive mechanism of progression or an adaptive response to wounding (3). In the maladaptive hypothesis, fibrosis triggered by injury or disease becomes autonomous in a process of primary fibrogenesis. In this view, parenchymal deterioration is actually caused by fibrosis, i.e., myofibroblasts sensing local abnormalities produce contractile elements that distort organ architecture, triggering nephron shutdown (atrophy). In the adaptive view, fibrosis is a manifestation of wound repair in response to nephron injury but is not intrinsically progressive (11). Wound repair has two strategies: (i) restore the previous state, if possible, and (ii) stabilize the site via atrophy fibrosis when restoration fails, recalling the traditional term “healing by second intention”. Thus, the adaptive view conceptualizes fibrosis in kidney transplant biopsies as a response to nephrons lost due to the cumulative burden of injuries that exceed the potential for restoration, including donation-implantation stress, calcineurin inhibitor toxicity (CNIT) (12, 13), episodes of T cell–mediated rejection (TCMR), virus infection, or chronic progressive diseases (14). Supporting this view is the recent discovery that most kidney transplant loss is due to identifiable progressive diseases, particularly antibody-mediated rejection (ABMR) and glomerulonephritis (GN) (15–17). These diseases explain many failures previously attributed to apparently autonomous fibrogenesis (16–18). Fibrosis accompanied by inflammation indicates higher risk for progression than fibrosis alone (19), but this is not because of mysterious injurious inflammation but because inflammation is an early part of the response to wounding, and thus indicates recent and ongoing injury, once rejection and inflammatory diseases are excluded. It is critical to understand these issues in human kidneys: mouse and rat models are potentially misleading because they have a strong tendency to develop progressive glomerular pathology after injury. Nevertheless, rodent models and human kidneys may share some elements that limit nephron survival, such as podocyte loss (20).
Studies of mRNA and miR in kidneys with fibrosis reveal that many molecular changes associated with fibrosis are related to inflammation and matrix remodeling (21–25). We previously reported that fibrosis in human kidney transplants was associated with transcripts expressed in certain inflammatory cells: mast cell transcripts (MCATs) such as carboxypeptidase 3 (CPA3) (26) and immunoglobulin transcripts (IGTs) representing plasma cells (27). Such transcripts do not correlate with TCMR or ABMR. Late kidney transplants with fibrosis also express many transcripts originally identified in kidney transplants with early acute kidney injury (AKI) due to donation-implantation stresses but with no fibrosis (28). When AKI transcripts are increased in late human kidney transplants, they predict progression (14, 29), perhaps reflecting ongoing parenchymal injury induced by diseases. Fibrillar collagen (FICOL) transcripts are also increased both in AKI and in fibrosis (14), reflecting the role of FICOLs in wound repair (30).
The new understanding of the role of progressive diseases, particularly ABMR, in renal transplant loss invites us to reassess some beliefs about fibrosis. We chose to study unselected indication biopsies 3 days to 35 years after transplant as a sample of the prevalent transplant population. The hypothesis was that observed fibrosis in renal transplant indication biopsies reflects wound repair and has different explanations, depending on the source of injury. Thus, in kidneys biopsied early (before 1 year after transplant), mild fibrosis emerges after several months as a consequence of the injury-repair response triggered mainly by donation-implantation stresses, but it is self-limited. However, in kidneys biopsied late (after the first year), fibrosis reflects injury due to late-onset diseases that cause progression to failure. Our strategy was to explore the molecular changes associated with fibrosis in kidney transplant indication biopsies taken at a wide range of times after transplant, from days to decades. We first studied the changes in four previously described sets of fibrosis-associated transcripts (IGTs, ref. 27; MCATs, ref. 26; and AKI and FICOL transcripts, ref. 14); then we explored all fibrosis-associated transcript changes, correcting for the time of the biopsy after transplant (TxBx). We did not include protocol biopsies because (i) they are by definition collected only at predefined times, usually early, minimizing their ability to reveal relationships with time; and (ii) they exclude biopsies for clinical indications and thus miss the diseases associated with progression to failure.
Results
Frequency of fibrosis in kidney transplant indication biopsies.
We studied 681 kidney transplant biopsies with histology scores for fibrosis (ci score: 0–3) and atrophy (ct score: 0–3) (Table 1), from a previously described set of 703 indication biopsies from 564 kidneys, including a discovery set of 403 biopsies (31) and a validation set of 300 biopsies (32). These biopsies were collected prospectively as a sample of troubled kidneys from the prevalent renal transplant population, representing a continuous scale of the TxBx from 3 days to 35 years (33).
Table 1. Demographics and biopsy characteristics.
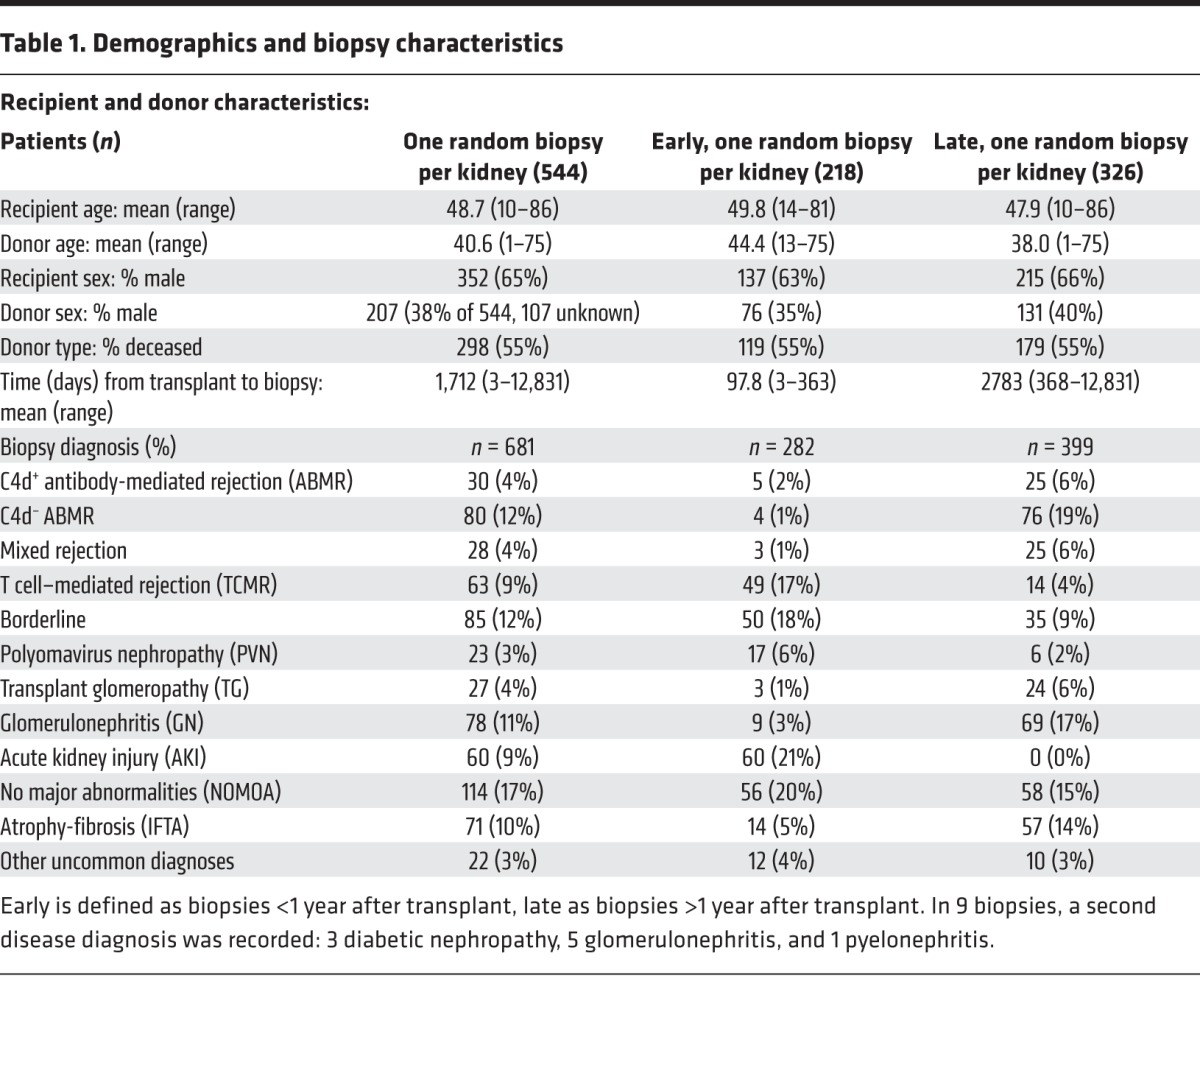
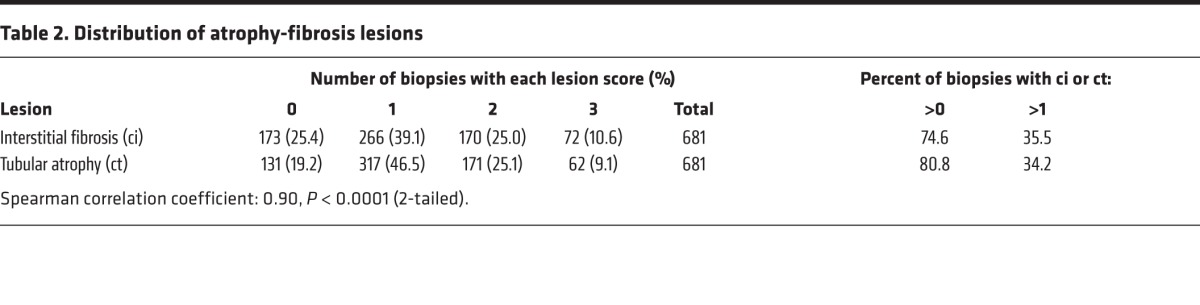
Fibrosis (ci scores >1) was observed in 64% and atrophy (ct scores >1) in 66% of biopsies (Table 2). The striking correlation between ci scores and ct scores (Spearman correlation coefficient = 0.90, P < 0.0001), indicates that associations with fibrosis must be interpreted as associations with atrophy fibrosis. For simplicity, the associations with fibrosis (ci scores) are usually shown in this paper, but similar results were observed for atrophy (ct scores).
Table 2. Distribution of atrophy-fibrosis lesions.
Differences between early and late biopsies with fibrosis.
As expected (34), there was virtually no fibrosis in biopsies taken in the first 7 days after transplant. The percent of biopsies with ci scores >1 increased almost linearly with log TxBx, reaching 63% of indication biopsies taken beyond 10 years after transplant (Figure 1).
Figure 1. Relationship between the histologic scores for fibrosis and time after transplant to biopsy.

Distribution of fibrosis lesions (ci scores) in time intervals after transplant. The block height represents the number of biopsies with each ci score in each time interval. d, days after transplant; mo, months after transplant; yr, years after transplant; N, number of biopsies in each time interval; and %ci>1, percentage of biopsies with ci score >1 in each time interval.
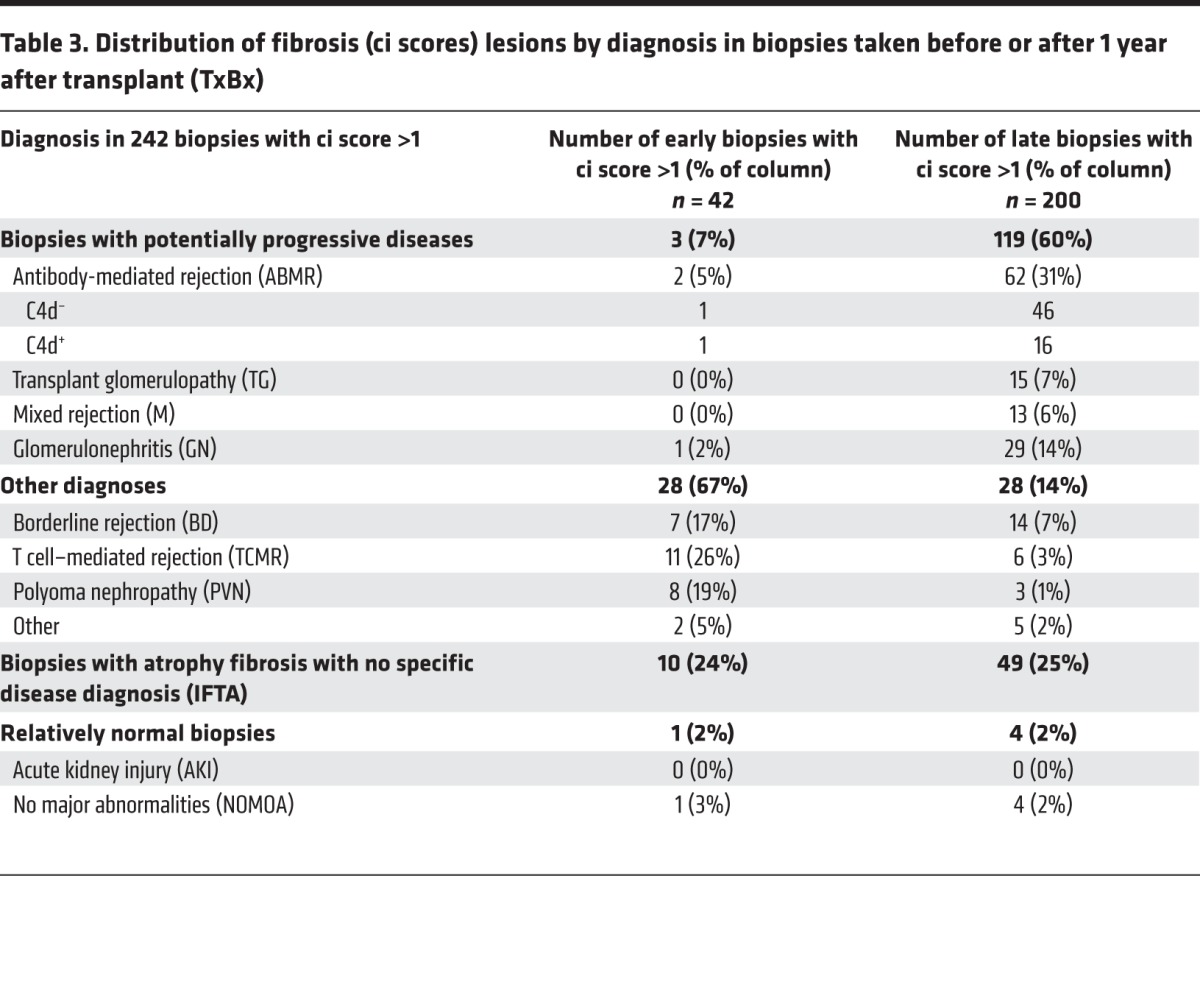
The case mix differed between early and late biopsies with fibrosis (ci scores >1) ; progressive diseases such as ABMR and GN were rare early but frequent late (Table 3). Only 4 of 42 early biopsies with fibrosis (7%) had diagnoses related to ABMR (n = 2) or GN (n = 1). In contrast, 119 of 200 late biopsies with fibrosis (60%) had diagnoses related to ABMR (n = 62) or GN (n = 29). This may underestimate the diseases in late biopsies with fibrosis, since extensive fibrosis interferes with disease diagnosis.
Table 3. Distribution of fibrosis (ci scores) lesions by diagnosis in biopsies taken before or after 1 year after transplant (TxBx).
Progression to failure was infrequent after early biopsies with fibrosis but frequent after late biopsies with fibrosis (Figure 2), reflecting the importance of diseases rather than fibrosis per se (7, 33).
Figure 2. Death-censored transplant survival.

(A and B) Death-censored transplant survival in whole patient population (A) and in population of patients with fibrosis (B). A random biopsy per patient was selected. Bx, biopsy; n, number of biopsies; F, number of failures.
Thus, the prevalent renal transplant universe has two populations of biopsies with fibrosis: early, with low risk of failure; and late, with high risk of failure and often with progressive diseases (16).
Expression of fibrosis-associated transcript sets varies with TxBx in early biopsies.
We explored the relationship between TxBx, fibrosis, and averaged expression scores of the previously described fibrosis-associated transcript sets: IGTs, MCATs, AKI transcripts, and FICOL transcripts (Figure 3).
Figure 3. Moving averages for atrophy fibrosis–related features vs.

time after transplant. The left y axis represents average molecular scores (immunoglobulin [IGT], mast cell [MCAT], acute kidney injury [AKI], and fibrillar collagen [FICOL] transcripts), and the right y axis average histologic ci scores (fibrosis). Biopsies are ordered by time after transplant and then the means (of both the x and y axis values) are plotted based on a sliding window of size 100 biopsies.
In early biopsies, expression of the fibrosis-associated transcript sets evolved markedly with TxBx. AKI and FICOL transcripts were strongly expressed in early biopsies with no fibrosis, reflecting recent injury from the transplant process: AKI transcripts peaked in the first days after transplant, and FICOL transcripts peaked after several weeks. Expression of IGTs and MCATs was very low in biopsies in the first weeks after transplant and rose sharply in biopsies taken after 4 months, paralleling the appearance of fibrosis. Transcript expression was less variable in biopsies taken in the second 6 months of the first year, compatible with the hypothesis that the changes in the first months reflected that the time course of the response to donation implantation injury.
In late biopsies, expression of IGTs and MCATs was high but increased relatively little as TxBx increased, despite the increasing frequency of fibrosis (Figure 3). Mean expression of AKI and FICOL transcript sets was lower in late biopsies than in early biopsies. In late biopsies, the transcript sets showed little or no correlation with TxBx: IGTs = 0.20 and MCATs = 0.22 (both P < 0.05); AKI transcripts = –0.01 and FICOL transcripts = –0.10 (not significant).
In early biopsies, the histologic ci score was significantly correlated with the IGT and MCAT transcript set scores (r = 0.29 and 0.31, respectively, both P < 0.0001), but was not significantly correlated with the AKI and FICOL scores (Table 4). In late biopsies, ci was significantly correlated with the IGT, MCAT, AKI, and FICOL scores (r = 0.33, 0.43, 0.49, and 0.34, respectively, all P < 0.0001).
Table 4. Relationship between the histologic ci score, time after transplant to biopsy (TxBx), and transcript set scores as shown by the Spearman correlation coefficients.
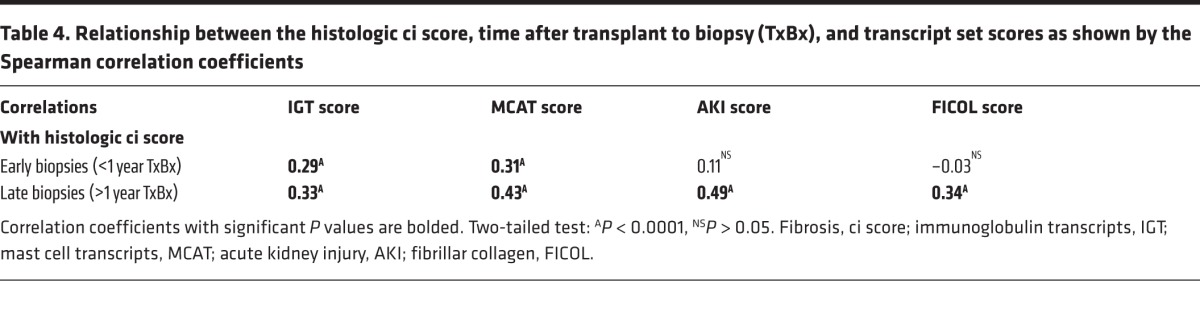
Thus, the relationship between the histologic ci score and the AKI and FICOL transcript scores is different in early versus late biopsies, whereas the relationship between the histologic ci score and the IGTs and MCATs is similar in early and late biopsies. In early biopsies, the fibrosis-associated transcript sets must be seen in the context of the response to wounding triggered by donation-implantation stresses: first, AKI and FICOL transcripts, in kidneys with no fibrosis; after several months, IGT and MCAT expression in kidneys manifesting fibrosis; then, persistent but stable expression. In late biopsies, the fibrosis-associated transcripts were uniformly associated with fibrosis but not with TxBx, suggesting that continuing injury (often from diseases) obscured the time course of the response to wounding.
Conservation of the molecular landscape of fibrosis in discovery and validation sets.
We visualized the association of all interquartile range–filtered (IQR-filtered) probe sets with fibrosis as volcano plots (Figure 4), with the association strength (P value) of each probe set with ci score >1 on the x axis and the fold change between biopsies with ci score >1 vs. ci ≤1 on the y axis. Members of the fibrosis-associated transcript sets are indicated: IGTs, blue; MCATs, red; AKI transcripts, green; and FICOL transcripts, yellow.
Figure 4. The global transcript landscape of atrophy fibrosis in the discovery and validation sets.

The association strength of all IQR-filtered probe sets to atrophy fibrosis (ci score >1) is shown as P values from the ci score >1 Bayes t test (x axis), with the corresponding fold changes (y axis). We visualized probe sets belonging to the following transcript sets: mast cell (MCATs), red; immunoglobulin (IGTs), blue; acute kidney injury (AKI), green; and fibrillar collagen (FICOL), yellow; and remaining interquartile range–filtered (IQR-filtered) probe sets, gray dots. Each symbol represents an individual probe set. (A) Discovery set biopsies only (n = 401). (B) Validation set biopsies only (n = 280). (C and D) Relationship of P values (Spearman correlation coefficient = 0.51) (C) and fold changes (D) (Spearman correlation coefficient = 0.71) between the discovery and validation sets.
The molecular changes were highly conserved between the discovery and validation sets (Figure 4, A vs. B). In both, the highest association strength and fold change was for the IGTs and MCATs. The associations in the discovery set were highly correlated with those in the validation set (r = 0.51; Figure 4C). (The weaker associations in the validation set reflect fewer biopsies in this set.) Similarly, the fold changes in the discovery set correlated with those in the validation set (r = 0.71; Figure 4D).
To illustrate the similarity between the discovery and validation sets, certain transcripts are labeled: MCAT CPA3; AKI transcripts VCAN, NNMT, ITGB6, and MIR21 (an AKI transcript implicated in fibrosis, ref. 35); chemokine CXCL6; and decreased transcript GPR98.
The effect of TxBx on the association of transcripts with fibrosis in the combined set.
Because the associations of transcripts with fibrosis change with TxBx, we studied the associations in two ways: separate analysis of early versus late biopsies and statistical correction for TxBx in the combined set of biopsies (by including log TxBx as a t test covariate; see Methods). Complete raw data are shown in Supplemental Table 1 (supplemental material available online with this article; doi:10.1172/jci.insight.85323DS1.)
The molecular associations with fibrosis (Figure 5A) were different in early versus late biopsies (Figure 5B). In early biopsies, IGTs (blue symbols) had the strongest associations with fibrosis. In late biopsies, AKI transcripts (green symbols) such as VCAN and NNMT had the strongest association with fibrosis, and the association strength of IGTs weakened despite high fold change. The poor association of AKI and FICOL transcripts in early biopsies reflects their induction by donation implantation injury in kidneys without fibrosis.
Figure 5. The dependence of the global transcript landscape of atrophy-fibrosis on time after transplant (TxBx).

The association strength of all interquartile range–filtered (IQR-filtered) probe sets to atrophy fibrosis (ci score >1) as tested by the Bayes t test. Probe sets belonging to the following transcript set were labeled as follows: mast cell transcripts (MCATs), red circles; immunoglobulin transcripts (IGTs), blue circles; acute kidney injury (AKI) transcripts top 30, green circles; all 950 AKI transcripts (IRRAT950), small green circles; fibrillar collagen (FICOL) transcripts, yellow circles; and remaining IQR filtered probe sets, gray dots. Each symbol represents an individual probe set. (A) biopsies taken before 1 year TxBx (n = 282). (B) Biopsies taken after 1 year TxBx (n = 399). (C) All biopsies (n = 681). (D) All biopsies with TxBx correction (n = 681).
In the combined set of early and late biopsies, the associations with fibrosis without TxBx correction resembled those in early biopsies, with IGTs prominent (Figure 5C), whereas after TxBx correction, the associations resemble the late biopsies, with AKI transcripts more prominent (Figure 5D). For example, TxBx correction increased the association strength of typical AKI transcripts: NNMT (rank 226, P = 10–16, to rank 3, P = 10–18); VCAN (rank 358, P = 10–14, to rank 5, P = 10–17); ITGB6 (rank 1,377, P = 10–10, to rank 45, P = 10–18) and MIR21, (rank 5,010, P = 10–6, to rank 71, P = 10–17). TxBx correction also improved P values for FICOL transcripts from about 10–5 to 10–9 but decreased the association strength for IGTs (from about 10–30 to 10–10 ) and for CPA3 (from 10–34 to 10–14).
One increased transcript was unique: CXCL6 was always strongly associated with fibrosis, early or late, with or without TxBx correction, although TxBx correction reduced its association strength (P = 10–32 without TxBx correction to P = 10–22 with TxBx correction).
TxBx correction had less impact on associations for decreased transcripts; they were similar in all late biopsies (Figure 5B) and in the combined set without or with TxBx correction (Figure 5, C and D). For example, the association strength of GPR98 was approximately 10–18 in late biopsies, 10–17 before TxBx correction, and 10–23 after TxBx correction.
Transcripts for factors postulated to be agents in fibrogenesis were generally not among the strongest associations. For example, TGFB1, HIF1A, HIF3A, PDGFA, and CTGF (3) were not in the top 1,000 probe sets (by P value), without or with TxBx correction. One exception was TGFB2, which ranked 42 before TxBx correction and 329 after TxBx correction.
Thus, as with the transcript sets, the associations of individual transcripts with fibrosis were best understood in the context of the response to wounding, in early biopsies from donation implantation and in late biopsies from a variety of insults, particularly progressive diseases.
Expression of the top individual fibrosis-associated transcripts in cultured cell lines.
We used heat maps to visualize the z-scores for the expression values of the top ci score >1–associated transcripts (TxBx corrected) in cell lines using a previously described cell panel (36), to which we added data from keloid fibroblasts (NCBI’s Gene Expression Omnibus [GEO GSE7890]) (ref. 37 and Figure 6). The rows in Figure 6A represent the top 30 increased transcripts (selected by P value) associated with ci score >1. These transcripts clustered the fibroblasts with renal tubular epithelial cells (RPTECs) and umbilical vein endothelial cells (HUVECs), indicating that highly ci-associated transcripts expressed in fibroblasts are also expressed in epithelial and endothelial cells. This cell cluster also contained transcripts with the highest z-scores (e.g., NNMT, OSM, ITGB6, and VCAN), all previously described as AKI transcripts. Other clusters included normal kidney with lymphocytes, and monocytes with DCs and macrophages. CXCL6 was most strongly expressed in HUVECs. Thus, while acknowledging the caveats around interpreting in vivo results based on results with cells lines, the top 30 transcripts that increased in association with fibrosis are expressed in endothelial and epithelial cells, or in inflammatory cells, and no transcript was uniquely expressed in fibroblasts.
Figure 6. Expression of the top 30 TxBx-corrected transcripts associated with high fibrosis across the panel of cultured cells compared with normal kidney control.

(A) Hierarchical clustering of the top increased transcripts. (B) The top decreased transcripts. Rows represent z-scores of transcripts, and columns represent cell types. Hierarchical clustering was done on rows and columns using Euclidean distance as the similarity measure with a full linkage. Human renal tubular epithelial cells, RPTEC; human umbilical vein endothelial cells, HUVEC.
Among 30 decreased transcripts most strongly associated with ci score >1 (Figure 6B), most had their highest z-scores in normal kidneys and their decreased expression reflecting decreased metabolism and energy consumption in injured and atrophic parenchyma.
Pathways and upstream regulators for transcripts with increased expression in fibrosis.
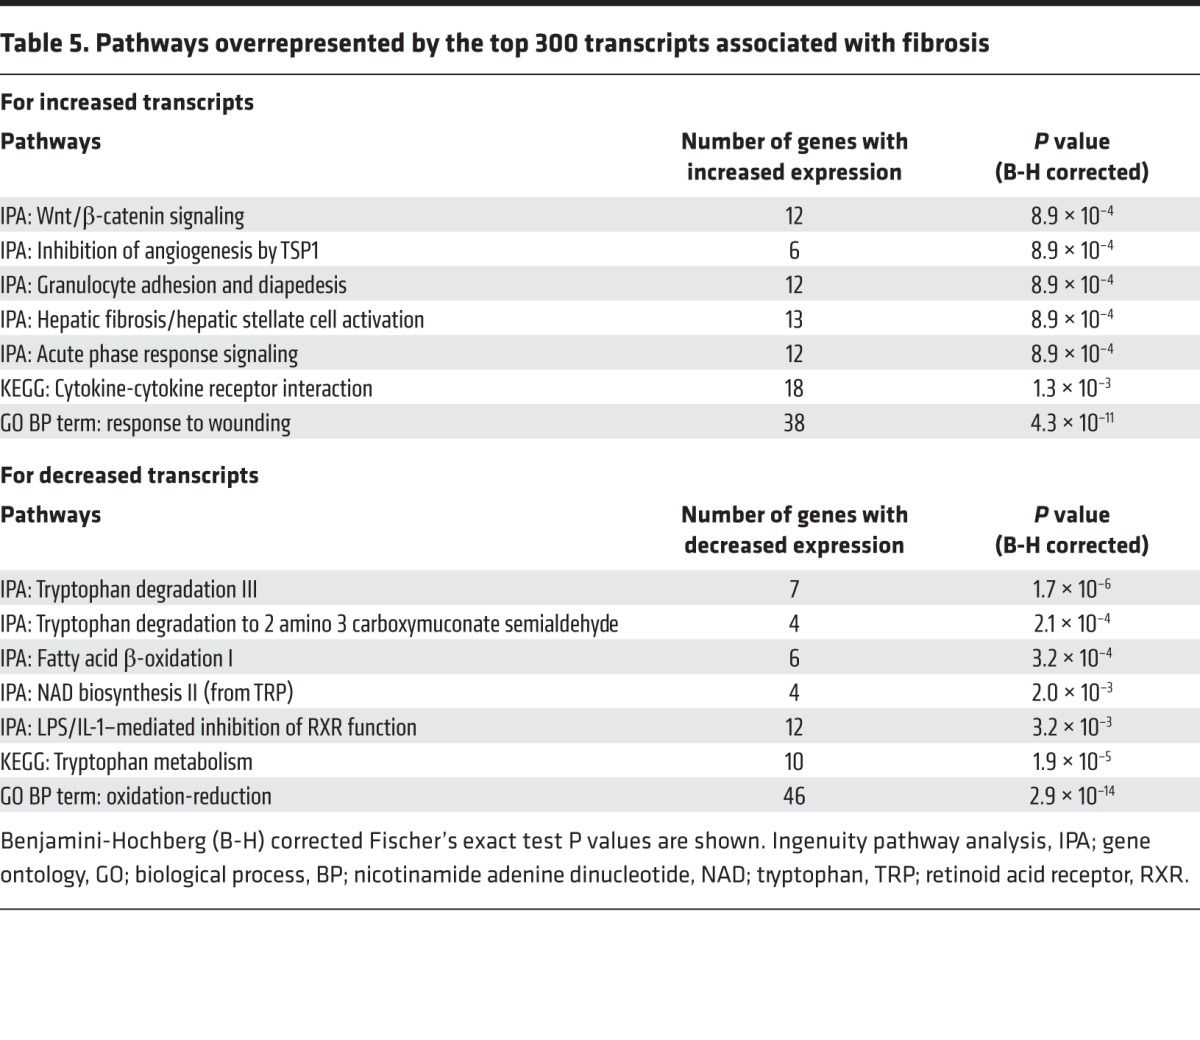
To understand the mechanisms operating, we performed pathway analysis of the top 300 nonredundant transcripts (by P value) increased in biopsies with fibrosis. The strongest association was for the GO BP (Gene Ontology; Biological Process) term response to wounding (P value, P = 10–11). The transcripts overrepresented Ingenuity Pathway Analysis (IPA) canonical pathways related to Wnt/β-catenin signaling, thrombospondin inhibition of angiogenesis (e.g., CD47, CASP3, TGFBR1, TGFBR2) (38), granulocyte movement (presumably reflecting inflammation), fibrosis, and acute phase response (Table 5). Inflammation was represented by the KEGG pathway (www.genome.jp/kegg-bin/show_pathway?hsa04060) related to cytokine activity.
Table 5. Pathways overrepresented by the top 300 transcripts associated with fibrosis.
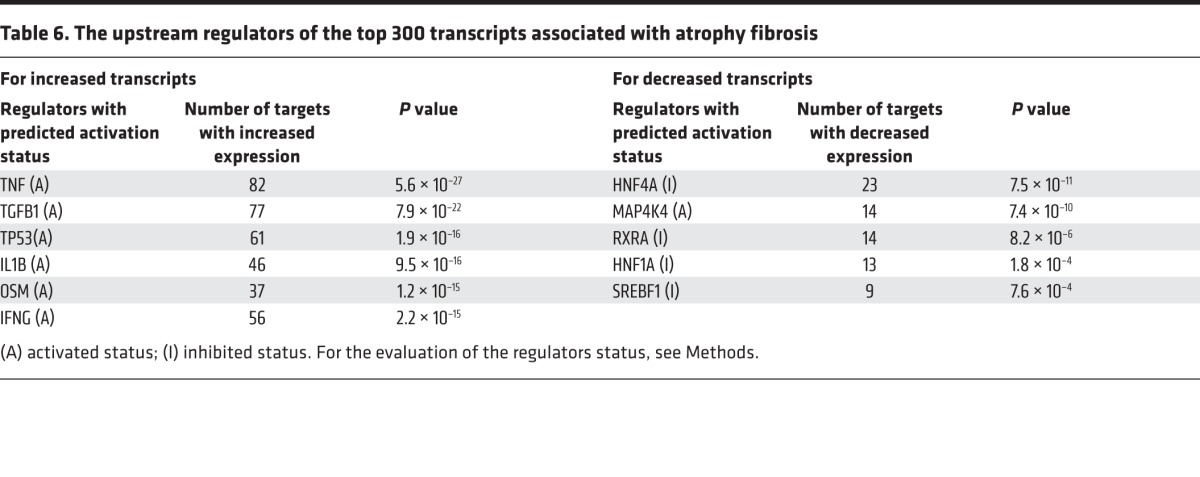
IPA analysis allows identification of potential upstream regulators of transcript changes and ascertains their activated or inhibited status (Table 6; see Methods). The most strongly ci-associated increased transcripts were potentially activated by TNF, TGFB1, TP53, IL1B, OSM, and IFNG.
Table 6. The upstream regulators of the top 300 transcripts associated with atrophy fibrosis.
The findings were similar when only the late biopsies were analyzed without TxBx correction (not shown).
Pathways and upstream regulators for transcripts with decreased expression.
The top 300 transcripts with decreased expression in biopsies with ci score >1 overrepresented the IPA and KEGG pathways related to amino acid metabolism, fatty acid β-oxidation, and energy generation. The GO BP term oxidation reduction had the highest significance (P = 10–14; Table 5). Potential upstream regulators (Table 6) included protein kinase MAP4K4 and transcription factors HNF4A, RXRA, HNF1A, and SREBF1. Activated MAP4K4 inhibits oxidative metabolism (39). The transcription factors, which under normal conditions activate multiple metabolic pathways (see Discussion), had “inhibited” status in atrophy-fibrosis (i.e., reflecting decreased expression of their targets). Analysis of late biopsies confirmed these upstream regulators (not shown). We conclude that these regulators reflect a program that actively suppresses metabolism in kidney tissue developing atrophy fibrosis, by either active inhibition or reduced induction of metabolic genes.
Discussion
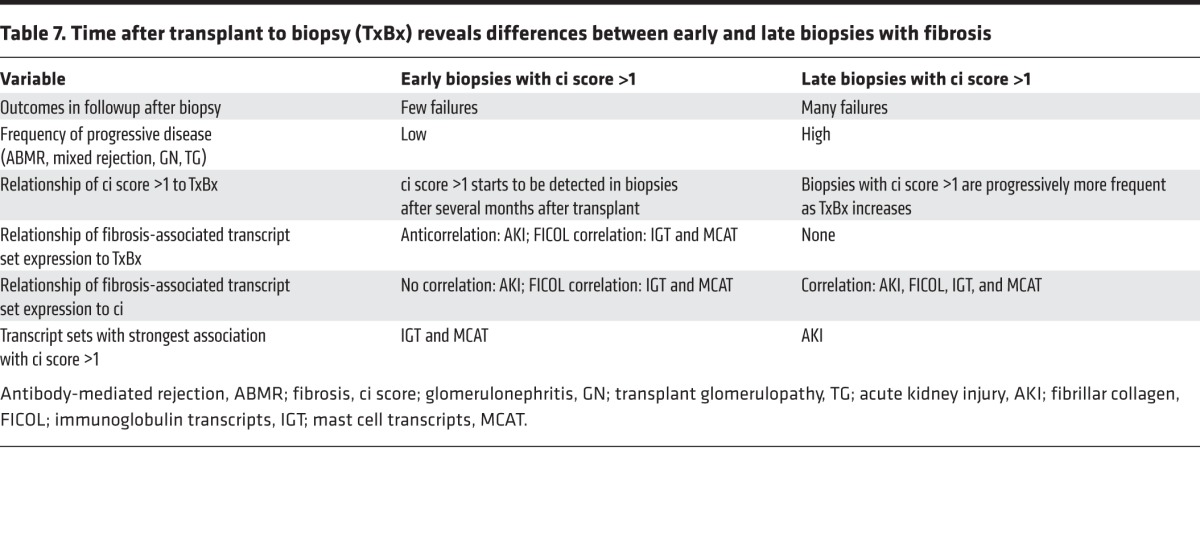
We studied the transcripts associated with fibrosis in kidney transplant indication biopsies collected at various times after transplant in prospective multicenter trials. This study is timely because of a recent ability to diagnose ABMR that had previously been missed in many biopsies with unexplained scarring. Fibrosis was virtually absent in the first weeks after transplantation and began to be observed in biopsies after several months, probably as a consequence of wounding at the time of transplant. Early biopsies with fibrosis did not have diseases such as ABMR or GN and seldom progressed to failure. Most late biopsies with fibrosis had potentially progressive ABMR and GN and often progressed to failure. The molecular features associated with fibrosis were highly conserved in the discovery and validation sets. The early biopsies displayed a dynamic sequence of changes in fibrosis-associated transcript sets: AKI and FICOL transcripts appeared first in biopsies with no fibrosis, and IGT and MCATs appeared at about the onset of observed fibrosis, but all changes stabilized in biopsies in the latter part of the first year. In late biopsies, fibrosis was strongly associated with AKI and FICOL transcripts, IGTs, and MCATs. The results are best explained by conceptualizing fibrosis, or more properly atrophy fibrosis, as a late stage of the nephron response to wounding following the nephron commitment to shut down irreversibly, with remodeling of the adjacent tissues. The results shift the focus from fibrosis to the insult-inducing injury, which varies with TxBx but is mainly the universal stress of donation implantation in early biopsies (40, 41), and continuing injuries in late biopsies, often from progressive diseases. The case mix represented in this collection of indication biopsies is determined by TxBx, as summarized in Table 7.
Table 7. Time after transplant to biopsy (TxBx) reveals differences between early and late biopsies with fibrosis.
Representing implantation injury but relatively free from progressive diseases, early indication biopsies provide an opportunity to view the dynamic sequence of molecular changes after parenchymal injury, leading to the appearance of mild fibrosis in some biopsies in the ensuing months. The sequence as observed in biopsies taken at different TxBx was elevated AKI transcripts, peaking very early; followed within weeks by a peak in FICOL transcripts; followed after several months by the rise of IGTs and MCATs paralleling the emergence of observable atrophy-fibrosis; all tending to become fixed after 6 months. The AKI and FICOL changes in the first weeks recall the time course of early mouse isografts: 18 mouse orthologs of AKI transcripts (28) and eight mouse orthologs of the FICOL transcripts are induced in mouse model of kidney transplant injury and then slowly decline (42). In human transplants in the present study, AKI and FICOL transcript expression slowly declines as IGTs, MCATs, and fibrosis appear in the kidneys, probably in tissue committed to nephron shutdown. Despite some nephron loss and fibrosis, early kidneys do not progress to failure because the injury is self-limited, not ongoing. The results place the problem of renal fibrosis as part of the problem of the renal response to wounding, not as an autonomous process, and highlight the need to understand how the nephron decision is determined.
Inflammatory cells play many roles in wound repair and should not be assumed to be aggressive once inflammatory diseases such as ABMR, TCMR, and GN are excluded, since inflammation is a characteristic of progressing kidney diseases (43). IGTs (representing plasma cells) or MCATs such as CPA3 are strongly linked to fibrosis but not to TCMR (36), ABMR (44), or rejection in general (45). Confounding associations may operate in a few biopsies: for example, plasma cells are sometimes observed in TCMR (46–48) and in BK nephropathy (49). However, exclusion of biopsies with TCMR and BK did not change the main findings (data not shown). Mast cells are associated with fibrosis in animal models (50, 51), and our results suggest that they are a feature of intermediate phase response of tissue undergoing nephron shutdown and remodeling (52). As stated in the Introduction, the association of inflammation with higher risk of progression may be that inflammation reflects relatively recent and active nephron wounding (53, 54).
Many factors contribute to the emergence of atrophy fibrosis after kidney injury, including the extent of injury (55), aging, and related changes such as somatic cell senescence (55); nephrotoxicity from CNI drugs (56); and TCMR and BK nephropathy episodes. Advanced donor aging can manifest as mild atrophy fibrosis at donation despite donor selection, but it also reduces nephron fitness to withstand stresses such as ABMR (57). CNIT can produce renal fibrosis, but progression to failure from CNIT is now uncommon in renal transplants (15). Interpretation of CNI effects is complicated by era differences: transplants performed before 2000 were managed with more toxic cyclosporine-based protocols compared with recent protocols (15, 18, 58) with tacrolimus-mycophenolate, which produce less atrophy scarring (59–61).
Our findings suggest a model in which parenchymal wounding, regardless of time after transplant, triggers a prolonged time-dependent response-to-wounding program in the affected nephrons (Figure 7). This process requires a decision (probably relatively soon after the injury) either to restore nephron integrity or to proceed to irreversible nephron shutdown with stabilization of the tissue via atrophy fibrosis. In this nephron-centered model, the adaptive response to wounding in the nephron and its supporting tissues includes temporary reduction of function (functio laesa) and ultimately aims to restore function with minimal residual changes. When this is not feasible for a particular nephron, the site is stabilized by permanent shutdown with atrophy fibrosis. The AKI and FICOL transcripts reflect this program (e.g., expression of ITGB6 and VCAN). Once the decision is made that the nephron cannot be restored to acceptable standards, the program switches to irreversible nephron shutdown, manifested as atrophy fibrosis accompanied for some months by a local inflammatory infiltrate that includes plasma cells and mast cells. This response to wounding can be followed in the first year because the time of injury is known and the injury is not continuing; the dominant insult is the injury at donation implantation, including the early postoperative period. Once late diseases and injuries start (around the end of the first year), new waves of injury begin and continue, telescoping the time-dependent changes.
Figure 7. The nephron-centric model of renal transplant fibrosis based on the events in the first year after transplant as reflected in early indication biopsies.

This model reflects the findings in the present study, placing atrophy-fibrosis in the general context of response to wounding and particularly in relationship to the nephron decision to either restore function or shut down. The model assumes that many factors can influence the nephron decision, including severity of wounding, biological aging and somatic cell senescence, and podocyte numbers, with tubuloglomerular feedback as an effector-controlling filtration. The model postulates that similar changes occur in late kidneys with injury due to diseases or other stresses but that the time series is obscured by the ongoing injuries. AKI, acute kidney injury.
While the orchestration of these events remains poorly understood, pathway analysis suggests roles for certain upstream regulators, particularly IL1B, OSM, TNF, IFNG, and TGFB1 (21). IL1B, TNF, and OSM are the part of the inflammasome in macrophages and contribute to the response to wounding (53, 62). It may be significant that OSMR, ITGB6, and MIR21 are among the top TxBx-corrected transcripts. OSM is expressed in several cell types and has been implicated in wound repair and atrophy fibrosis (63, 64). Latent TGFB1 is activated in part by expression of ITGB6 on injured epithelium (58, 65) and has many potential roles in repair, perhaps involving the MIR21 pathway (66). TP53, a stress-associated cell cycle regulator, causes G2/M cell cycle arrest and transcription of TGFB1 in proximal tubules (67). Other ci-associated and AKI transcripts of interest include VCAN (highly expressed in renal epithelial cells) and NNMT (highly expressed in endothelial and epithelial cells).
One transcript with a unique expression pattern was CXCL6, a chemokine associated with pulmonary fibrosis (68) and probably worthy of detailed study. It showed consistent strong association with fibrosis, early and late, with and without TxBx correction; however, it was not strongly induced in AKI. CXCL6 is expressed in endothelial cells, is partially dependent on IFNG, and has been associated with risk of progression to failure (29).
Pathway analysis of fibrosis-associated transcript changes particularly emphasized epithelial events. Increased transcripts reflected a response to wounding elements such as WNT/β-catenin signaling and argue for continuing nephron wounding rather than fibrogenesis per se. WNT/β-catenin signaling has also been implicated in diabetic kidney disease (69) and probably plays a general role in CKD, as does suppression of amino acid catabolism and fatty acid oxidation (ref. 70 and see below). Pathway analysis of the decreased transcripts suggests that nephron atrophy is actively regulated to suppress amino acid and fatty acid metabolism, which is regulated by transcription factors such as RXRA, SREB1, HNF1A, and HNF4A. The RXRA/PPARA heterodimer is required for PPRA transcriptional activity on fatty acid oxidation genes (71). PPARA itself is a major regulator of lipid metabolism, particularly fatty acid utilization (72), and PPARA inhibition results in hypertriglyceridemia (73). Fatty acid oxidation capacity is decreased at the transcript level in native kidneys with fibrosis (70). HNF1A is involved in glucose and amino acid metabolism (74), and its mutations are associated with maturity-onset diabetes (75). SREBF1 isoforms regulate genes related to glucose, lipid, and cholesterol metabolism and are regulated by sterol levels (76, 77). HNF4A is a master regulator of lipid transport and glucose metabolism and also regulates xenobiotic metabolism (78).
The decision to commit to irreversible nephron shutdown and atrophy fibrosis is probably regulated by nephron homeostatic and cybernetic mechanisms and reflects limiting factors such as extent of injury, biological aging, and podocyte numbers. Podocyte loss is a feature of all glomerular diseases in proportion to the rate of progression and is a feature of kidney transplantation (20, 79, 80). Active control of function of each nephron is implicit in the intact nephron hypothesis, which states that even in CKD with the majority of function lost, only intact nephrons are permitted to function and, by implication, severely damaged nephrons are functionally silenced (81). Nephrons have sensors of overall performance: for example, glomerular filtration is regulated by macula densa as a sensor of distal fluid content (82–85). Readings outside of quality limits trigger cessation of function, at least temporarily, to maintain safety and facilitate efforts to restore performance. Similar controls could permanently arrest nephron function and trigger atrophy when efforts to repair have failed to restore the nephron to quality limits that permit function. As mentioned in the Introduction, this is akin to healing by second intention when first intention — full restoration — proves impossible. The corollary is that therapies are more likely to arrest progression when they reduce nephron injury (such as suppression of ABMR or treatment of GN) or prevent nephron shutdown, rather than targeting fibrogenesis per se.
Methods
Patient population, specimens, and data collection.
The study combined two kidney transplant indication biopsy sets: 403 biopsies from the Genome Canada study (31) and 300 from the INTERCOM study (32). However, only 681 of the 703 were analyzed, for which we had fibrosis histology scores (ci scores). Recipient, donor, and biopsy characteristics are provided in Table 1. All biopsies were performed for clinical indications in prospective multicenter studies of consented patients under protocols approved by the relevant institutional review boards. The biopsies were performed between 1 week and 35 years after transplant and included all injury and disease states that commonly affect kidney transplants. Eight additional normal kidney specimens were obtained from native nephrectomies for renal carcinoma. The mean follow-up time was 1,252 days, while the median followup time was 1,013 days, based on a random biopsy per patient.
Fibrosis was assessed by the study pathologists according to the Banff histopathological classification of renal allograft rejection using the trichrome stain. Quantitative criteria for the ci score are: ci = 0, up to 5% of cortical areas; mild ci = 1, 6%–25%; moderate ci = 2, 26%–50%; severe ci = 3, >50% (9). Rejection was diagnosed in compliance with Banff 2007 (10) for TCMR and Banff 2013 (86) for ABMR.
Microarray procedures and data preprocessing.
Microarray data sets were published before (31, 32) and can be found on the GEO, Genome Canada (GSE36059) and INTERCOM (GSE48581). Microarray data preprocessing details and calculation of IGT, MCAT, AKI, and FICOL transcripts set scores are available in Supplemental Methods.
Analysis of transcript expression using the cell culture panel.
Technical details of cell cultures were published before and are provided in Supplemental Methods. We analyzed normalized expression values from HG-U133 Plus 2.0 GeneChips (Affymetrix) using RNA extracted from effector T cells, NK cells, B cells, monocytes, macrophages, DCs, endothelial cells, epithelial cells, and normal kidneys (nephrectomies) (36). Microarray data for keloid fibroblasts was obtained from GEO (GSE7890) (37) and normalized to the remaining samples. Each transcript in each condition was assigned a z-score: normalized expression value minus mean expression value across all conditions, divided by standard deviation.
Pathway analysis.
Transcripts were analyzed using QIAGEN’s IPA (www.qiagen.com/ingenuity), with a focus on the top five (by P value) canonical pathways and upstream regulators. The upstream regulator analysis allows identification of potential regulators of genes belonging to a given set. IPA settings were direct/indirect interaction and concordance with reported change of expression in the IPA Knowledge database. Activation or inhibition status of upstream regulators (IPA) was determined by the z-score (>2, absolute value), based on the direction of fold change for transcripts in a given set. The relationship of transcript expression to other biological processes was tested by the DAVID tool (87) which used KEGG Pathways, and the GO BP. The most significant (by P value) GO term and KEGG pathway was selected. Significance refers to the corrected P values (Benjamini-Hochberg).
Statistics.
To identify the global transcript changes in kidney transplant fibrosis, we compared the transcript-association strength (P value from the unadjusted Bayes t test) and fold change in biopsies with high (ci score >1) versus low or no fibrosis (ci score ≤1) in the discovery set (n = 401) and the validation set (n = 280). All t tests were 2-tailed, and P values less than 0.05 were considered significant. To analyze the effect of TxBx on association strength in the combined set, we analyzed early biopsies (<1 year TxBx, n = 282) and late biopsies (>1 year TxBx, n = 399), and all biopsies (n = 681) without or with TxBx (log10) as a covariable in the t test (see Supplemental Material). We then selected the top 300 (either increased or decreased) fibrosis-associated nonredundant transcripts, by the lowest P values, from the TxBx corrected t test for the pathway analysis.
Study approval.
The study on human kidney biopsies was reviewed and approved by the University of Alberta Health Research Ethics Board, Edmonton, Alberta, Canada (issue no. 5299); University of Illinois Office for the Protection of Research Subjects, Chicago, Illinois, USA (protocol no. 2006–0544); the University of Minnesota, Minneapolis, Minnesota, USA (protocol HSC#0606 M87646); the Hennepin County Medical Center, Minneapolis, Minnesota, USA (protocol HSR#06-2670); and for the INTERCOM study (ClinicalTrials.gov NCT01299168). Patients provided informed consent prior to their participation in the study.
Author contributions
JMV cowrote the first draft of the paper, performed statistical analyses, and prepared figures. KSF cowrote the first draft of the paper, prepared tables, and performed IPA analysis and survival analyses. JR selected and supervised statistical analyses. JC prepared final versions of tables and figures and edited the manuscript. PFH introduced the concept, critically revised the draft, and wrote the final version of the manuscript.
Supplementary Material
Acknowledgments
This research has been supported by funding and/or resources from Novartis Pharma AG, and in the past by Genome Canada, the University of Alberta Hospital Foundation, Roche Molecular Systems, Hoffmann-La Roche Canada Ltd., Canada Foundation for Innovation, the Alberta Ministry of Advanced Education and Technology, the Roche Organ Transplant Research Foundation, and Astellas. P.F. Halloran held a Canada Research Chair in Transplant Immunology until 2008 and currently holds the Muttart Chair in Clinical Immunology.
Footnotes
Conflict of interest: P.F. Halloran holds shares in Transcriptome Sciences Inc., a company with an interest in molecular diagnostics.
Reference information:JCI Insight. 2016;1(1):e85323. doi:10.1172/jci.insight.85323.
References
- 1.Reidy K, Kang HM, Hostetter T, Susztak K. Molecular mechanisms of diabetic kidney disease. J Clin Invest. 2014;124(6):2333–2340. doi: 10.1172/JCI72271. [DOI] [PMC free article] [PubMed] [Google Scholar]
- 2.Boor P, Floege J. Renal allograft fibrosis: biology and therapeutic targets. Am J Transplant. 2015;15(4):863–886. doi: 10.1111/ajt.13180. [DOI] [PubMed] [Google Scholar]
- 3.Rockey DC, Bell PD, Hill JA. Fibrosis — a common pathway to organ injury and failure. N Engl J Med. 2015;372(1):1138–1149. doi: 10.1056/NEJMra1300575. [DOI] [PubMed] [Google Scholar]
- 4.Risdon RA, Sloper JC, de Wardener HE. Relationship between renal function and histological changes found in renal-biopsy specimens from patients with persistent glomerular nephritis. Lancet. 1968;2(7564):363–366. doi: 10.1016/s0140-6736(68)90589-8. [DOI] [PubMed] [Google Scholar]
- 5.Haas M. Chronic allograft nephropathy or interstitial fibrosis and tubular atrophy: what is in a name? Curr Opin Nephrol Hypertens. 2014;23(3):245–250. doi: 10.1097/01.mnh.0000444811.26884.2d. [DOI] [PubMed] [Google Scholar]
- 6.Nankivell BJ, Borrows RJ, Fung CL, O’Connell PJ, Allen RD, Chapman JR. The natural history of chronic allograft nephropathy. N Engl J Med. 2003;349(24):2326–2333. doi: 10.1056/NEJMoa020009. [DOI] [PubMed] [Google Scholar]
- 7.Cosio FG, El TM, Cornell LD, Schinstock CA, Stegall MD. Changing kidney allograft histology early posttransplant: prognostic implications of 1-year protocol biopsies. Am J Transplant. 2016;16(1):194–203. doi: 10.1111/ajt.13423. [DOI] [PubMed] [Google Scholar]
- 8.Solez K, et al. Banff ‘05 Meeting report: Differential diagnosis of chronic allograft injury and elimination of chronic allograft nephropathy (‘CAN’) Am J Transplant. 2007;7(3):518–526. doi: 10.1111/j.1600-6143.2006.01688.x. [DOI] [PubMed] [Google Scholar]
- 9.Racusen LC, et al. The Banff 97 working classification of renal allograft pathology. Kidney Int. 1999;55(2):713–723. doi: 10.1046/j.1523-1755.1999.00299.x. [DOI] [PubMed] [Google Scholar]
- 10.Solez K, et al. Banff 07 classification of renal allograft pathology: updates and future directions. Am J Transplant. 2008;8(4):753–760. doi: 10.1111/j.1600-6143.2008.02159.x. [DOI] [PubMed] [Google Scholar]
- 11.Venkatachalam MA, Weinberg JM, Kriz W, Bidani AK. Failed tubule recovery, AKI-CKD transition, and kidney disease progression. J Am Soc Nephrol. 2015;26(8):1765–1776. doi: 10.1681/ASN.2015010006. [DOI] [PMC free article] [PubMed] [Google Scholar]
- 12.Myers BD, Ross J, Newton L, Luetscher J, Perlroth M. Cyclosporine-associated chronic nephropathy. N Engl J Med. 1984;311(11):699–705. doi: 10.1056/NEJM198409133111103. [DOI] [PubMed] [Google Scholar]
- 13.Nankivell BJ, Borrows RJ, Fung CL, O’Connell PJ, Chapman JR, Allen RD. Calcineurin inhibitor nephrotoxicity: longitudinal assessment by protocol histology. Transplantation. 2004;78(4):557–565. doi: 10.1097/01.TP.0000128636.70499.6E. [DOI] [PubMed] [Google Scholar]
- 14.Famulski KS, Reeve J, de Freitas DG, Kreepala C, Chang J, Halloran PF. Kidney transplants with progressing chronic kidney diseases express high levels of acute kidney injury transcripts. Am J Transplant. 2013;13(3):634–644. doi: 10.1111/ajt.12080. [DOI] [PubMed] [Google Scholar]
- 15.El-Zoghby ZM, et al. Identifying specific causes of kidney allograft loss. Am J Transplant. 2009;9(3):527–535. doi: 10.1111/j.1600-6143.2008.02519.x. [DOI] [PubMed] [Google Scholar]
- 16.Einecke G, et al. Antibody-mediated microcirculation injury is the major cause of late kidney transplant failure. Am J Transplant. 2009;9(11):2520–2531. doi: 10.1111/j.1600-6143.2009.02799.x. [DOI] [PubMed] [Google Scholar]
- 17.Gaston RS, et al. Evidence for antibody-mediated injury as a major determinant of late kidney allograft failure. Transplantation. 2010;90(1):68–74. doi: 10.1097/TP.0b013e3181e065de. [DOI] [PubMed] [Google Scholar]
- 18.Sellares J, et al. Understanding the causes of kidney transplant failure: the dominant role of antibody-mediated rejection and non-adherence. Am J Transplant. 2012;12(2):388–399. doi: 10.1111/j.1600-6143.2011.03840.x. [DOI] [PubMed] [Google Scholar]
- 19.Kotas ME, Medzhitov R. Homeostasis, inflammation, and disease susceptibility. Cell. 2015;160(5):816–827. doi: 10.1016/j.cell.2015.02.010. [DOI] [PMC free article] [PubMed] [Google Scholar]
- 20.Wickman L, et al. Urine podocyte mRNAs, proteinuria, and progression in human glomerular diseases. J Am Soc Nephrol. 2015;24(12):2081–2095. doi: 10.1681/ASN.2013020173. [DOI] [PMC free article] [PubMed] [Google Scholar]
- 21.Park WD, Griffin MD, Cornell LD, Cosio FG, Stegall MD. Fibrosis with inflammation at one year predicts transplant functional decline. J Am Soc Nephrol. 2010;21(11):1987–1997. doi: 10.1681/ASN.2010010049. [DOI] [PMC free article] [PubMed] [Google Scholar]
- 22.Rodder S, Scherer A, Korner M, Marti HP. A subset of metzincins and related genes constitutes a marker of human solid organ fibrosis. Virchows Arch. 2011;458(4):487–496. doi: 10.1007/s00428-011-1052-7. [DOI] [PubMed] [Google Scholar]
- 23.Vitalone MJ, O’Connell PJ, Wavamunno M, Fung CL, Chapman JR, Nankivell BJ. Transcriptome changes of chronic tubulointerstitial damage in early kidney transplantation. Transplantation. 2010;89(5):537–547. doi: 10.1097/TP.0b013e3181ca7389. [DOI] [PubMed] [Google Scholar]
- 24.Scian MJ, et al. MicroRNA profiles in allograft tissues and paired urines associate with chronic allograft dysfunction with IF/TA. Am J Transplant. 2011;11(10):2110–2122. doi: 10.1111/j.1600-6143.2011.03666.x. [DOI] [PMC free article] [PubMed] [Google Scholar]
- 25.Mas VR, Dumur CI, Scian MJ, Gehrau RC, Maluf DG. MicroRNAs as biomarkers in solid organ transplantation. Am J Transplant. 2013;13(1):11–19. doi: 10.1111/j.1600-6143.2012.04313.x. [DOI] [PMC free article] [PubMed] [Google Scholar]
- 26.Mengel M, et al. Molecular correlates of scarring in kidney transplants: the emergence of mast cell transcripts. Am J Transplant. 2009;9(1):169–178. doi: 10.1111/j.1600-6143.2008.02462.x. [DOI] [PubMed] [Google Scholar]
- 27.Einecke G, et al. Expression of B cell and immunoglobulin transcripts is a feature of inflammation in late allografts. Am J Transplant. 2008;8(7):1434–1443. doi: 10.1111/j.1600-6143.2008.02232.x. [DOI] [PubMed] [Google Scholar]
- 28.Famulski KS, et al. Molecular phenotypes of acute kidney injury in human kidney transplants. J Am Soc Nephrol. 2012;23(5):948–958. doi: 10.1681/ASN.2011090887. [DOI] [PMC free article] [PubMed] [Google Scholar]
- 29.Einecke G, et al. A molecular classifier for predicting future graft loss in late kidney transplant biopsies. J Clin Invest. 2010;120(6):1862–1872. doi: 10.1172/JCI41789. [DOI] [PMC free article] [PubMed] [Google Scholar]
- 30.Henderson NC, Forbes SJ. Hepatic fibrogenesis: from within and outwith. Toxicology. 2008;254(3):130–135. doi: 10.1016/j.tox.2008.08.017. [DOI] [PubMed] [Google Scholar]
- 31.Reeve J, et al. Molecular diagnosis of T cell-mediated rejection in human kidney transplant biopsies. Am J Transplant. 2013;13(3):645–655. doi: 10.1111/ajt.12079. [DOI] [PubMed] [Google Scholar]
- 32.Halloran PF, et al. Potential impact of microarray diagnosis of T cell-mediated rejection in kidney transplants: the INTERCOM study. Am J Transplant. 2013;13(9):2352–2363. doi: 10.1111/ajt.12387. [DOI] [PubMed] [Google Scholar]
- 33.Halloran PF, et al. Disappearance of T cell-mediated rejection despite continued antibody-mediated rejection in late kidney transplant recipients. J Am Soc Nephrol. 2015;26(7):1711–1720. doi: 10.1681/ASN.2014060588. [DOI] [PMC free article] [PubMed] [Google Scholar]
- 34.Kreepala C, Famulski KS, Chang J, Halloran PF. Comparing molecular assessment of implantation biopsies with histologic and demographic risk assessment. Am J Transplant. 2013;13(2):415–426. doi: 10.1111/ajt.12043. [DOI] [PubMed] [Google Scholar]
- 35.Chung AC, Lan HY. MicroRNAs in renal fibrosis. Front Physiol. 2015;6:e85323. doi: 10.3389/fphys.2015.00050. [DOI] [PMC free article] [PubMed] [Google Scholar]
- 36.Venner JM, Famulski K, Badr D, Hidalgo LG, Chang J, Halloran PF. Molecular landscape of T cell-mediated rejection in human kidney transplants: Prominence of CTLA4 and PD ligands. Am J Transplant. 2014;14(11):2565–2576. doi: 10.1111/ajt.12946. [DOI] [PubMed] [Google Scholar]
- 37.Smith JC, Boone BE, Opalenik SR, Williams SM, Russell SB. Gene profiling of keloid fibroblasts shows altered expression in multiple fibrosis-associated pathways. J Invest Dermatol. 2008;128(5):1298–1310. doi: 10.1038/sj.jid.5701149. [DOI] [PMC free article] [PubMed] [Google Scholar]
- 38.Lawler PR, Lawler J. Molecular basis for the regulation of angiogenesis by thrombospondin-1 and -2. Cold Spring Harb Perspect Med. 2012;2(5):e85323. doi: 10.1101/cshperspect.a006627. [DOI] [PMC free article] [PubMed] [Google Scholar]
- 39.Puri V, Virbasius JV, Guilherme A, Czech MP. RNAi screens reveal novel metabolic regulators: RIP140, MAP4k4 and the lipid droplet associated fat specific protein (FSP) 27. Acta Physiol (Oxf) 2008;192(1):103–115. doi: 10.1111/j.1748-1716.2007.01786.x. [DOI] [PMC free article] [PubMed] [Google Scholar]
- 40.Mengel M, et al. The molecular phenotype of six-week protocol biopsies from human renal allografts: Reflections of prior injury but not future course. Am J Transplant. 2011;11(4):708–718. doi: 10.1111/j.1600-6143.2010.03339.x. [DOI] [PubMed] [Google Scholar]
- 41.Stegall MD, et al. The histology of solitary renal allografts at 1 and 5 years after transplantation. Am J Transplant. 2011;11(4):698–707. doi: 10.1111/j.1600-6143.2010.03312.x. [DOI] [PubMed] [Google Scholar]
- 42.Famulski KS, et al. Transcriptome analysis reveals heterogeneity in the injury response of kidney transplants. Am J Transplant. 2007;7(11):2483–2495. doi: 10.1111/j.1600-6143.2007.01980.x. [DOI] [PubMed] [Google Scholar]
- 43.Martini S, et al. Integrative biology identifies shared transcriptional networks in CKD. J Am Soc Nephrol. 2014;25(11):2559–2572. doi: 10.1681/ASN.2013080906. [DOI] [PMC free article] [PubMed] [Google Scholar]
- 44.Venner JM, Hidalgo LG, Famulski KS, Chang J, Halloran PF. The molecular landscape of antibody-mediated kidney transplant rejection: Evidence for NK involvement through CD16a Fc receptors. Am J Transplant. 2015;15(5):1336–1348. doi: 10.1111/ajt.13115. [DOI] [PubMed] [Google Scholar]
- 45.Reeve J, et al. Diagnosing rejection in renal transplants: a comparison of molecular- and histopathology-based approaches. Am J Transplant. 2009;9(8):1802–1810. doi: 10.1111/j.1600-6143.2009.02694.x. [DOI] [PubMed] [Google Scholar]
- 46.Hancock WW, Thomson NM, Atkins RC. Composition of interstitial cellular infiltrate identified by monoclonal antibodies in renal biopsies of rejecting human renal allografts. Transplantation. 1983;35(5):458–463. doi: 10.1097/00007890-198305000-00013. [DOI] [PubMed] [Google Scholar]
- 47.Charney DA, Nadasdy T, Lo AW, Racusen LC. Plasma cell-rich acute renal allograft rejection. Transplantation. 1999;68(6):791–797. doi: 10.1097/00007890-199909270-00011. [DOI] [PubMed] [Google Scholar]
- 48.Gartner V, Eigentler TK, Viebahn R. Plasma cell-rich rejection processes in renal transplantation: morphology and prognostic relevance. Transplantation. 2006;81(7):986–991. doi: 10.1097/01.tp.0000215014.40595.ab. [DOI] [PubMed] [Google Scholar]
- 49.Bohl DL, Brennan DC. BK virus nephropathy and kidney transplantation. Clin J Am Soc Nephrol. 2007;2(suppl 1):36–46. doi: 10.2215/CJN.00920207. [DOI] [PubMed] [Google Scholar]
- 50.Timoshanko JR, Kitching AR, Semple TJ, Tipping PG, Holdsworth SR. A pathogenetic role for mast cells in experimental crescentic glomerulonephritis. J Am Soc Nephrol. 2006;17(1):150–159. doi: 10.1681/ASN.2005080799. [DOI] [PubMed] [Google Scholar]
- 51.Veerappan A, et al. Mast cells are required for the development of renal fibrosis in the rodent unilateral ureteral obstruction model. Am J Physiol Renal Physiol. 2012;302(1):F192–F204. doi: 10.1152/ajprenal.00562.2010. [DOI] [PMC free article] [PubMed] [Google Scholar]
- 52.Papadimitriou JC, Drachenberg CB, Ramos E, Ugarte R, Haririan A. Mast cell quantitation in renal transplant biopsy specimens as a potential marker for the cumulative burden of tissue injury. Transplant Proc. 2013;45(4):1469–1471. doi: 10.1016/j.transproceed.2013.01.078. [DOI] [PubMed] [Google Scholar]
- 53.Wick G, et al. The immunology of fibrosis. Annu Rev Immunol. 2013;31:107–135. doi: 10.1146/annurev-immunol-032712-095937. [DOI] [PubMed] [Google Scholar]
- 54.Stegall MD, Gaston RS, Cosio FG, Matas A. Through a glass darkly: seeking clarity in preventing late kidney transplant failure. J Am Soc Nephrol. 2015;26(1):20–29. doi: 10.1681/ASN.2014040378. [DOI] [PMC free article] [PubMed] [Google Scholar]
- 55.Oberhuber R, Ge X, Tullius SG. Donor age-specific injury and immune responses. Am J Transplant. 2012;12(1):38–42. doi: 10.1111/j.1600-6143.2011.03798.x. [DOI] [PubMed] [Google Scholar]
- 56.Maluf DG, et al. Evaluation of molecular profiles in calcineurin inhibitor toxicity post-kidney transplant: input to chronic allograft dysfunction. Am J Transplant. 2014;14(5):1152–1163. doi: 10.1111/ajt.12696. [DOI] [PMC free article] [PubMed] [Google Scholar]
- 57.Loupy A, et al. Molecular microscope strategy to improve risk stratification in early antibody-mediated kidney allograft rejection. J Am Soc Nephrol. 2014;52(10):2267–2277. doi: 10.1681/ASN.2013111149. [DOI] [PMC free article] [PubMed] [Google Scholar]
- 58.Meier-Kriesche HU, et al. Immunosuppression: evolution in practice and trends, 1994–2004. Am J Transplant. 2006;6(5 pt 2):1111–1131. doi: 10.1111/j.1600-6143.2006.01270.x. [DOI] [PubMed] [Google Scholar]
- 59.Ekberg H, et al. Reduced exposure to calcineurin inhibitors in renal transplantation. N Engl J Med. 2007;357(25):2562–2575. doi: 10.1056/NEJMoa067411. [DOI] [PubMed] [Google Scholar]
- 60.Ekberg H, et al. Calcineurin inhibitor minimization in the Symphony study: observational results 3 years after transplantation. Am J Transplant. 2009;9(8):1876–1885. doi: 10.1111/j.1600-6143.2009.02726.x. [DOI] [PubMed] [Google Scholar]
- 61.Flechner SM, et al. De novo kidney transplantation without use of calcineurin inhibitors preserves renal structure and function at two years. Am J Transplant. 2004;4(11):1776–1785. doi: 10.1111/j.1600-6143.2004.00627.x. [DOI] [PubMed] [Google Scholar]
- 62.Einecke G, Mengel M, Hidalgo LG, Allanach K, Famulski KS, Halloran PF. The early course of renal allograft rejection: Defining the time when rejection begins. Am J Transplant. 2009;9(3):483–493. doi: 10.1111/j.1600-6143.2008.02546.x. [DOI] [PubMed] [Google Scholar]
- 63.Luyckx VA, Cairo LV, Compston CA, Phan WL, Mueller TF. Oncostatin M pathway plays a major role in the renal acute phase response. Am J Physiol Renal Physiol. 2009;296(4):F875–F883. doi: 10.1152/ajprenal.90633.2008. [DOI] [PubMed] [Google Scholar]
- 64.Liu Q, et al. Suppressors of cytokine signaling inhibit tubular epithelial cell-myofibroblast transdifferentiation. Am J Nephrol. 2011;34(2):142–151. doi: 10.1159/000329325. [DOI] [PubMed] [Google Scholar]
- 65.Trevillian P, Paul H, Millar E, Hibberd A, Agrez MV. A(v)beta(6) integrin expression in diseased and transplanted kidneys. Kidney Int. 2004;66(4):1423–1433. doi: 10.1111/j.1523-1755.2004.00904.x. [DOI] [PubMed] [Google Scholar]
- 66.Zhong X, Chung ACK, Chen HY, Meng XM, Lan HY. Smad3-mediated upregulation of miR-21 promotes renal fibrosis. J Am Soc Nephrol. 2011;22(9):1668–1681. doi: 10.1681/ASN.2010111168. [DOI] [PMC free article] [PubMed] [Google Scholar]
- 67.Yang L, Besschetnova TY, Brooks CR, Shah JV, Bonventre JV. Epithelial cell cycle arrest in G2/M mediates kidney fibrosis after injury. Nat Med. 2010;16(5):535–543. doi: 10.1038/nm.2144. [DOI] [PMC free article] [PubMed] [Google Scholar]
- 68.Besnard AG, et al. CXCL6 antibody neutralization prevents lung inflammation and fibrosis in mice in the bleomycin model. J Leuk Biol. 2013;94(6):1317–1323. doi: 10.1189/jlb.0313140. [DOI] [PubMed] [Google Scholar]
- 69.Kato H, et al. Wnt/β-catenin pathway in podocytes integrates cell adhesion, differentiation, and survival. J Biol Chem. 2011;286(29):26003–26015. doi: 10.1074/jbc.M111.223164. [DOI] [PMC free article] [PubMed] [Google Scholar]
- 70.Kang HM, et al. Defective fatty acid oxidation in renal tubular epithelial cells has a key role in kidney fibrosis development. Nat Med. 2015;21(1):37–46. doi: 10.1038/nm.3762. [DOI] [PMC free article] [PubMed] [Google Scholar]
- 71.Ahuja HS, Szanto A, Nagy L, Davies PJ. The retinoid X receptor and its ligands: versatile regulators of metabolic function, cell differentiation and cell death. J Biol Regul Homeost Agents. 2003;17(1):29–45. [PubMed] [Google Scholar]
- 72.Wu J, et al. Peroxisome proliferator-activated receptors and renal diseases. Front Biosci (Landmark Ed) 2009;14:995–1009. doi: 10.2741/3291. [DOI] [PubMed] [Google Scholar]
- 73.Lu Y, et al. Periostin promotes liver steatosis and hypertriglyceridemia through downregulation of PPARα. J Clin Invest. 2014;124(8):3501–3513. doi: 10.1172/JCI74438. [DOI] [PMC free article] [PubMed] [Google Scholar]
- 74.Pontoglio M. Hepatocyte nuclear factor 1, a transcription factor at the crossroads of glucose homeostasis. J Am Soc Nephrol. 2000;11(suppl 16):S140–S143. [PubMed] [Google Scholar]
- 75.Estrada K, et al. Association of a low-frequency variant in HNF1A with type 2 diabetes in a Latino population. JAMA. 2014;311(22):2305–2314. doi: 10.1001/jama.2014.6511. [DOI] [PMC free article] [PubMed] [Google Scholar]
- 76.Fernández-Hernando C, Moore KJ. MicroRNA modulation of cholesterol homeostasis. Arterioscler Thromb Vasc Biol. 2011;31(11):2378–2382. doi: 10.1161/ATVBAHA.111.226688. [DOI] [PMC free article] [PubMed] [Google Scholar]
- 77.Colgan SM, Hashimi AA, Austin RC. Endoplasmic reticulum stress and lipid dysregulation. Expert Rev Mol Med. 2011;13:e85323. doi: 10.1017/S1462399410001742. [DOI] [PubMed] [Google Scholar]
- 78.Hwang-Verslues WW, Sladek FM. HNF4α — role in drug metabolism and potential drug target? Curr Opin Pharmacol. 2010;10(6):698–705. doi: 10.1016/j.coph.2010.08.010. [DOI] [PMC free article] [PubMed] [Google Scholar]
- 79.Hodgin JB, et al. Glomerular aging and focal global glomerulosclerosis: a podometric perspective. J Am Soc Nephrol. 2015;26(12):3162–3178. doi: 10.1681/ASN.2014080752. [DOI] [PMC free article] [PubMed] [Google Scholar]
- 80.Yang Y, et al. The two kidney to one kidney transition and transplant glomerulopathy: a podocyte perspective. J Am Soc Nephrol. 2015;26(6):1450–1465. doi: 10.1681/ASN.2014030287. [DOI] [PMC free article] [PubMed] [Google Scholar]
- 81.Bricker NS, Morrin PAF, Kime SW. The pathologic physiology of chronic Bright’s disease. An exposition of the “intact nephron hypothesis”. Am J Med. 1960;28:77–98. doi: 10.1016/0002-9343(60)90225-4. [DOI] [PubMed] [Google Scholar]
- 82.Peti-Peterdi J, Harris RC. Macula densa sensing and signaling mechanisms of renin release. J Am Soc Nephrol. 2010;21(7):1093–1096. doi: 10.1681/ASN.2009070759. [DOI] [PMC free article] [PubMed] [Google Scholar]
- 83.Bell PD, Lapointe JY, Peti-Peterdi J. Macula densa cell signaling. Annu Rev Physiol. 2003;65:481–500. doi: 10.1146/annurev.physiol.65.050102.085730. [DOI] [PubMed] [Google Scholar]
- 84.Schnermann J. Homer W. Smith Award lecture. The juxtaglomerular apparatus: from anatomical peculiarity to physiological relevance. J Am Soc Nephrol. 2003;14(6):1681–1694. doi: 10.1097/01.ASN.0000069221.69551.30. [DOI] [PubMed] [Google Scholar]
- 85.Schnermann J, Levine DZ. Paracrine factors in tubuloglomerular feedback: Adenosine, ATP, and Nitric Oxide. Annu Rev Physiol. 2003;65:501–529. doi: 10.1146/annurev.physiol.65.050102.085738. [DOI] [PubMed] [Google Scholar]
- 86.Haas M, et al. Banff 2013 meeting report: inclusion of c4d-negative antibody-mediated rejection and antibody-associated arterial lesions. Am J Transplant. 2014;14(2):272–283. doi: 10.1111/ajt.12590. [DOI] [PubMed] [Google Scholar]
- 87.Sherman BT, Lempicki RA. Systematic and integrative analysis of large gene lists using DAVID bioinformatics resources. Nat Protoc. 2009;4(1):44–57. doi: 10.1038/nprot.2008.211. [DOI] [PubMed] [Google Scholar]
Associated Data
This section collects any data citations, data availability statements, or supplementary materials included in this article.