Abstract
Necrotizing fasciitis caused by group A streptococcus (GAS) is a life-threatening, rapidly progressing infection. At present, biofilm is not recognized as a potential problem in GAS necrotizing soft tissue infections (NSTI), as it is typically linked to chronic infections or associated with foreign devices. Here, we present a case of a previously healthy male presenting with NSTI caused by GAS. The infection persisted over 24 days, and the surgeon documented the presence of a “thick layer biofilm” in the fascia. Subsequent analysis of NSTI patient tissue biopsies prospectively included in a multicenter study revealed multiple areas of biofilm in 32% of the patients studied. Biopsies associated with biofilm formation were characterized by massive bacterial load, a pronounced inflammatory response, and clinical signs of more severe tissue involvement. In vitro infections of a human skin tissue model with GAS NSTI isolates also revealed multilayered fibrous biofilm structures, which were found to be under the control of the global Nra gene regulator. The finding of GAS biofilm formation in NSTIs emphasizes the urgent need for biofilm to be considered as a potential complicating microbiological feature of GAS NSTI and, consequently, emphasizes reconsideration of antibiotic treatment protocols.
Group A streptococci form biofilm in severe rapidly spreading necrotizing skin and soft tissue infections.
Introduction
Necrotizing fasciitis and other necrotizing soft tissue infections (NSTIs) represent the more severe form of soft tissue infections. They encompass necrotic infections of any layer of the soft tissue compartment and are often associated with systemic toxicity and extensive tissue necrosis. The majority of patients require intensive care and extensive surgical interventions or amputation. Even with optimal treatment, these infections are associated with high mortality rates of 25%–35% (1). Most commonly, NSTIs are classified based on microbiological aetiology with polymicrobial type I NSTIs and the monomicrobial type II predominantly caused by group A streptococcus (GAS) being most prevalent (2). The type II infections caused by GAS tend to occur in younger and healthier individuals and are typically highly aggressive, often complicated by streptococcal toxic shock syndrome (STSS) (3, 4).
The underlying mechanisms making GAS the predominant cause of these infections is poorly understood. Certain types, such as emm1 and emm3, are over-represented in necrotizing fasciitis and STSS cases (5, 6). GAS is equipped with an arsenal of virulence factors that contribute to disease pathogenesis. The surface-associated factors, such as M- and M-like proteins, are important for colonization and immune evasion due to interactions with various host proteins. Different studies have also implicated secreted virulence factors including, among others, SpyCEP, streptolysin S, and SpeB in NSTIs (7–9). Analyses of patient tissue biopsies found GAS NSTI to be characterized by massive bacterial load, presence of several virulence factors, and high amounts of proinflammatory mediators (10–14). Also, viable GAS could be detected in the tissue for an extended period of time, despite i.v. antibiotic therapy, indicating a bacterial persistence at the tissue site of infection (14). Here, we report on a case with a GAS NSTI persisting for over 24 days, and we explore whether this could be linked to biofilm formation. Through analyses of biopsies from GAS NSTI patients, we demonstrate for the first time to our knowledge biofilm formation at the infected tissue site. This finding was further validated in an in vitro infection model utilizing engineered human 3D skin tissue in which clinical NSTI GAS strains readily formed biofilm communities.
Results
Case report.
A previously fit 30-year-old male was hospitalized with pain and discoloration of the lower leg, resulting from GAS necrotizing fasciitis. He fulfilled the criteria for STSS and was treated with fluid resuscitation, inotropes, mechanical ventilation support, and renal replacement therapy. He received empirical treatment with i.v. clindamycin 600 mg q.i.d. and meropenem 1 g b.i.d. With continuing septic parameters, he underwent a “second look” procedure and exploration of the left thigh. Meropenem was changed to benzylpenicillin (1.2 g q.i.d.) on day 3, and clindamycin continued. GAS (serotype emm12) was cultured from all tissues and fluids. After 8 days in intensive care, he was discharged to the ward. He remained clinically stable though still intermittently pyrexial and tachycardic. Repeated blood cultures remained negative. Twenty-three days after admission, and on no antimicrobials, the patient was transferred to the Royal Devon & Exeter hospital for skin grafting of lower leg wounds. On arrival, skin grafting was postponed due to tachycardia of 113 bpm, pyrexia of 39.2°C and a rising CRP (107 g/l). There was no apparent focus of infection. His hemoglobin was 103 g/l, his peripheral WBC were 10.6 × 10⁹/l, and his platelets were 537 × 109/l. Clindamycin (i.v.) was recommenced at a higher dosage of 1.2 g every 6 hours with the addition of i.v. piperacillin-tazobactam (tazocin, 4.5 g every 8 hours). Blood cultures were negative. At reexploration of the wounds, the surgeon documented the presence of a thick layer biofilm and pus covering both medial and lateral fasciotomy wounds. GAS serotype emm12 was again isolated from tissue samples and swabs from successive debridements. Clindamycin was continued and tazocin was replaced by benzylpenicillin (2.4 g every 6 hours). He also underwent surface decolonisation for 10 days with nasal mupirocin, chlorhexidine 4% body washes, and wound irrigation. Inflammatory markers settled quickly, and he rapidly improved. With swabs negative for GAS, he underwent successful skin grafting 44 days after initial presentation.
Similarly, in a prospective study on NSTI, one case had a prolonged course of a GAS infection of the thigh, which upon surgical exploration revealed a gelatinous mass along the muscle; biofilm formation was considered.
Biofilm in 3D human skin tissue.
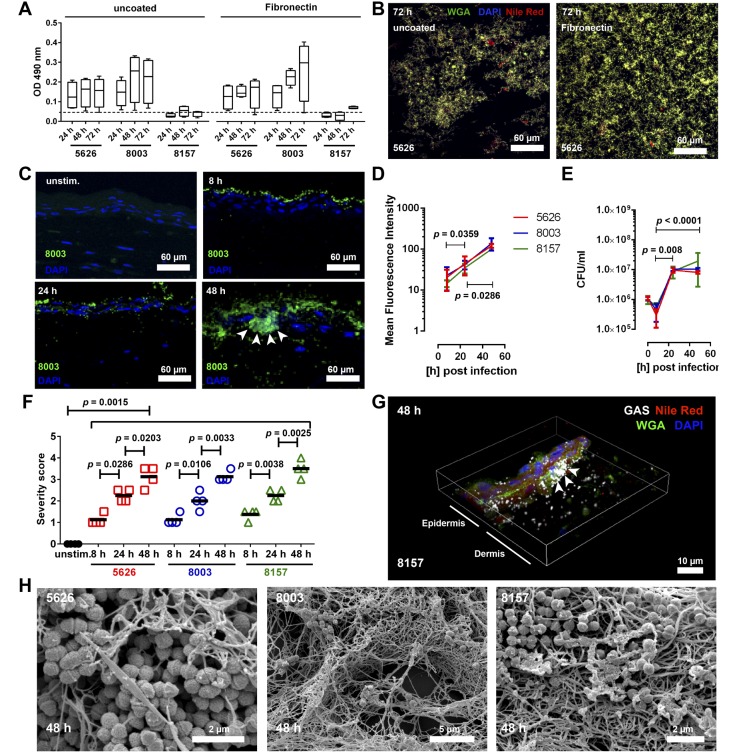
The observation of biofilm in these cases led us to explore whether biofilm is a feature of GAS NSTI. Three NSTI strains of the 2 dominant emm-types (emm1 strain 8157 and emm3 strains 5626 and 8003) were tested using classical biofilm readouts on polystyrene or glass surfaces. Both emm3 strains were able to form biofilm on uncoated and fibronectin-coated polystyrene surfaces, while only 5626 formed biofilm on glass surfaces (Figure 1, A and B, and Supplemental Figure 1A; supplemental material available online with this article; doi:10.1172/jci.insight.87882DS1). In contrast, emm1 strain 8157 showed borderline or no biofilm formation under all conditions tested (Figure 1A and Supplemental Table 2). Collagens I and IV suppressed biofilm formation in all settings analyzed (Supplemental Table 2).
Figure 1. Group A streptococcal (GAS) infections in 3D skin tissue result in biofilm formation.
(A) Quantitative analyses of biofilm formation of clinical GAS necrotizing soft tissue infection isolates on uncoated or fibronectin-coated polystyrene surfaces at indicated time points. The box and whisker plots show median values with min to max distribution (n = 4). (B) Immunofluorescence images of 5626 strain forming biofilm (wheat germ agglutinin [WGA], DAPI, Nile red positive) on uncoated (left panel) and fibronectin-coated (right panel) glass surfaces (original magnification, ×60). Individual stainings are shown in Supplemental Figure 1A. Representative images from 1 of 4 experiments are shown. (C) Representative immunofluorescence images of GAS 800 infected tissue models (original magnification, ×40). GAS is shown in green, and bacterial aggregations are indicated by arrows. Mean fluorescent intensity (MFI) of stained tissue (D), and CFU counts of bacteria recovered from skin models (E). The data represent the mean values ± SD (n ≥ 3). (F) Blinded scoring of tissue pathology of the skin model after infection. Histological severity scoring was performed in a blinded fashion using the following criteria: 0, unaffected; 0.5–1, mild injury with minor epithelial loosening; 1.5–2, moderate injury with some epithelial disruption; 2.5–3, severe injury with continuous epithelial disruption and some detachment; and > 4, extensive injury, massive epithelial disruption, and detachment. Each symbol represents one independent experiment. Horizontal lines denote median values (n = 4). (G) 3D reconstruction of immunostained biofilm in 8157 infected model (original magnification, ×60). GAS-specific antibody, WGA, and Nile red were used. Arrows indicate multilayered bacterial aggregations. (H) SEM images of bacterial biofilm in the skin tissue model 48 hours after infection with indicated clinical isolates (original magnification, ×10,000). The level of significance was determined using 1-way ANOVA with Dunnett’s multiple comparison test.
Next, we employed a 3D tissue model of human skin that recapitulates key anatomical and functional features of normal skin, including a dermal layer and a stratified epidermis, as well as key structural framework proteins (15). All 3 GAS strains were able to efficiently infect the tissue (Figure 1C and Supplemental Figure 1B). At 8 hours after infection, the bacteria were found mainly associated with the stratum corneum, while at later time points, bacteria disseminated throughout the whole tissue. GAS immunostaining revealed formation of bacterial aggregates, and it significantly increased bacterial load during the course of infection (Figure 1D). Equal bacterial loads were observed in models infected with either GAS strain, as evident by the mean fluorescence intensity (MFI) and CFU determinations (Figure 1, D and E). As a consequence of infection, severe tissue damage, i.e., loss of epithelial integrity, was observed already at 8 hours and increased significantly over time (Figure 1F and Supplemental Figure 1C).
The bacterial aggregates were indicative of potential biofilm, and to verify this, confocal laser scan microscopy (CLSM) and scanning electron microscopy (SEM) were employed. Biofilm structures consisting of bacterial exopolysaccharides (WGA), lipids (Nile red), and DNA (DAPI) were found within and between the dermal and epidermal structures (Figure 1G and Supplemental Figure 2). Similarly, SEM analyses confirmed 3D, multilayered, fibrous bacterial biofilm structures (Figure 1H).
Biofilm in NSTI patient tissue biopsies.
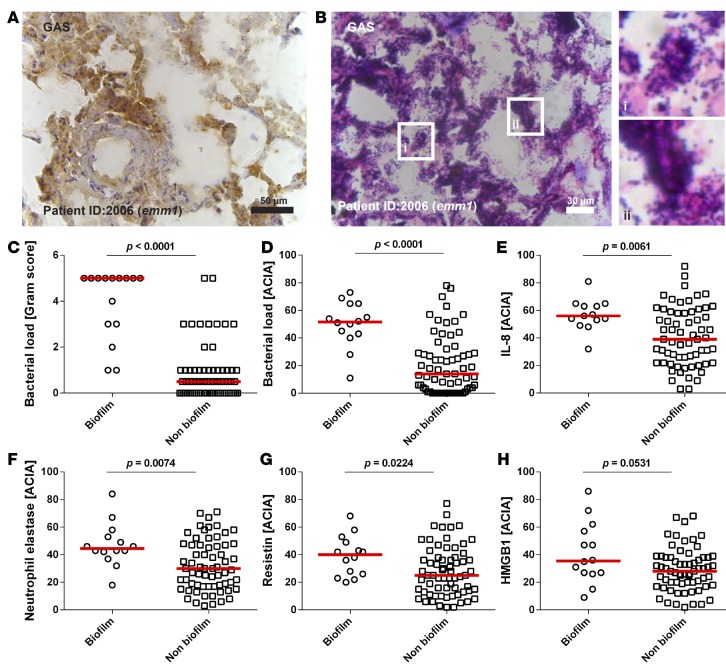
Further analyses included multiple biopsies collected at repeated surgery from the sites of infection (e.g., fascia, soft tissue, and muscle) of 31 GAS NSTI patients. Varying bacterial load identified by Gram- and GAS-specific staining was noted both between patients and between biopsies collected from the same patient (Figure 2, A and B). Bacteria appeared as single cocci or in chains, and in 10 patients (32%), aggregations consistent with biofilm-communities were evident (Figure 2B). The biopsies were divided into biofilm versus no biofilm based on their Gram-staining pattern, revealing a significantly higher bacterial load in biofilm-positive biopsies (Figure 2, C and D). Also, significantly higher neutrophil infiltration, resistin, and IL-8 responses were shown in biopsies with biofilm, as compared with biopsies with no biofilm (Figure 2, E–G, Supplemental Figure 3). In contrast, HMGB1, a marker of necrosis, was equally high in biopsies with or without biofilm (Figure 2H).
Figure 2. Biofilm-positive patient biopsies have higher bacterial load and inflammatory responses.
Identification of bacteria in patient biopsies visualized by immunohistochemistry (A) and Gram-staining (B); original magnifications, ×40, and inset figure in B, ×63. (C) Analysis of bacterial load by Gram-scoring. Semiquantitative acquired computerized image analyses (ACIA) of immunohistochemical stainings of group A streptocci (GAS) (D), IL-8 (E), infiltrating neutrophils (F), resistin (G), and HMGB1 (H) in patient biopsies divided based on presence of biofilm or nonbiofilm. Each symbol represents the mean value of the ACIA value in one patient biopsy. The horizontal lines denote the median. The level of significance was determined using 2-tailed Mann-Whitney U test.
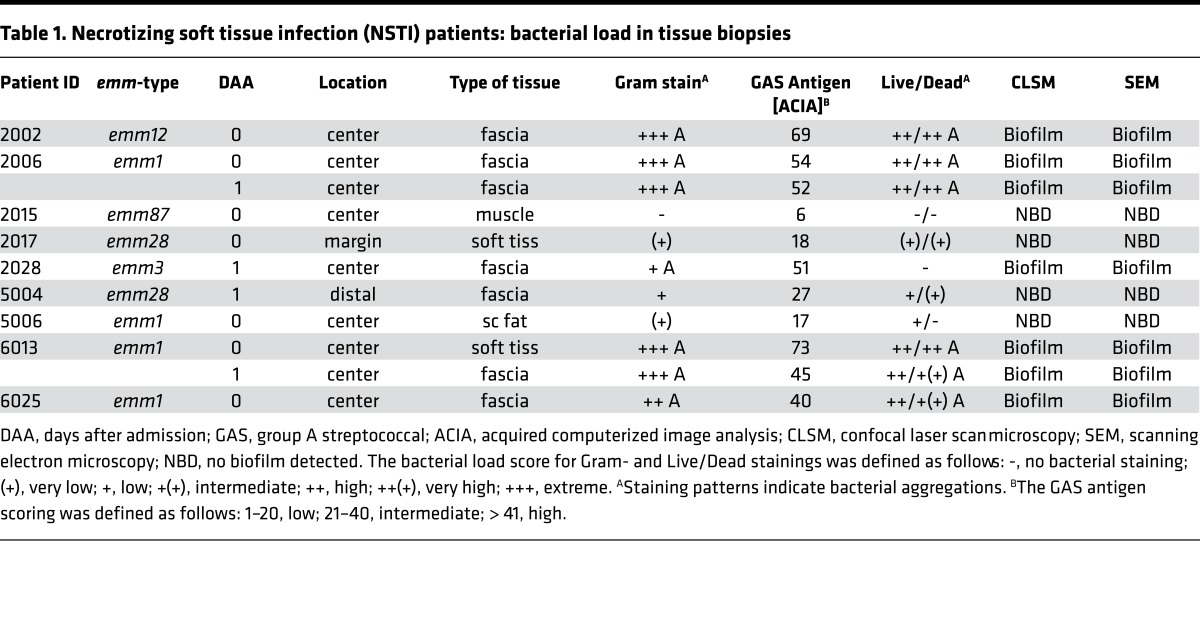
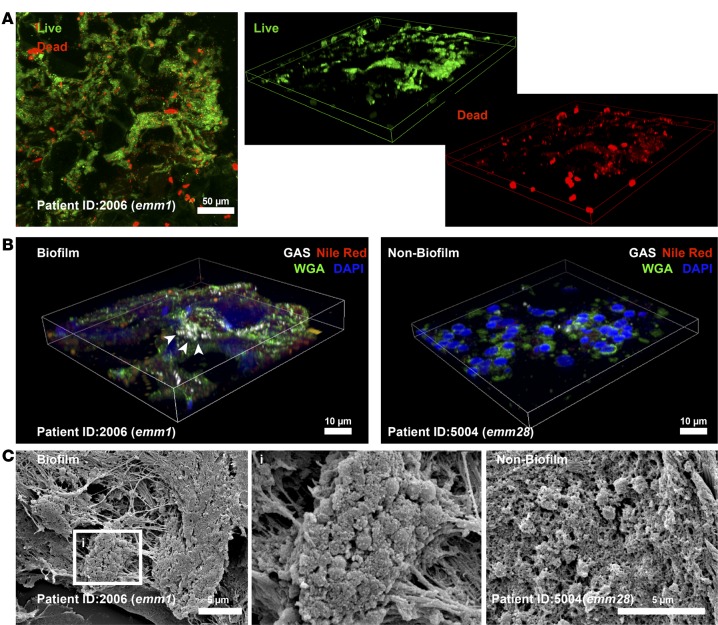
To further characterize biofilm in patients, selected biopsies — based on diversity of serotypes, Gram-staining pattern, and high versus low bacterial load — from 9 patients were analyzed in more detail (Table 1). All patients, except one, had severe sepsis or septic shock and a high SAPSII score (Supplemental Table 1). Six patients (2002, 2006, 2028, 5004, 6013, and 6025) were classified as having more severe NSTI, i.e. necrotizing fasciitis evident by grayish fascia and fascia dishwater fluid. First, a bacterial viability stain was used, revealing a mixture of viable and dead bacteria in the biopsies (Figure 3A and Table 1). In biofilm-positive biopsies, 3D reconstructions revealed the multilayered nature of the bacterial aggregates consisting of predominantly viable (green) cocci, as well as dead (red) cocci and a diffuse red staining pattern, indicative of extracellular DNA. CLSM analysis of biopsies stained with WGA lectin, and lipophilic Nile red in combination with GAS-antisera, confirmed biofilm-like aggregations in the 5 biofilm positive patients, whereas the biofilm negative patients showed single-cocci staining pattern (Figure 3B, Table 1, and Supplemental Figure 4). Biopsies from the 5 patients with high bacterial load and biofilm-like structures (Table 1) were selected for SEM analysis, which confirmed bacteria embedded in biofilm communities of amorphous or fibrous structures (Table 1 and Figure 3C). In contrast, SEM analysis of patient biopsies with no aggregation and low bacterial load detected only single cocci (Supplemental Figure 4).
Table 1. Necrotizing soft tissue infection (NSTI) patients: bacterial load in tissue biopsies.
Figure 3. Biofilm in tissue biopsies from patients with group A streptococcal (GAS) necrotizing soft tissue infections.
Identification of bacteria in patient biopsies visualized by bacterial viability staining including a 3D reconstruction discriminating viable (green) and dead (red) bacteria (A) (original magnification, ×40). (B) A 3D reconstruction of immunostained biofilm- and non–biofilm-associated patient biopsies with GAS-specific antibody, wheat germ agglutinin (WGA), and Nile red (original magnification, ×63). Arrows indicate multilayered bacterial aggregations. (C) Representative scanning electron micrographs of GAS biofilm and nonbiofilm single-cocci areas in patient biopsies. The boxed area (i) is shown in larger magnification (×10,000) to visualize the biofilm community.
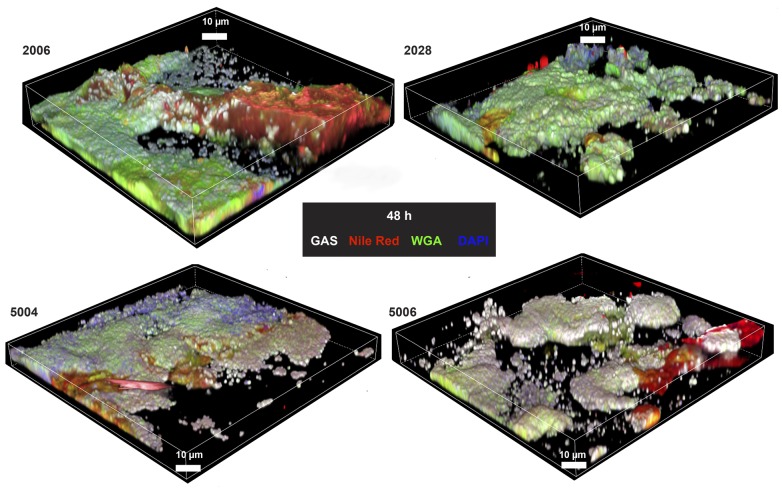
Four selected strains, e.g. 2006 and 2028 from biofilm-positive patients and 5004 and 5006 strains from biofilm-negative patients, were tested for ability to form biofilm in the skin tissue model. CLSM analysis 48 hours after infection identified pronounced biofilm communities in all conditions tested and by all 4 strains (Figure 4 and Supplemental Figures 5 and 6).
Figure 4. Biofilm formation in skin tissue models infected with group A streptococal (GAS) necrotizing soft tissue infection isolates associated with biofilm or nonbiofilm.
Representative 3D reconstructions of immunofluorescence images of biofilm after 48 hours of skin model infections with strains from patients with biofilm-positive biopsies (2006 and 2028) or biofilm-negative biopsies (5004 and 5006) are shown (original magnification, ×100). GAS-specific antibody, wheat germ agglutinin (WGA), and Nile red were used.
Contribution of Nra, but not CovR/S, to biofilm formation.
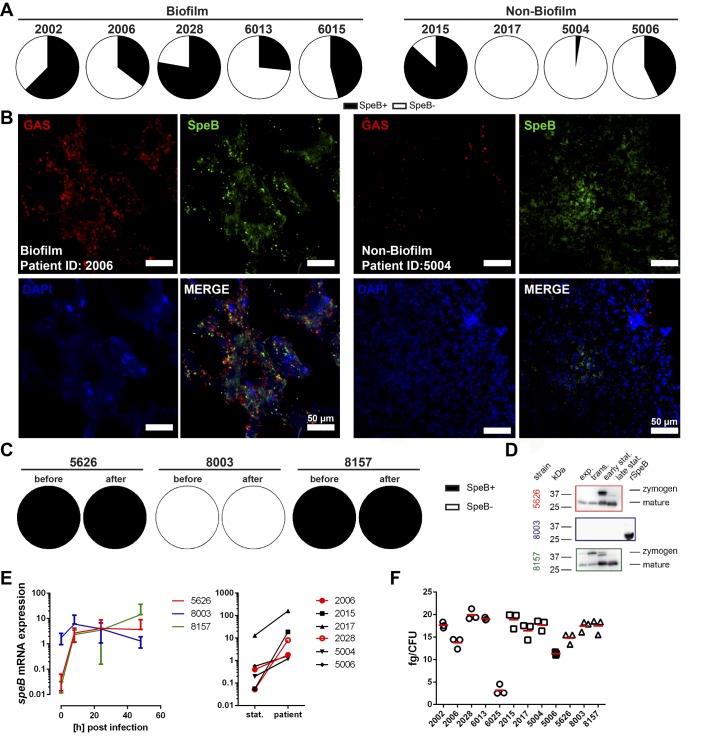
Since it has been proposed that SpeB-negative covS mutants are selected at the tissue site and are associated with increased virulence in a murine experimental model (9) and reduced capacity to form biofilm (16), we investigated SpeB positivity by staining patient biopsies, as well as by assessing proteolytic activity of individual bacterial colonies. Culture of tissue sections on casein plates revealed a mixture of SpeB-positive and -negative colonies with no difference between biopsies with or without biofilm (Figure 5A). In addition, staining of patient tissue sections revealed SpeB being associated with the bacterial surface, as well as being distributed throughout the entire tissue in all patient biopsies regardless of biofilm presence or absence (Figure 5B). Among the 3 isolates used previously for infection of the skin tissue model, 8003 was found to be deficient in SpeB production (Figure 5, C and D, and Supplemental Figure 7) and yet was equally capable of forming biofilm as the SpeB-positive 5626 and 8157 (Figure 1, C and D, and Supplemental Figure 2). Sequence analyses of covS and covR genes of 8003 strain identified no mutations in these regions. In addition, transcript analyses showed a strong induction of speB, even in 8003 strain lacking SpeB, which remained at relatively high levels throughout the course of infection in tissue models (Figure 5E, left panel). Similarly, elevated speB transcription was evident in all patient tissue biopsies compared with that of static culture (Figure 5E, right panel). Furthermore, the hyaluronic acid capsule amount was determined. All strains showed relatively low expression of capsule, and although the expression varied among strains, there was no relation to biofilm findings in the biopsies (Figure 5F). Taken together, these data imply that CovR/S system, SpeB, and capsule are not required for biofilm formation in the tissue setting.
Figure 5. SpeB, capsule, and CovR/S are not associated with biofilm formation in the tissue setting.
(A) Distribution of SpeB-positive and SpeB-negative (SpeB+/SpeB–) clones recovered from biofilm- and non–biofilm-associated patient biopsies. (B) Representative immunofluorescence micrographs of the distribution of SpeB in biofilm and nonbiofilm patient biopsies (original magnification, ×40). (C) SpeB positivity among the necrotizing soft tissue infection strains used for the skin model infections (before infection and 48 hours after). (D) Western Blot analyses of secreted SpeB by indicated strains at different growth stages. Representative images of 3 experiments are shown (n = 3). (E) Relative mRNA expression of speB before and during the infection in tissue models (left panel) or in patient biopsies (right panel; stat., static culture). The data on skin tissue model (left panel) represent the mean values ± SD (n = 3). (F) Amounts of capsular hyaluronic acid in exponential growth phase bacteria. Strains from patients with biofilm-positive or -negative biopsies are shown in circles and squares, respectively. The horizontal line denotes mean values (n = 3).
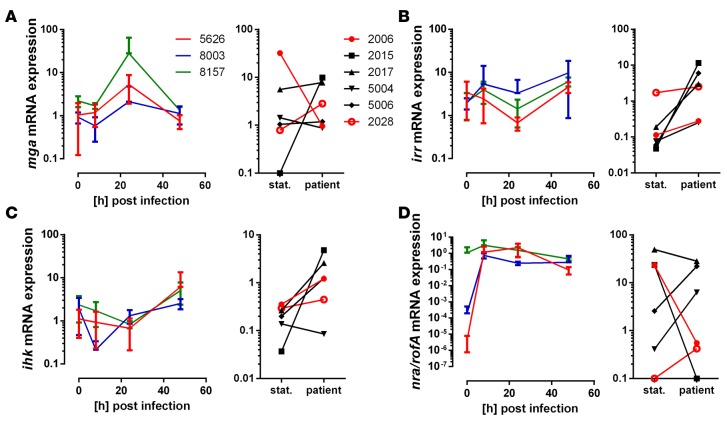
Next, we assessed bacterial gene expression focusing on selected gene regulatory systems, i.e. Mga, a key gene regulator of M- and M-like proteins; the 2-component system Ihk/Irr, contributing to bacterial adaptation in the human host; and Nra/RofA, which are negative and positive regulators of genes in the FCT-region (fibronectin-binding, collagen-binding, T-pilus), respectively (17). In infected models, mga expression peaked at 24 hours after infection, after which the expression returned to base line levels (Figure 6A, right panel). In patient biopsies, a varying expression pattern was noted with no link to the presence of biofilm (Figure 6A, left panel). The irr and ihk genes showed an increased expression both in infected models and in patient biopsies (Figure 6, B and C). Expression of nra was strongly induced in the two emm3 strains (5626 and 8003) throughout the course of infection, whereas the rofA expression in the emm1 strain (8157) remained unaltered (Figure 6D, left panel). Among the patients, there was only one strain (2028) with the nra gene, and in this biofilm-positive patient, nra showed an increased expression (Figure 6D, right panel). The other strains all had rofA and showed varying gene expression. Notably, in the emm1-infected patients, rofA was downregulated in the biofilm-positive patient 2006, whereas it was upregulated in the biofilm-negative patient 5006 (Figure 6D). Taken together, this suggests that biofilm formation at the tissue site is under Nra/RofA control.
Figure 6. Gene expression of streptococcal regulatory systems during tissue infections.
(A–D) Relative mRNA expression of genes encoding for streptococcal virulence regulatory systems before and during the infection in tissue models (left panels) or in patient biopsies (right panels; stat., static culture). Relative mRNA expression of genes encoding for regulatory systems mga (A), irr/ihk (B and C), and nra/rofA (D) are shown. The data on skin tissue model (left panel) represent the mean values ± SD (n = 3).
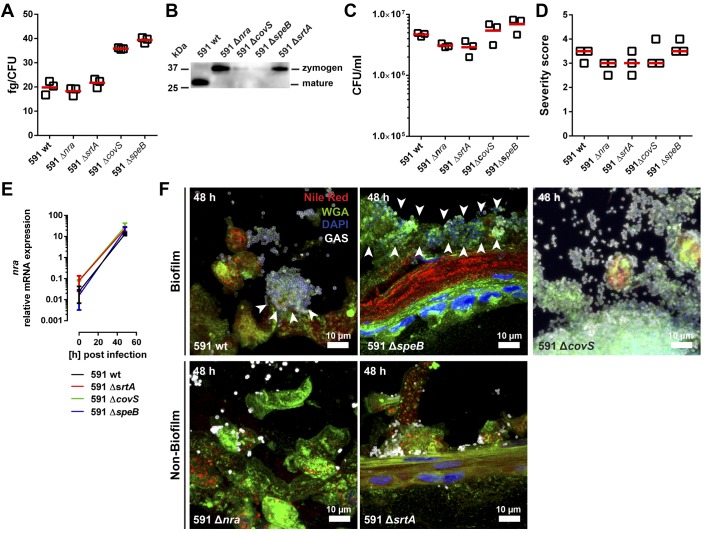
To test this, a set of mutants deficient in nra, covS, speB, and srtA (encoding for Sortase A that covalently links proteins to the cell wall; ref. 18) was used. Since clinical isolates are difficult to manipulate genetically, the emm49 GAS strain (strain 591) of genetic pattern D, typically associated with skin tropism (19), was used. First, amounts of hyaluronic acid in GAS capsule and SpeB production in stationary growth stage were assessed. The analysis revealed enhanced capsule synthesis in ΔcovS and ΔspeB background compared with the other 3 strains (Figure 7A). The mature form of SpeB was only detected in 591 WT strain, whereas the zymogen form was found in Δnra and ΔsrtA mutant strains (Figure 7B). In contrast, ΔcovS showed impaired SpeB production, and no protein was detected in ΔspeB mutant strain (Figure 7B and Supplemental Figure 7). Next, we analyzed the ability of these strains to colonize the skin tissue. All 591 strains infected the tissue model and caused tissue severity to the same extent (Figure 7, C and D, and Supplemental Figure 8). Transcription of nra was strongly induced in all strains, except of the respective mutant (Figure 7E). Notably, WT 591, ΔspeB, and ΔcovS readily formed biofilm, while no biofilm was evident in models infected with Δnra and ΔsrtA mutant strains (Figure 7F and Supplemental Figure 9).
Figure 7. Role of Nra and Sortase A in biofilm formation in the tissue setting.
(A) Amounts of capsular hyaluronic acid in exponential growth phase bacteria. The horizontal line denotes mean values of the 3 experiments. (B) Western Blot analysis of secreted SpeB by indicated strains at late stationary growth stage. Representative image of 3 experiments is shown (n = 3). Original blot is shown in Supplemental Figure 7. (C) CFU counts of indicated bacteria recovered from tissue models after 48 hours of infection. The horizontal line denotes mean values (n = 3). (D) Blinded scoring of tissue pathology of the skin model after infection. Each symbol represents one independent experiment. Horizontal lines denote median values (n = 3). (E) Relative mRNA expression of the transcriptional regulator nra is shown. The data represent the mean values ± SD (n = 3). (F) Representative immunofluorescence images of biofilm after 48 hours of infection (original magnification, ×100). GAS-specific antibody, wheat germ agglutinin (WGA), and Nile red were used.
Discussion
Bacterial persistence at the tissue site of GAS necrotizing fasciitis despite prolonged antibiotic therapy has previously been reported (14). In this study, we describe a previously healthy male who presented with STSS and necrotizing fasciitis with severe complications arising as late as 24 days after admission. The observation of biofilm in the infected tissue provided a plausible rationale for persisting infection. In this study, we demonstrate that GAS NSTI isolates readily form biofilm in human tissue, and analyses of tissue biopsies showed biofilm in 32% of the GAS NSTI patients. This is an important finding, as biofilm has not previously been considered a potential complicating factor in severe acute mono-microbial GAS NSTI. This is partly linked to the fact that GAS has not hitherto been considered a major biofilm-forming species. In this study, biofilm was found in patients infected with emm1 and emm3, which are also the strains usually predominant among severe invasive GAS infections. The biopsies with biofilm were characterized by high bacterial load and a pronounced host response in terms of elevated levels of IL-8, resistin, and neutrophil influx. All these markers have previously been associated with increased severity of GAS tissue infections (13, 20). However, in a subanalysis, no relation between biofilm findings and various clinical parameters of the 31 NSTI patients — including length of stay at the ICU and hospital, severity of infection as assessed by SAPSII or SOFA, number of surgical interventions, or presence of comorbidities — was identified (Supplemental Table 3). It should be noted that the parameters are limited to the ICU stay, and the complications arising as a consequence of the biofilm are likely to occur at later time points and, in most cases, outside the ICU. It seems likely that biofilm formed in tissue during NSTI promotes a more resistant life form and prolonged survival in the tissues, allowing recrudescence of infection on cessation of antimicrobial therapy. A remaining question is which signals are triggering and driving the biofilm formation at the tissue site. Our findings revealed that all clinical isolates, including the ones recovered from patients in which no biofilm could be identified, were capable of forming biofilm in tissue settings, suggesting that it is not linked to the strains per se but rather to presence or absence of particular signals. The significant association between high bacterial burden and presence of biofilm in the patient biopsies implies that quorum sensing is involved in the signaling, which is also in line with the known association between quorum sensing and biofilm (21, 22). However, the signals triggering streptococcal biofilm formation in tissue remain to be elucidated.
Our data demonstrate the importance of studying biofilm in a physiologically relevant setting. Conventional biofilm assays involve culture on polystyrene and glass surfaces under static and flow conditions (23). In this study, the NSTI strains used were relatively poor biofilm producers using these classical assays and revealed starkly varying responses. In contrast, in the tissue setting, all 8 clinical isolates readily formed biofilm. Analyses of bacterial gene expression showed upregulation of several important gene regulatory systems in infected tissue. The Nra/RofA regulator showed an expression pattern that indicated a contribution to biofilm formation. Considering that Nra/RofA, as regulators of the FCT3-region (19, 24–26), control pili expression and other surface proteins responsible for attachment to eukaryotic cells, it seemed reasonable that biofilm formation is under Nra control. This was confirmed by use of an Nra-deficient mutant, which resulted in loss of biofilm formation in infected tissue. As previously published, inactivation of Nra results in upregulation of genes of the Mga operon and in downregulation of genes encoding protein F2 and collagen-binding protein, laminin-binding protein, and plasminogen-binding extracellular protein factor (24). In contrast, no association between capsule expression, presence or absence of SpeB, and inactivation of CovR/S regulatory system and biofilm formation was found. These results support the involvement of the FCT-region in biofilm formation, rather than M- and M-like proteins controlled by Mga or/and CovR/S. The abolished biofilm formation of 591 ΔsrtA mutant underlines the involvement of microbial surface components in biofilm formation. Taken together, our data shows the value of modeling bacterial infections in the tissue milieu in order to assess bacterial properties and pathogenic mechanisms.
To our knowledge, this is the first report that provides evidence of GAS biofilm in soft tissue of NSTI patients. This finding has direct implications for bacterial persistence and antibiotic efficacy and calls for reevaluation of treatment protocols in which biofilm is considered. Also, it warrants further experimental studies to identify combinations of antibiotics with increased efficacy against biofilm and thereby improved clearance of streptococcal biofilm at the tissue site.
Methods
Patient material.
Snapfrozen tissue biopsies were collected from 31 GAS NSTI patients enrolled in the EU-funded project INFECT during 2013–2015 (ClinicalTrials.gov, NCT01790698).
Bacterial strains.
GAS 5626, 8003, and 8157 are NSTI isolates from Toronto, Canada (provided by Donald E. Low, Mount Sinai Hospital, Toronto, Canada) (4, 12). GAS 591 WT strain and its isogenic mutants 591 Δnra, ΔspeB, ΔcovS, and ΔsrtA were provided by Bernd Kreikemeyer (University of Rostock, Rostock, Germany) (24–28). GAS NSTI strains from the INFECT project are summarized in Table 1. All strains were cultured in Todd-Hewitt broth (Invitrogen) supplemented with 1.5% (w/v) yeast extract (Invitrogen) at 37°C.
3D organotypic skin model.
The models were generated using the human N/TERT-1 cells and NHDF dermal fibroblasts following the protocol as previously published (15). The human keratinocyte cells (N/TERT-1; a gift from J. Rheinwald and the Cell Culture Core of the Harvard Skin Disease Research Centre, Boston, Massachusetts, USA) were maintained in EpiLife medium (Invitrogen). Normal human dermal fibroblasts were cultured in DMEM (Invitrogen) supplemented with 10% (v/v) FBS (Invitrogen). Both were cultured at 37°C under a 5% CO2 atmosphere.
Dermal equivalents were generated by adding 1 ml cell-free collagen (1 mg/ml; Advanced Biomatrix) into a 6 well-filter insert (Corning Life Sciences). After polymerization, 3 ml of NHDF populated (0.4 × 10⁵) collagen (2 mg/ml) was pipetted onto the polymerized collagen layer. After polymerization, dermal equivalents were submerged in DMEM medium for 1 week. After 7 days, 1 × 10⁶ N/TERT-1 cells were seeded onto the dermal equivalent and incubated for 2 hours at 37°C under a 5% CO2 atmosphere, after which 2 ml of EpiLife (Invitrogen) was added to each insert. Submerged cultures were incubated for 3 additional days. Then, skin models were air exposed by removing the medium from the inserts and adding 10 ml 1.46 mM CaCl2-EpiLife to the outer chamber. Air-exposed skin models were incubated for up to 7 days at 37°C under a 5% CO2 atmosphere, and the culture media was replaced every second day in the outer chamber. The models were infected with an optimal infectious dose of 1 × 10⁶ bacteria for 8, 24, and 48 hours. Total bacterial counts (extra- and intracellular bacteria) from model tissue, which was digested with Collagenase I (Roche Diagnostics) and sonicated, were determined by plating serial dilution on blood agar plates.
Histological analysis and immunostaining of tissue biopsies.
Cryosectioning, fixation, and staining were done as previously detailed (15, 20). For cryosectioning, skin tissue models were treated with 2.0 M sucrose for 1 hour before being embedded in optimum cutting temperature compound (Sakura) and then frozen in liquid nitrogen and stored at –80°C. Cryosections (8 μm) were obtained using a MICROM cryostat HM 560 MV (Zeiss) and fixed in 2% freshly prepared formaldehyde in PBS for 15 minutes at room temperature or in ice-cold acetone for 2 minutes at –20°C.
For histological analysis, the sections were stained for 15 seconds in Mayer’s hematoxylin and counterstained for 2 minutes in eosin. Histological severity scoring was performed in a double-blinded manner using the following criteria: 0, unaffected tissue; 0.5–1, mild injury with minor epithelial loosening; 1.5–2, moderate injury with some epithelial disruption; 2.5–3, severe injury with continuous epithelial disruption and some detachment; and > 4, extensive injury, massive epithelial disruption,and detachment.
For immune analysis, patient biopsies were cryosectioned (8 μm), fixed in 2% (v/v) formaldehyde, and immunostained as previously described (15, 20). The following antibodies were used for immunohistochemistry: anti–human HMGB1 (clone EPR3507; Abcam), anti–human IL8 (clone NAP-1; Invitrogen), anti–human resistin (clone 184305; R&D systems), anti–human CD68 (clone EBM11; DAKO), anti–human neutrophil-elastase (clone NP57; DAKO), and anti–human HBP (rabbit polyclonal serum provided by Heiko Herwald, Lund University). Biotinylated secondary antibodies included goat anti-mouse IgG and goat anti-rabbit IgG (both from Vector Laboratories). The immunohistochemically stained sections were analyzed by acquired computerized image analysis (ACIA). The cell area was defined by the hematoxylin counterstaining, and the results are presented as percent positively stained area × mean intensity of positive staining.
Quantitative PCR Analysis.
Bacterial RNA was isolated using FastRNA Blue (MP Biomedicals). cDNA synthesis was performed using the Superscript first-strand synthesis system (Invitrogen). Quantitative PCR (qPCR) amplification was performed with primers specified in Supplemental Table 4 and SYBR GreenER Kit (Invitrogen) using an ABI Prism 7500 sequence detection system (Applied Biosystems). The levels of gyrA transcription were used for normalization. For patient material, the gene expression for each bacterial gene was compared with the static culture equivalent to the exponential growth phase used to infect the models.
Capsular hyaluronic acid measurement.
The amount of hyaluronic acid capsule produced by GAS strains was determined by releasing capsule from exponential-phase GAS cells grown in THY and measuring the hyaluronic acid content of the cell extracts using Stains-All (Sigma-Aldrich) as described previously (28, 29). The absorbance values were compared with a standard curve generated using known concentrations of hyaluronic acid from Streptococcus equi (Sigma-Aldrich).
SEM.
Snapfrozen specimens were fixed in 2.5% glutaraldehyde in 0.15 M sodium cacodylate, pH 7.4, for 30 minutes at room temperature. Specimens were washed with cacodylate buffer and dehydrated with an ascending ethanol series from 50% (v/v) to absolute ethanol (10 minutes per step). The specimens were subjected to critical-point drying in carbon dioxide, with absolute ethanol as intermediate solvent; mounted on aluminium holders; sputtered with 30 nm palladium/gold; and examined in a high-resolution FEI scanning electron microscope at the Core Facility for Integrated Microscopy at Panum Institute, University of Copenhagen.
Biofilm formation on polystyrene and glass surfaces.
Biofilm assays were performed as previously described (23) All experiments that used safranin staining were performed in 96-well polystyrene microtiter plates (Falcon, Fisher Scientific). For the CLSM detection method, the biofilms were grown in 8-well chamber glass slides (Lab-Tek). The surfaces were either uncoated or coated with fibronectin (Sigma-Aldrich), Collagen I, and Collagen IV (both Biomol) at a concentration of 5 μg ml–1.
Statistics.
Statistical significance of differences was determined using the 2-tailed Mann-Whitney U test. Multiple comparisons were done using 1-way ANOVA with Dunnett’s post test. Statistics were performed using GraphPad Prism version 6. A P value less than 0.05 was considered significant.
Study approval.
The studies were conducted in accordance with the Helsinki Declaration and approved by the regional Ethical Review Board at the Karolinska Institutet in Stockholm, Sweden, in Gothenburg, Sweden, and in Bergen, Norway, as well as by the National Committee on Health Research Ethics in Copenhagen. Written informed consent was obtained from all patients.
Author contributions
NS, MS, and ANT designed the study. NS, BC, SMS, JJ, LJ, HB, LB, M. Mörgelin, ANT, and MS analyzed experiments and data. PA, SS, OH, M. Morgan, MBM, and the INFECT study group contributed patient recruitment, sample collection, typing, and patient data analyses. NS, M. Morgan, MS, and ANT wrote the manuscript. All authors read and approved the final version.
Supplementary Material
Acknowledgments
We would like to thank Anette Hofmann for technical assistance. This project was supported by European Union (FP7/2007-2013) under the grant agreement 305340 (ANT, MS), the Swedish Research Council (ANT, MS), Karolinska Institutet (NS, ANT, MS), Stockholm county council (ALF-grant ANT, MS), Karolinska University Hospital (ANT), Kurt and Alice Wallenberg Foundation (ANT), Stiftelsen Längmanska Kulturfonden (NS), and the Swedish Society of Medicine (NS). The funding agencies had no part in manuscript compilation. See Supplemental Acknowledgments for INFECT Study Group details.
Footnotes
Conflict of interest: The authors have declared that no conflict of interest exists.
Reference information:JCI Insight. 2016;1(10):e87882. doi:10.1172/jci.insight.87882.
Contributor Information
Nikolai Siemens, Email: nikolai.siemens@ki.se.
Bhavya Chakrakodi, Email: bhavya.chakrakodi@ki.se.
Srikanth Mairpady Shambat, Email: srikanth.mairpady.shambat@ki.se.
Marina Morgan, Email: marinamorgan@nhs.net.
Helena Bergsten, Email: helbev121@studentmail.oru.se.
Ole Hyldegaard, Email: Ole.Hyldegaard@regionh.dk.
Steinar Skrede, Email: steinar.skrede@helse-bergen.no.
Per Arnell, Email: per.arnell@vgregion.se.
Martin B. Madsen, Email: martin.bruun.madsen.01@regionh.dk.
Linda Johansson, Email: linda.johansson77@gmail.com.
Julius Juarez, Email: juliusgjuarez@gmail.com.
Lidija Bosnjak, Email: lidija.bosnjak2@gmail.com.
Matthias Mörgelin, Email: Matthias.Morgelin@med.lu.se.
Mattias Svensson, Email: Mattias.Svensson@ki.se.
Anna Norrby-Teglund, Email: anna.norrby-teglund@ki.se.
References
- 1.Anaya DA, McMahon K, Nathens AB, Sullivan SR, Foy H, Bulger E. Predictors of mortality and limb loss in necrotizing soft tissue infections. Arch Surg. 2005;140(2):151–157. doi: 10.1001/archsurg.140.2.151. [DOI] [PubMed] [Google Scholar]
- 2.Morgan MS. Diagnosis and management of necrotising fasciitis: a multiparametric approach. J Hosp Infect. 2010;75(4):249–257. doi: 10.1016/j.jhin.2010.01.028. [DOI] [PubMed] [Google Scholar]
- 3.Bruun T, et al. Necrotizing soft tissue infections caused by Streptococcus pyogenes and Streptococcus dysgalactiae subsp. equisimilis of groups C and G in western Norway. Clin Microbiol Infect. 2013;19(12):E545–E550. doi: 10.1111/1469-0691.12276. [DOI] [PubMed] [Google Scholar]
- 4.Kaul R, McGeer A, Low DE, Green K, Schwartz B. Population-based surveillance for group A streptococcal necrotizing fasciitis: Clinical features, prognostic indicators, and microbiologic analysis of seventy-seven cases. Ontario Group A Streptococcal Study. Am J Med. 1997;103(1):18–24. doi: 10.1016/S0002-9343(97)00160-5. [DOI] [PubMed] [Google Scholar]
- 5.Davies HD, et al. Invasive group A streptococcal infections in Ontario, Canada. Ontario Group A Streptococcal Study Group. N Engl J Med. 1996;335(8):547–554. doi: 10.1056/NEJM199608223350803. [DOI] [PubMed] [Google Scholar]
- 6.Luca-Harari B, et al. Clinical and microbiological characteristics of severe Streptococcus pyogenes disease in Europe. J Clin Microbiol. 2009;47(4):1155–1165. doi: 10.1128/JCM.02155-08. [DOI] [PMC free article] [PubMed] [Google Scholar]
- 7.Molloy EM, Cotter PD, Hill C, Mitchell DA, Ross RP. Streptolysin S-like virulence factors: the continuing sagA. Nat Rev Microbiol. 2011;9(9):670–681. doi: 10.1038/nrmicro2624. [DOI] [PMC free article] [PubMed] [Google Scholar]
- 8.Nelson DC, Garbe J, Collin M. Cysteine proteinase SpeB from Streptococcus pyogenes - a potent modifier of immunologically important host and bacterial proteins. Biol Chem. 2011;392(12):1077–1088. doi: 10.1515/BC.2011.208. [DOI] [PubMed] [Google Scholar]
- 9.Walker MJ, et al. DNase Sda1 provides selection pressure for a switch to invasive group A streptococcal infection. Nat Med. 2007;13(8):981–985. doi: 10.1038/nm1612. [DOI] [PubMed] [Google Scholar]
- 10.Herwald H, et al. M protein, a classical bacterial virulence determinant, forms complexes with fibrinogen that induce vascular leakage. Cell. 2004;116(3):367–379. doi: 10.1016/S0092-8674(04)00057-1. [DOI] [PubMed] [Google Scholar]
- 11.Johansson L, et al. Neutrophil-derived hyperresistinemia in severe acute streptococcal infections. J Immunol. 2009;183(6):4047–4054. doi: 10.4049/jimmunol.0901541. [DOI] [PubMed] [Google Scholar]
- 12.Johansson L, et al. Cathelicidin LL-37 in severe Streptococcus pyogenes soft tissue infections in humans. Infect Immun. 2008;76(8):3399–3404. doi: 10.1128/IAI.01392-07. [DOI] [PMC free article] [PubMed] [Google Scholar]
- 13.Norrby-Teglund A, et al. Evidence for superantigen involvement in severe group a streptococcal tissue infections. J Infect Dis. 2001;184(7):853–860. doi: 10.1086/323443. [DOI] [PubMed] [Google Scholar]
- 14.Thulin P, et al. Viable group A streptococci in macrophages during acute soft tissue infection. PLoS Med. 2006;3(3):e87882. doi: 10.1371/journal.pmed.0030053. [DOI] [PMC free article] [PubMed] [Google Scholar]
- 15.Siemens N, et al. Increased cytotoxicity and streptolysin O activity in group G streptococcal strains causing invasive tissue infections. Sci Rep. 2015;5:e87882. doi: 10.1038/srep16945. [DOI] [PMC free article] [PubMed] [Google Scholar]
- 16.Hollands A, et al. Genetic switch to hypervirulence reduces colonization phenotypes of the globally disseminated group A streptococcus M1T1 clone. J Infect Dis. 2010;202(1):11–19. doi: 10.1086/653124. [DOI] [PMC free article] [PubMed] [Google Scholar]
- 17.Kreikemeyer B, McIver KS, Podbielski A. Virulence factor regulation and regulatory networks in Streptococcus pyogenes and their impact on pathogen-host interactions. Trends Microbiol. 2003;11(5):224–232. doi: 10.1016/S0966-842X(03)00098-2. [DOI] [PubMed] [Google Scholar]
- 18.Barnett TC, Scott JR. Differential recognition of surface proteins in Streptococcus pyogenes by two sortase gene homologs. J Bacteriol. 2002;184(8):2181–2191. doi: 10.1128/JB.184.8.2181-2191.2002. [DOI] [PMC free article] [PubMed] [Google Scholar]
- 19.Bessen DE, Lizano S. Tissue tropisms in group A streptococcal infections. Future Microbiol. 2010;5(4):623–638. doi: 10.2217/fmb.10.28. [DOI] [PMC free article] [PubMed] [Google Scholar]
- 20.Johansson L, et al. HMGB1 in severe soft tissue infections caused by Streptococcus pyogenes. Front Cell Infect Microbiol. 2014;4:e87882. doi: 10.3389/fcimb.2014.00004. [DOI] [PMC free article] [PubMed] [Google Scholar]
- 21.Jimenez JC, Federle MJ. Quorum sensing in group A Streptococcus. Front Cell Infect Microbiol. 2014;4:e87882. doi: 10.3389/fcimb.2014.00127. [DOI] [PMC free article] [PubMed] [Google Scholar]
- 22.Marks LR, Mashburn-Warren L, Federle MJ, Hakansson AP. Streptococcus pyogenes biofilm growth in vitro and in vivo and its role in colonization, virulence, and genetic exchange. J Infect Dis. 2014;210(1):25–34. doi: 10.1093/infdis/jiu058. [DOI] [PMC free article] [PubMed] [Google Scholar]
- 23.Lembke C, Podbielski A, Hidalgo-Grass C, Jonas L, Hanski E, Kreikemeyer B. Characterization of biofilm formation by clinically relevant serotypes of group A streptococci. Appl Environ Microbiol. 2006;72(4):2864–2875. doi: 10.1128/AEM.72.4.2864-2875.2006. [DOI] [PMC free article] [PubMed] [Google Scholar]
- 24.Kreikemeyer B, et al. The Streptococcus pyogenes serotype M49 Nra-Ralp3 transcriptional regulatory network and its control of virulence factor expression from the novel eno ralp3 epf sagA pathogenicity region. Infect Immun. 2007;75(12):5698–5710. doi: 10.1128/IAI.00175-07. [DOI] [PMC free article] [PubMed] [Google Scholar]
- 25.Nakata M, et al. Mode of expression and functional characterization of FCT-3 pilus region-encoded proteins in Streptococcus pyogenes serotype M49. Infect Immun. 2009;77(1):32–44. doi: 10.1128/IAI.00772-08. [DOI] [PMC free article] [PubMed] [Google Scholar]
- 26.Siemens N, et al. Effects of the ERES pathogenicity region regulator Ralp3 on Streptococcus pyogenes serotype M49 virulence factor expression. J Bacteriol. 2012;194(14):3618–3626. doi: 10.1128/JB.00227-12. [DOI] [PMC free article] [PubMed] [Google Scholar]
- 27.Siemens N, Kreikemeyer B. Heterologous expression of Ralp3 in Streptococcus pyogenes M2 and M6 strains affects the virulence characteristics. PLoS One. 2013;8(2):e87882. doi: 10.1371/journal.pone.0055109. [DOI] [PMC free article] [PubMed] [Google Scholar]
- 28.Sugareva V, Arlt R, Fiedler T, Riani C, Podbielski A, Kreikemeyer B. Serotype- and strain- dependent contribution of the sensor kinase CovS of the CovRS two-component system to Streptococcus pyogenes pathogenesis. BMC Microbiol. 2010;10:e87882. doi: 10.1186/1471-2180-10-34. [DOI] [PMC free article] [PubMed] [Google Scholar]
- 29.Schrager HM, Rheinwald JG, Wessels MR. Hyaluronic acid capsule and the role of streptococcal entry into keratinocytes in invasive skin infection. J Clin Invest. 1996;98(9):1954–1958. doi: 10.1172/JCI118998. [DOI] [PMC free article] [PubMed] [Google Scholar]
Associated Data
This section collects any data citations, data availability statements, or supplementary materials included in this article.


