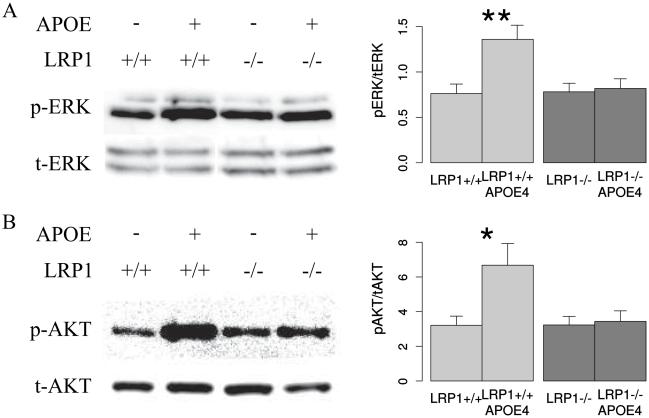
Fig. 10. LRP1 promotes ERK and Akt phosphorylation upon ApoE stimulation.
Representative Western blot analysis and quantification, showing that ApoE can enhance ERK1/2 (A) and Akt phosphorylation (B) in LRP1+/+ but not LRP−/− cells (N = 6, Akt; N = 7, ERK). The band intensity of p-Akt and p-ERK is normalized to total Akt and ERK respectively. Data are expressed as mean ± SE (* indicates P < 0.05, ** — P < 0.01). p-ERK = phosphorylated ERK, p-Akt = phosphorylated Akt, t-ERK = total ERK, t-Akt = total Akt.

