Abstract
The identification of ANO1/TMEM16A as the likely calcium-dependent chloride channel of exocrine glands has led to a more detailed understanding of its biophysical properties. This includes a calcium-dependent change in channel selectivity and evidence that HCO3− permeability can be significant. Here we use freshly isolated pancreatic acini that preserve the luminal structure to measure intraluminal pH and test the idea that ANO1/TMEM16A contributes to luminal pH balance. Our data show that, under physiologically relevant stimulation with 10 pm cholesystokinin, the luminal acid load that results from the exocytic fusion of zymogen granules is significantly blunted by HCO3− buffer in comparison with HEPES, and that this is blocked by the specific TMEM16A inhibitor T16inh-A01. Furthermore, in a model of acute pancreatitis, we observed substantive luminal acidification and provide evidence that ANO1/TMEM16A acts to attenuate this pH shift. We conclude that ANO1/TMEM16A is a significant pathway in pancreatic acinar cells for HCO3− secretion into the lumen.
Keywords: bicarbonate, epithelial cell, exocytosis, ion channel, pancreas, secretion, transporter
Introduction
Luminal pH dysregulation in exocrine organs is a key factor in diseases like cystic fibrosis and acute pancreatitis (1, 2). This luminal pH is controlled by the epithelial cells that line the lumen. In exocrine glands, a major pathway for HCO3− secretion is Slc26a6, a Cl−/HCO3− exchanger that is found in the apical membrane of ductal epithelium and works, in these cells, in consort with the cystic fibrosis transmembrane regulator (CFTR)3 (2) to produce an HCO3−-rich fluid exudate from the gland (3, 4). At least part of the role of this secreted HCO3− is to neutralize a luminal acid load that results from the exocytosis of the highly acidic zymogen granule content of pancreatic acinar cells (5, 6). Whether acinar cells play a more active role in luminal pH regulation is not clear. The identification of ANO1/TMEM16A as the likely candidate for the apical calcium-dependent chloride channel in exocrine acinar cells (7–11) and some recent work on its control (12) now highlight the possibility that it may act as an apical HCO3− exit pathway and thus could be an additional component in pancreatic luminal pH regulation (13).
A common finding from work on exocrine tissues is that the calcium-dependent chloride channel has an anion permeability consistent with the Eisenman series I, which shows an order of permeability of I− > Cl− > HCO3− > F− (14, 15). In exocrine cells, Cl− and HCO3− are arguably the most physiologically relevant ions. Although Cl− exit in to the lumen is known to be the major ion participating in fluid movement, HCO3− movement through the Cl− channel is not well understood. There is one study that suggests that HCO3− might exit through the Cl− channel, and if this is true, then HCO3− would contribute to luminal pH control (16). Now, using cloned and expressed ANO1/TMEM16A, the Eisenman permeability series I for anions for this channel has been confirmed (7, 17). Interestingly, studies show that there are dynamic changes in anion selectivity that are dependent on the concentration of intracellular calcium (18–20). In one paper, these selectivity changes in ANO1/TMEM16A permeability include a shift, as the calcium concentration is increased (from 400 nm to 3 μm), from the normal PHCO3−/PCl− ratio of 0.3 to a ratio of 1.1 (12). It has been suggested that calmodulin mediates this permeability change (12); however, this mechanism has been contested by others (21). In distinction to its precise regulation, an open question is whether the HCO3− permeability of ANO1/TMEM16A in acinar cells is large enough to play a significant role in luminal pH balance.
Here we have used isolated mouse pancreatic fragments and lobules, which preserve the structure of the intact acini, to measure pH changes in the lumen in response to cell stimulation (5). We used 10 pm cholesystokinin (CCK) (22) to study the physiological response and 10 nm CCK to model the cell responses in acute pancreatitis. In both cases we observed that the stimulated exocytosis of zymogen granules release their acid content into the lumen. In HCO3−-buffered solutions, the recovery from this acidification is faster than with HEPES buffer and, importantly, is slowed by the ANO1/TMEM16A blocker T16Ainh-A01. Our data show that, at both normal and high levels of stimulation, ANO1/TMEM16A provides an HCO3− exit pathway in acinar cells that regulates luminal pH.
Results
We prepared acini from freshly isolated, collagenase-digested mouse pancreas that then remain viable for 3–4 h, as reported previously (24). The tissue preparation is composed of multicellular fragments of acini that retain their structural integrity, cell organization and polarity, and lumens. When stimulated, exocytic fusion of zymogen granules occurs exclusively in the lumen. Our method for visualizing exocytosis bathes the tissue fragments in sulforhodamine B (SRB) (24). This dye diffuses into the lumens and enters each zymogen granule as it fuses with the cell membrane. When imaging with two-photon microscopy, granule fusion is observed as the sudden appearance of bright spots of fluorescence about 1 μm in diameter (24). In addition to SRB, we also included hydroxypyrene-3,6,8-trisulfonate (HPTS) in the extracellular solution. This dye is pH-sensitive (fluorescence decreases with acidification) with a pKa of 7.3 and, with the assumption of a starting pH of 7.4, is calibrated and mapped on to a pseudocolor scale to indicate luminal pH changes after cell stimulation (5).
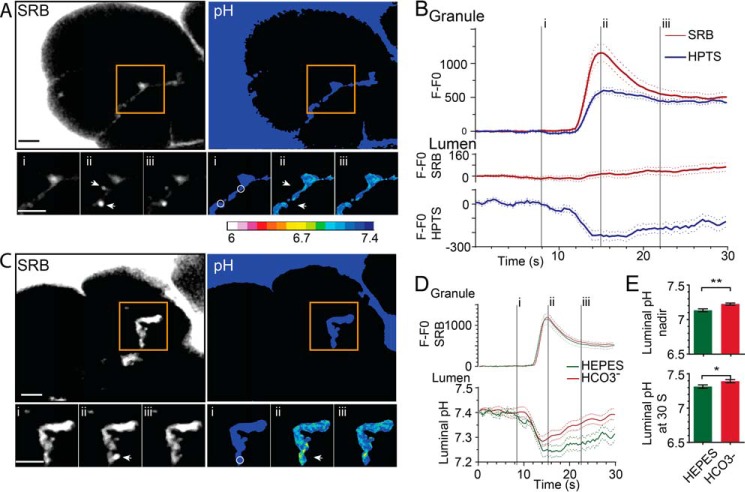
Fig. 1 shows the typical response of a cluster of acinar cells to stimulation with CCK at a physiologically relevant concentration of 10 pm. In these images, two exocytic events are shown (Fig. 1A, arrows), with the bright flash of SRB fluorescence occurring as the dye enters the granules (Fig. 1, A and B, time point ii). HPTS also enters the granule but shows an apparently slower rate of rise that is consistent with the suppression of fluorescence, which is expected within the acid environment of the granule lumen (Fig. 1B). The simultaneous record of luminal fluorescence changes (Fig. 1A, circles) shows a small increase in SRB fluorescence, which reflects the dye accumulated on the exiting granule content (Fig. 1B) (25). In contrast, HPTS fluorescence decreases, and, as we have observed before (5), this occurs before the rise in SRB fluorescence and suggests an initial release of protons into the lumen through a narrow fusion pore. The luminal acidification associated with each granule fusion event is transient and reaches a nadir within a few seconds, followed by pH recovery (Fig. 1, A and B). The calibrated HPTS ratio changes, mapped onto a pseudocolor scale, show the spatial extent of the luminal pH changes (Fig. 1A).
FIGURE 1.
Luminal acidification after zymogen granule exocytosis is decreased in an HCO3− buffer. A, two-photon live-cell imaging of pancreatic fragments, bathed in HEPES, SRB, and HTPS, showing the dyes outline the cells and enter the lumen between the cells. Zymogen granule exocytosis, triggered by stimulation with CCK (10–20 pm), is observed as the sudden appearance of fluorescent spots (two events are shown, arrows) as the dyes enter the granule shown here at time points i, ii, and iii (see also B and supplemental Movie 1). The pseudocolored pH changes were obtained from calibrated ratios of the HPTS fluorescence and show spatial pH changes in the lumen synchronous with the granule fusion events (see also supplemental Movie 2. B, plots of fluorescence over time (baseline subtracted, n ≥ 33 events, n = 3+ animals) within regions of interest (A, arrows) over the region of the fusing granules showing that both SRB and HPTS enter the granules. In the lumen (A, circles), SRB shows a small fluorescence increase, but HPTS shows a decrease, consistent with luminal acidification and quenching of HPTS fluorescence. C, pancreatic fragments bathed in HCO3− buffer show similar fluorescent changes in the granule and the lumen as those in HEPES buffer (see also supplemental Movies 3 and 4). D and E, comparison of the responses in HEPES and HCO3− showing that the changes of fluorescence within the granule are similar but that, in the lumen, the pH nadir and recovery were significantly (Student's t test; *, p < 0.05; **, p < 0.01) less acidic in HCO3−. Scale bars = 5 μm.
Experiments performed in the presence of 2 mm HEPES (Fig. 1, A, D, and E; n = 36 exocytic events from 6 mice) show a relatively bigger luminal acidification and a slower rate of pH recovery compared with experiments performed in the presence of 2 mm HCO3− (Fig. 1, B, D, and E; n = 33 exocytic events from 6 mice). These data demonstrate that the different buffers have a different effect on the dynamics of luminal pH.
Because recent work has implicated TMEM16A as a significant HCO3− transporter (7, 12) and confirmed that it is the luminally located calcium-dependent chloride channel in acinar cells (8, 9, 26), we set out to test whether TMEM16A played a role in the different luminal pH responses we observed when using HCO3− as a buffer.
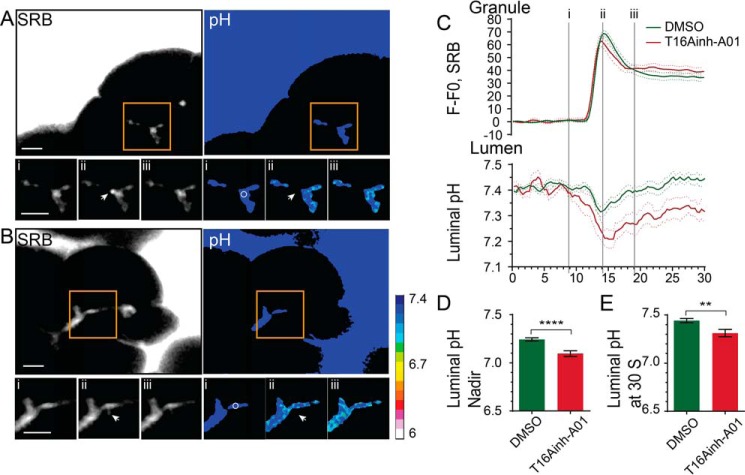
The TMEM16A inhibitor T16Ainh-A01 (26) provides a tool to test for a role of this chloride channel in HCO3− transport. Acutely applied to the preparation, we observed that T16Ainh-A01 did not affect the CCK-stimulated exocytic events, which showed very similar SRB fluorescence profiles as controls (Fig. 2). However, the luminal pH changes were affected by T16Ainh-A01 and showed a significantly more acidic nadir (Fig. 2D, n = 32 exocytic events in control, n = 11 with T16Ainh-A01, p < 0.0001) and a slowing of luminal pH recovery (n = 32 exocytic events, 4 mice in control, n = 11, 3 mice with T16Ainh-A01, p < 0.01). These data provide direct evidence that TMEM16A is a significant HCO3− pathway and contributes to the dynamic pH regulation of the lumen.
FIGURE 2.
TMEM16A is a significant transporter of HCO3− in to the acinar lumen. A and B, two-photon live-cell imaging of pancreatic fragments bathed in HCO3− stimulated with CCK (10–20 pm) in the absence (DMSO control, A; see also supplemental Movies 5 and 6) or presence of 10 μm T16Ainh-AO1 (B, see also supplemental Movies 7 and 8). The SRB fluorescence shows an example granule fusion event (arrow). Also shown are pseudocolored pH changes as assessed with the HPTS fluorescence changes. C, D, and E, the inhibitor leads to a significant (Student's t test; ****, p < 0.001; **, p < 0.01) increase in stimulus-induced luminal acidification (n ≥ 10 events, n > 3 mice). Scale bars = 5 μm.
To further strengthen this finding, we conducted control whole-cell patch clamp experiments to directly measure the agonist-evoked, calcium-dependent chloride currents in isolated acinar cells. In mouse acinar cells, CCK stimulation principally activates calcium-dependent chloride channels, as shown by the significant reduction in currents in the TMEM16A knockout mouse (8). In mouse pancreatic acinar cells, there is no calcium-dependent potassium conductance (27) and only a minor contribution from a non-selective cation conductance (28). Under conditions we have used previously to characterize the calcium-dependent chloride currents (14), we show that CCK activates a voltage-insensitive current that is significantly blocked in the presence of T16Ainh-A01 (Fig. 3, A and B).
FIGURE 3.
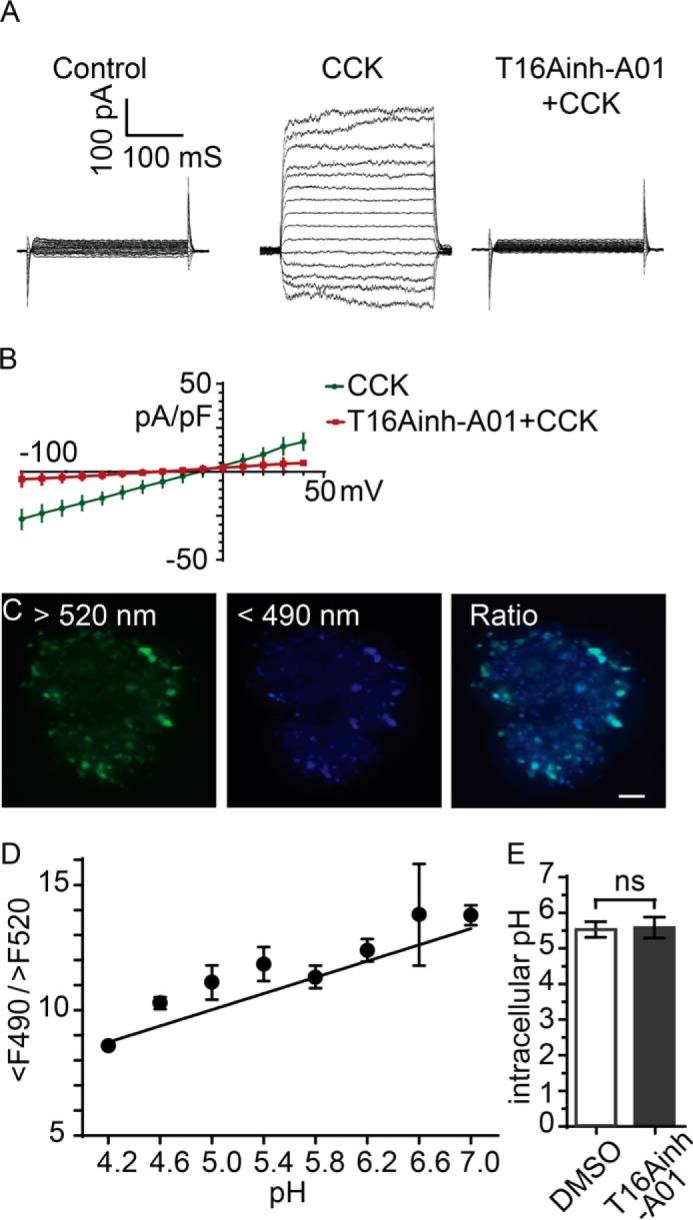
T16Ainh-AO1 blocks the agonist-evoked calcium-dependent chloride current in pancreatic acinar cells but has no effect on zymogen granule acidification. A and B, whole-cell patch clamp with voltage clamp steps showing activation of a large current after stimulation with 10 pm CCK that is blocked when cells were stimulated in the presence of 10 μm T16AinhAO1, as shown in the current-voltage relationships (B). C and D, cells incubated in Lysosensor were two-photon-imaged with excitation at 750 nm and emission collected at wavelength >520 nm and <490 nm. Images were ratioed (C and D) and calibrated across a range of pH values (D). E, the cellular pH was not different (Student's t test) after treatment with 10 μm T16Ainh-AO1. Scale bar = 5 μm. pF, picofarad; ns, not significant.
In addition, we were concerned that the inhibitor might be acting directly on the zymogen granules, prior to exocytosis, to affect the intragranular pH and, consequently, change the proton load in the lumen. To test this possibility, we incubated the cells in Lysosensor Yellow/Blue DND-160. The dye enters acidic compartments within the cell (Fig. 3C) that, in acinar cells, are dominated by the zymogen granules, although it would include lysosomes (5). After calibration, the Lysosensor dye showed that the intragranular pH was not different in control cells compared with cells treated with T16Ainh-A01 (Fig. 3, C and D). Our results therefore demonstrate that T16Ainh-AO1 is acting on the calcium-dependent chloride channel in pancreatic acinar cells, and, although we cannot rule out that it might act elsewhere (29), this action alone is sufficient to explain the actions on luminal pH.
In another control experiment, we tested whether T16Ainh-AO1 might affect the agonist-evoked calcium response. This might be the case in other systems (29), and any change in intracellular calcium could lead to downstream consequences that might alter the luminal pH independent of an action on the chloride channel. Our experiments using Fura-2-loaded cells show that acinar cells have a robust response to stimulation in the control (Fig. 4, DMSO) that is not affected by the application of 100 μm T16Ainh-A01. Our results show that the likely major action of HCO3− buffer on luminal pH is via TMEM16A, leading us to conclude that TMEM16A is a transport pathway for apical HCO3− exit that can significantly alter luminal pH under physiologically relevant stimulation.
FIGURE 4.
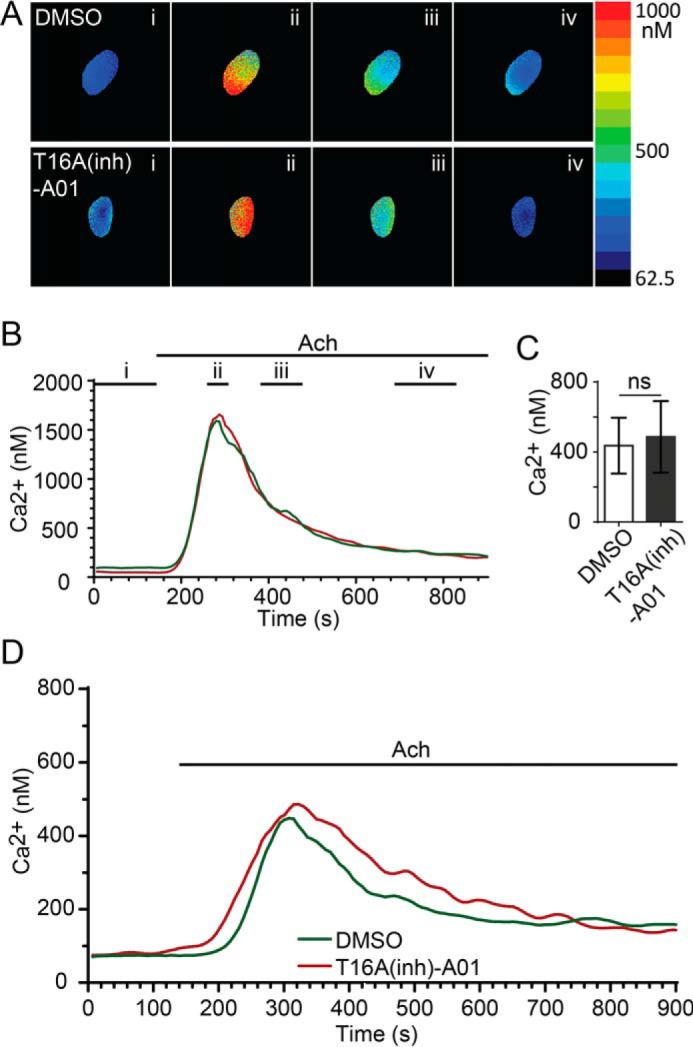
T16Ainh-AO1 does not affect the agonist-evoked calcium response. A and B, application of 200 nm acetylcholine (Ach) induced a rapid rise in intracellular calcium in control (DMSO-treated, n = 10 acini, n = 3 mice) and T16Ainh-A01-treated (10 μm, n = 6 acini, n = 3 mice) pancreatic acini as measured with calibrated Fura-2-loaded cells. A, example images taken at time points i, ii, iii, and iv (indicated in B). B, time traces from the examples shown in A. C and D, the average calcium responses were not different (Student's t test) in the peak (C) or temporal changes (D) between control and T16Ainh-A01 treatment. ns, not significant.
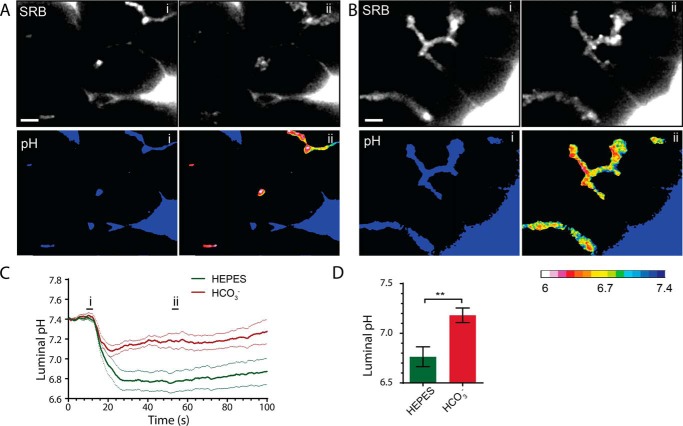
Luminal pH control is of particular importance in cystic fibrosis and acute pancreatitis where, in diseased tissue, the luminal pH can become significantly acidic (1). This is likely to be due to either the imbalance of luminal proton loading from secretion of acidic zymogen granule content (5), which is in excess in acute pancreatitis (6), or the lack of normal HCO3− buffering because of the reduced activity of the CFTR in the ductal cells (1). Our findings that TMEM16A contributes to luminal pH buffering could therefore be of significance for understanding the mechanistic basis of disease. To test this idea, we turned to a commonly used in vitro model of acute pancreatitis, supramaximal stimulation, which recapitulates the early stages of acinar cell damage (6). Fig. 5 shows the responses to 10 nm CCK, a supramaximal stimulation that triggers the fusion of a large number of zymogen granules, as observed by the influx of SRB into granules. These granules rapidly coalesce to form the intracellular vacuoles that characterize the initial stages of acute pancreatitis (Fig. 5, A and B, ii). Bathing the acini in 2 mm HEPES led to a large and relatively sustained drop in luminal pH. In contrast, bathing the cells in 2 mm HCO3− led to a significantly smaller acidic nadir (n = 11 from 4 mice in HEPES, n = 9 from 6 mice in HCO3−, p < 0.01) and, over the time period of recordings, less sustained acidification (Fig. 5, C and D).
FIGURE 5.
Supramaximal CCK stimulation (10 nm) induces a large exocytic response; the consequent acid load in the lumen with HEPES buffer is significantly smaller with HCO3− buffer. A, two-photon live-cell imaging in HEPES buffer before (C, i) and after (C, ii) supramaximal CCK stimulation showing a large exocytic response (SRB) and significant luminal acidification (A, C, and D; see also supplemental Movies 9 and 10). In the presence of HCO3− buffer (B), the exocytic response is similar, but the luminal acidification is much less (B–D, see also supplemental Movies 11 and 12). Scale bars = 5 μm. n ≥ 9 lumens, n ≥ 3 mice. Student's t test; **, p < 0.01.
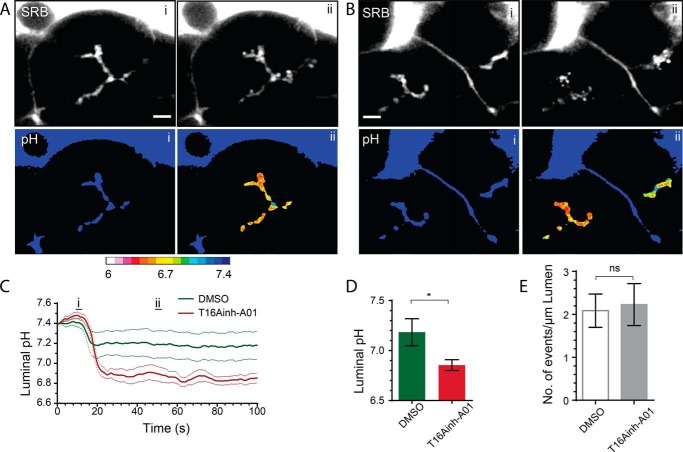
As before, to test for a role of TMEM16A in acute pancreatitis, we pretreated the acini with T16Ainh-A01 and then stimulated them with supramaximal CCK (Fig. 6). The induced fusion of zymogen granules was similar under the two conditions (Fig. 6E). However, luminal acidification was significantly increased in the presence of the inhibitor (Fig. 6, C and D; n = 8 from 5 mice in DMSO, n = 8 from 3 mice with T16Ainh-A01, p < 0.05).
FIGURE 6.
TMEM16A transports HCO3− into the lumen during supramaximal agonist stimulation. Addition of 10 μm T16Ainh-AO1 to HCO3−-buffered solution significantly increased luminal acidification (B–D, see also supplemental Movies 15 and 16) compared with the HCO3−-buffered control responses (A, C, and D, DMSO; see also supplemental Movies 13 and 14). Counts of the numbers of exocytic events per luminal length show that this is not altered in the presence of T16Ainh-AO1 (E). Scale bars = 5 μm. ns, not significant. Student's t test; *, p < 0.05.
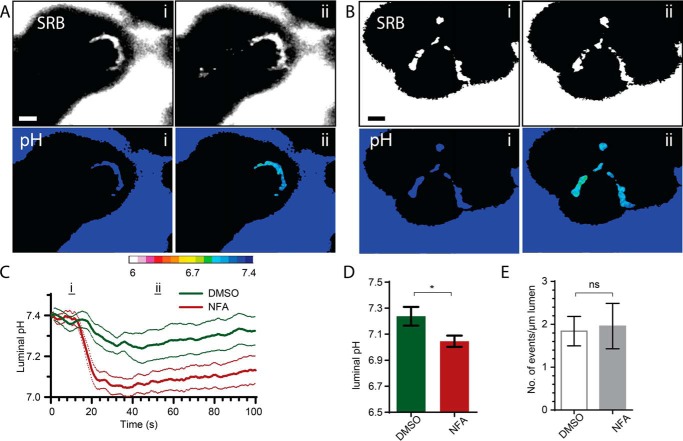
We then tested for consistency of the action of T16Ainh-A01 with the use of another inhibitor of the calcium-dependent chloride channel, niflumic acid. Cells were bathed in 2 Mm HCO3− buffer, stimulated with supramaximal CCK (10 nm) to evoke a response, and tested for the action of 100 μm niflumic acid on luminal acid changes (Fig. 7). As with T16Ainh-A01, we observed a significant increase in luminal pH that was not accompanied by any change in the exocytic response (Fig. 7E). Our data reveal that TMEM16A plays a role in the control of luminal pH that is important in these pathological responses.
FIGURE 7.
Niflumic acid also enhances luminal acidification in response to supramaximal agonist stimulation. Addition of 100 μm niflumic acid (NFA) to HCO3−-buffered solution significantly increased luminal acidification (B–D, see also supplemental Movies 19 and 20) compared with the HCO3−-buffered control responses (A, C, and D, DMSO; see also supplemental Movies 17 and 18). Counts of the numbers of exocytic events per luminal length show that this was not altered in the presence of niflumic acid (E). Scale bars = 5 μm. ns, not significant. Student's t test; *, p < 0.05.
Discussion
The major finding of our study is that, under physiologically relevant stimulation, HCO3− exit through the apical ANO1/TMEM16A channel of pancreatic acinar cells is a significant regulator of intraluminal pH. This observation builds on the biophysical characterization of ANO1/TMEM16A and provides evidence that acinar cells play an active role in regulating the pH of the pancreatic lumen. Furthermore, we show that this channel also plays a role in normalizing the extreme luminal acidification observed in a model of acute pancreatitis.
There is now extensive evidence that supports the idea that ANO1/TMEM16A is the apical agonist-induced, calcium-dependent chloride channel in acinar cells. Immunofluorescence of ANO1/TMEM16A shows that it is present in the apical membrane (7, 9) and that it has the same ion selectivity sequence (7, 18), current rectification (11), and calcium dependence (17, 30) compared with the native calcium-dependent chloride channel (14). Furthermore, chloride flux is significantly reduced in the ANO1/TMEM16A knockout mouse (8). Finally, T16Ainh-AO1 selectively blocks salivary gland chloride conductance (26). We extend these latter studies to show a block of agonist-activated Cl− current in pancreatic acinar cells (Fig. 3).
Protein expression of ANO1/TMEM16A is now enabling a much better characterization of the channel properties in terms of the control of ion permeability and the potential role for calcium regulation. In this context, the cell physiology we describe in this paper is consistent with past biophysical characterization of the calcium control of permeability. Our experiments stimulate the cells with 10 pm CCK, which triggers global calcium oscillations that, as we have shown previously, reach ∼2 μm in the subplasmalemmal domain and activate both zymogen granule exocytosis and opening of the calcium-dependent chloride channel (22). This relatively high concentration of cytosolic calcium is known to elicit changes in ANO1/TMEM16A ion selectivity that can lead to much greater permeability to HCO3−, even up to a PHCO3−/PCl of 1.1 (12).
Our data show that HCO3− efflux through the ANO1/TMEM16A channel must be moving down its electrochemical gradient and is likely to be due to intracellular accumulation of HCO3− through basolateral transporters. For pancreatic acinar cells, there is evidence for a basolateral Na+-HCO3− cotransporter (31) and a Cl−/HCO3− exchanger (32), possibly the Slc4a9 anion exchanger, as found in salivary glands (33). It should be noted that, in the tissue fragments, we have to conduct our experiments using 2 mm buffer concentrations; any higher than this and luminal pH changes cannot be recorded with HPTS (5). Thus, at the higher HCO3− concentrations that normally would be bathing the acinar cells, we would expect a greater driving force for HCO3− entry across the basal pole. We conclude that our work provides evidence to support the physiological relevance of HCO3− exit through TMEM16A in mouse pancreatic acinar cells.
Experimental Procedures
Cell Preparation
Mice were humanely killed according to University of Queensland animal ethics procedures (approved by the University of Queensland Anatomical Biosciences Ethics Committee). Isolated mouse pancreatic tissue was prepared by a collagenase digestion method in normal NaCl-rich extracellular solution (solution A), modified to reduce the time in collagenase and limit mechanical trituration. The resulting preparation was composed mainly of pancreatic lobules and fragments (50–100 cells) that were plated onto poly-l-lysine-coated glass coverslips.
Solutions
Two types of extracellular solutions were used to bathe acini. Solution A contained 135 mm NaCl, 5 mm KCl, 10 mm glucose, 8 mm sucrose, 2 mm MgCl2, 2 mm CaCl2, and 2 mm HEPES (pH 7.4). Solution B contained 135 mm NaCl, 5 mm KCl, 10 mm glucose, 8 mm sucrose, 2 mm MgCl2, 2 mm CaCl2, and 2 mm NaHCO3 (pH 7.4). The HCO3−-buffered solution was bubbled with CO2 prior to and during the experiments.
Live-cell Two-photon Imaging
We used a custom-made, video-rate, two-photon microscope with a ×60 oil immersion objective (numerical aperture 1.42, Olympus) providing an axial resolution (full width, half-maximum) of ∼1 μm. We imaged exocytotic events using SRB (400 μm) as a membrane-impermeant fluorescent extracellular marker excited by femtosecond laser pulses at 950 nm, with fluorescence emission detected at 550–650 nm. To image pH changes, we used extracellular HPTS (400 μm, Thermo Fisher, Scoresby, VIC, Australia) excited at 950 nm and fluorescence detected at 420–520 nm. As a negative control, we also employed 8-methoxypyrene-1,3,6-trisulfonate (400 μm, (Thermo Fisher), which is a pH-insensitive analogue of HPTS. Images (resolution of 10 pixels/μm, average of 15 video frames) were analyzed with the Metamorph program (Molecular Devices Corp., Sunnyvale, CA). Exocytotic event kinetics were measured from regions of interest (0.78 μm2, 78 pixels) centered over individual granules. Traces were rejected when extensive movement was observed. All data are shown as mean ± S.E.
Estimation of Granule pH
The in situ calibration solution contained 130 mm KCl, 1 mm MgCl2, 15 mm MES, 15 mm HEPES, 10 μg/ml nigericin, and 10 μm monensin (pH 4.2–7)). Calibration was carried out on Lysosensor Yellow/Blue DND 160 (Thermo Fisher)-loaded cells after incubating in high-potassium/nigericin solutions at different pH levels. After equilibration in these solutions for 10 min, Lysosensor Yellow/Blue DND 160 was excited at 750 nm, and fluorescence below 490 nm or above 520 nm was recorded. Calibration curves were constructed from these treatments for comparison with experimental measurements (Fig. 3).
Electrophysiology
Cells were whole-cell-patched using pipettes with a resistance of 2–4 megohms when filled with KCl-rich pipette solution. Seal resistance was 10–50 gigaohms, and series resistance was <10 megohms. The pipette solution contained 140 mm KCl, 10 mm NaCl, 1.13 mm MgCl2, 10 mm HEPES-KOH, 2 mm Na2ATP, and 0.1 mm EDTA (pH 7.2). The bath solution contained 135 mm NaCl, 5 mm KCl, 10 mm glucose, 2 mm MgCl2, 2 mm CaCl2, and 10 mm HEPES (pH 7.4).
A voltage pulse protocol stepped the cells from −100 mV to +40 mV (400-ms pulse width) in 10-mV increments. Current/voltage relationships were constructed from the average steady-state current measured 350 ms after the onset of the pulses. All currents were normalized against cell capacitance and expressed as mean ± S.E. (picoampere/picofarad).
Statistics
Unpaired, two-tailed Student's t tests were used for all experiments.
Author Contributions
Y. H., A.M. S., and P. T. designed the experiments. Y. H. performed the experiments. P. T., Y. H., and A. M. S. wrote the paper.
Supplementary Material
This work was supported by Australian Research Council Grant DP110100642 (to P. T.) and National Health and Medical Research Council Grants APP1021764 and APP1059426 (to P. T.). The authors declare that they have no conflicts of interest with the contents of this article.

This article contains supplemental Movies 1–20.
- CFTR
- cystic fibrosis transmembrane regulator
- CCK
- cholecystokinin
- SRB
- sulforhodamine B
- HPTS
- hydroxypyrene-3,6,8-trisulfonate.
References
- 1. Freedman S. D., Kern H. F., and Scheele G. A. (2001) Pancreatic acinar cell dysfunction in CFTR−/− mice is associated with impairments in luminal pH and endocytosis. Gastroenterology 121, 950–957 [DOI] [PubMed] [Google Scholar]
- 2. Dutta S. K., Russell R. M., and Iber F. L. (1979) Influence of exocrine pancreatic insufficiency on the intraluminal pH of the proximal small-intestine. Dig. Dis. Sci. 24, 529–534 [DOI] [PubMed] [Google Scholar]
- 3. Wang Y., Soyombo A. A., Shcheynikov N., Zeng W., Dorwart M., Marino C. R., Thomas P. J., and Muallem S. (2006) Slc26a6 regulates CFTR activity in vivo to determine pancreatic duct HCO3− secretion: relevance to cystic fibrosis. EMBO J. 25, 5049–5057 [DOI] [PMC free article] [PubMed] [Google Scholar]
- 4. Sohma Y., Gray M. A., Imai Y., and Argent B. E. (2001) 150 mM HCO3−: how does the pancreas do it? Clues from computer modelling of the duct cell. JOP 2, 198–202 [PubMed] [Google Scholar]
- 5. Behrendorff N., Floetenmeyer M., Schwiening C., and Thorn P. (2010) Protons released during pancreatic acinar cell secretion acidify the lumen and contribute to pancreatitis in mice. Gastroenterology 139, 1711–1720.e1–5 [DOI] [PubMed] [Google Scholar]
- 6. Hegyi P., Pandol S., Venglovecz V., and Rakonczay Z. Jr. (2011) The acinar-ductal tango in the pathogenesis of acute pancreatitis. Gut 60, 544–552 [DOI] [PMC free article] [PubMed] [Google Scholar]
- 7. Yang Y. D., Cho H., Koo J. Y., Tak M. H., Cho Y., Shim W.-S., Park S. P., Lee J., Lee B., Kim B.-M., Raouf R., Shin Y. K., and Oh U. (2008) TMEM16A confers receptor-activated calcium-dependent chloride conductance. Nature 455, 1210–U1236 [DOI] [PubMed] [Google Scholar]
- 8. Ousingsawat J., Martins J. R., Schreiber R., Rock J. R., Harfe B. D., and Kunzelmann K. (2009) Loss of TMEM16A causes a defect in epithelial Ca2+-dependent chloride transport. J. Biol. Chem. 284, 28698–28703 [DOI] [PMC free article] [PubMed] [Google Scholar]
- 9. Huang F., Rock J. R., Harfe B. D., Cheng T., Huang X., Jan Y. N., and Jan L. Y. (2009) Studies on expression and function of the TMEM16A calcium-activated chloride channel. Proc. Natl. Acad. Sci. U.S.A. 106, 21413–21418 [DOI] [PMC free article] [PubMed] [Google Scholar]
- 10. Romanenko V. G., Catalán M. A., Brown D. A., Putzier I., Hartzell H. C., Marmorstein A. D., Gonzalez-Begne M., Rock J. R., Harfe B. D., and Melvin J. E. (2010) Tmem16A encodes the Ca2+-activated Cl− channel in mouse submandibular salivary gland acinar cells. J. Biol. Chem. 285, 12990–13001 [DOI] [PMC free article] [PubMed] [Google Scholar]
- 11. Caputo A., Caci E., Ferrera L., Pedemonte N., Barsanti C., Sondo E., Pfeffer U., Ravazzolo R., Zegarra-Moran O., and Galietta L. J. (2008) TMEM16A, a membrane protein associated with calcium-dependent chloride channel activity. Science 322, 590–594 [DOI] [PubMed] [Google Scholar]
- 12. Jung J., Nam J. H., Park H. W., Oh U., Yoon J.-H., and Lee M. G. (2013) Dynamic modulation of ANO1/TMEM16A HCO3− permeability by Ca2+/calmodulin. Proc. Natl. Acad. Sci. U.S.A. 110, 360–365 [DOI] [PMC free article] [PubMed] [Google Scholar]
- 13. Novak I., Haanes K. A., and Wang J. (2013) Acid-base transport in pancreas-new challenges. Front. Physiol. 4, 1–7 [DOI] [PMC free article] [PubMed] [Google Scholar]
- 14. Kidd J. F., and Thorn P. (2001) The properties of the secretagogue-evoked chloride current in mouse pancreatic acinar cells. Pflugers Archiv-European Journal of Physiology 441, 489–497 [DOI] [PubMed] [Google Scholar]
- 15. Ishikawa T. (1996) A bicarbonate- and weak acid-permeable chloride conductance controlled by cytosolic Ca2+ and ATP in rat submandibular acinar cells. J. Membr. Biol. 153, 147–159 [DOI] [PubMed] [Google Scholar]
- 16. Zhang G. H., Cragoe E. J. Jr., and Melvin J. E. (1992) Regulation of cytoplasmic pH in rat sublingual mucous acini at rest and during muscarinic stimulation. J. Membr. Biol. 129, 311–321 [DOI] [PubMed] [Google Scholar]
- 17. Ni Y-L., Kuan A-S., Chen T-Y. (2014) Activation and inhibition of TMEM16A calcium-activated chloride channels. PLoS ONE 9, e86734. [DOI] [PMC free article] [PubMed] [Google Scholar]
- 18. Schroeder B. C., Cheng T., Jan Y. N., and Jan L. Y. (2008) Expression cloning of TMEM16A as a calcium-activated chloride channel subunit. Cell 134, 1019–1029 [DOI] [PMC free article] [PubMed] [Google Scholar]
- 19. Kuruma A., and Hartzell H. C. (1999) Dynamics of calcium regulation of chloride currents in Xenopus oocytes. Am. J. Physiol. Cell Physiol. 276, C161–C175 [DOI] [PubMed] [Google Scholar]
- 20. Peters C. J., Yu H., Tien J., Jan Y. N., Li M., and Jan L. Y. (2015) Four basic residues critical for the ion selectivity and pore blocker sensitivity of TMEM16A calcium-activated chloride channels. Proc. Natl. Acad. Sci. U.S.A. 112, 3547–3552 [DOI] [PMC free article] [PubMed] [Google Scholar]
- 21. Yu Y., Kuan A.-S., and Chen T.-Y. (2014) Calcium-calmodulin does not alter the anion permeability of the mouse TMEM16A calcium-activated chloride channel. J. Gen. Physiol. 144, 114–124 [DOI] [PMC free article] [PubMed] [Google Scholar]
- 22. Low J. T., Shukla A., Behrendorff N., and Thorn P. (2010) Exocytosis, dependent on Ca2+ release from Ca2+ stores, is regulated by Ca2+ microdomains. J. Cell Sci. 123, 3201–3208 [DOI] [PubMed] [Google Scholar]
- 23. Deleted in proof
- 24. Thorn P., Fogarty K. E., and Parker I. (2004) Zymogen granule exocytosis is characterized by long fusion pore openings and preservation of vesicle lipid identity. Proc. Natl. Acad. Sci. U.S.A. 101, 6774–6779 [DOI] [PMC free article] [PubMed] [Google Scholar]
- 25. Thorn P., and Parker I. (2005) Two phases of zymogen granule lifetime in mouse pancreas: ghost granules linger after exocytosis of contents. J. Physiol. 563, 433–442 [DOI] [PMC free article] [PubMed] [Google Scholar]
- 26. Namkung W., Phuan P. W., and Verkman A. S. (2011) TMEM16A inhibitors reveal TMEM16A as a minor component of calcium-activated chloride channel conductance in airway and intestinal epithelial cells. J. Biol. Chem. 286, 2365–2374 [DOI] [PMC free article] [PubMed] [Google Scholar]
- 27. Thorn P., Lawrie A. M., Smith P. M., Gallacher D. V., and Petersen O. H. (1993) Local and global cytosolic Ca2+ oscillations in exocrine cells evoked by agonists and inositol trisphosphate. Cell 74, 661–668 [DOI] [PubMed] [Google Scholar]
- 28. Thorn P., and Petersen O. H. (1992) Activation of nonselective cation channels by physiological cholecystokinin concentrations in mouse pancreatic acinar-cells. J. Gen. Physiol. 100, 11–25 [DOI] [PMC free article] [PubMed] [Google Scholar]
- 29. Boedtkjer D. M., Kim S., Jensen A. B., Matchkov V. M., and Andersson K. E. (2015) New selective inhibitors of calcium-activated chloride channels: T16A(inh) -A01, CaCC(inh) -A01 and MONNA: what do they inhibit? Br. J. Pharmacol. 172, 4158–4172 [DOI] [PMC free article] [PubMed] [Google Scholar]
- 30. Terashima H., Picollo A., and Accardi A. (2013) Purified TMEM16A is sufficient to form Ca2+-activated Cl− channels. Proc. Natl. Acad. Sci. U.S.A. 110, 19354–19359 [DOI] [PMC free article] [PubMed] [Google Scholar]
- 31. Muallem S., and Loessberg P. A. (1990) Intracellular pH-regulatory mechanisms in pancreatic acinar-cells: 1: characterization of H+ and HCO3− transporters. J. Biol. Chem. 265, 12806–12812 [PubMed] [Google Scholar]
- 32. Gillespie J. I., Hedley C., Greenwell J. R., and Argent B. E. (1989) Chloride bicarbonate exchange in isolated rat pancreatic acini. Q. J. Exp. Physiol. 74, 883–895 [DOI] [PubMed] [Google Scholar]
- 33. Peña-Münzenmayer G., Catalán M. A., Kondo Y., Jaramillo Y., Liu F., Shull G. E., and Melvin J. E. (2015) AE4 (Slc4a9) Anion exchanger drives Cl- uptake-dependent fluid secretion by mouse submandibular gland acinar cells. J. Biol. Chem. 290, 10677–10688 [DOI] [PMC free article] [PubMed] [Google Scholar]
Associated Data
This section collects any data citations, data availability statements, or supplementary materials included in this article.


