

Abstract
Objective
We addressed two questions regarding health system consolidation through the acquisition of ambulatory clinics: (1) Was increasing health system size associated with improved diabetes care performance and (2) Did the diabetes care performance of acquired clinics improve postacquisition?
Data Sources/Study Setting
Six hundred sixty‐one ambulatory clinics in Minnesota and bordering states that reported performance data from 2007 to 2013.
Study Design
We employed fixed effects regression to determine if increased health system size and being acquired improved clinics' performance. Using our regression results, we estimated the average effect of consolidation on the performance of clinics that were acquired during our study.
Data Collection/Extraction Methods
Publicly reported performance data obtained from Minnesota Community Measurement.
Principal Findings
Acquired clinics experienced performance improvements starting in their third year postacquisition. By their fifth year postacquisition, acquired clinics had 3.6 percentage points (95 percent confidence interval: 2.0, 5.1) higher performance than if they had never been acquired. Increasing health system size was associated with slight performance improvements at the end of the study.
Conclusions
Health systems modestly improved the diabetes care performance of their acquired clinics; however, we found little evidence that systems experienced large, system‐wide performance gains by increasing their size.
Keywords: Health system consolidation, quality, diabetes
Recent health system consolidation has included acquisitions of primary and specialty ambulatory care clinics by systems (Summer 2010; Kirchhoff 2013). Consolidation is advantageous for health systems seeking to increase market share, gain negotiating leverage with health plans, and increase control over referral patterns (Berenson et al. 2012; Coughlin and Gerhardt 2013; Kirchhoff 2013). Many health systems are expanding to keep patients within newly formed Accountable Care Organizations, which are responsible for the quality and costs of a defined population. Consolidation could also benefit physicians of acquired clinics that may have lacked investment capital for health information technology (HIT) and care coordination services (Greenspun, Coughlin, and Stanley 2013).
While consolidation may be financially attractive to health systems making the acquisitions, policy makers are concerned about its anticompetitive consequences. Several antitrust cases have highlighted this concern, including the recent 2014 case of the Federal Trade Commission v. St Luke's Health System, LTD 2014, which resulted in St. Luke's being required to divest its acquisition of a large multispecialty physician group due to potential price increases. Prior literature has presented evidence that health system mergers generally lead to price increases through systems' improved negotiating leverage with health insurers (see Gaynor and Town 2012 for a review). However, supporters of consolidation counter that large, integrated health systems can provide higher quality care, possibly due to the use of health information systems to integrate care and the implementation of system‐wide quality improvement activities (Casalino et al. 2003a; Crosson 2005; Enthoven 2009). Some evidence shows that large, integrated health systems are more likely to implement performance improvement programs and achieve better performance on some process measures of quality than smaller medical groups and independent practices (Mehrotra, Epstein, and Rosenthal 2006; Solberg et al. 2009; Weeks et al. 2010; Leibert 2011).
The impact of consolidation on quality is unclear. Although large health systems may have the potential to provide higher quality care than small systems, decreased competition may result in systems having less incentive to provide the highest quality care. For example, Casalino et al. (2014) found that larger medical practices are associated with higher rates of preventable hospital admissions compared to smaller practices.
Due to a lack of available longitudinal quality data, researchers have had difficulty determining how health system consolidation, through acquisitions of ambulatory clinics, affects quality (Gaynor and Town 2012; Gaynor, Ho, and Town 2014). Minnesota Community Measurement (MNCM) has reported the diabetes care performance of ambulatory clinics in Minnesota and areas of bordering states since 2007, allowing us to capture the performance of clinics before and after acquisition. Throughout the last decade, several large health systems in this region have been consolidating by acquiring the clinics of smaller systems (Christianson, Carlin, and Warrick 2014). We used these longitudinal data to address two questions regarding consolidation: (1) Was increasing health system size in our study area associated with improved diabetes care performance and (2) Did the diabetes care performance of acquired clinics improve postacquisition?
Methods
Study Setting
Our study setting was Minnesota and bordering states, an area dominated by nonprofit integrated delivery systems (Moody and Silow‐Carroll 2009). The diabetes care performance of ambulatory clinics, defined as single‐site locations that offer primary or specialty ambulatory care, has been annually reported by MNCM since 2007 (Minnesota Community Measurement 2014). A 2008 Minnesota statute mandated public reporting for all Minnesota clinics by 2010 based on the existing outcome performance measures reported by MNCM (Healthcare Payment and Pricing Reform 2008). The statute also called for the performance measures to have physician input and minimal administrative burden. Although reporting was made mandatory, there is no apparent penalty for not reporting and about 15 percent of clinics in Minnesota have chosen not to report.
During the time frame of our study (2007–2013), health systems in our study area acquired 100 clinics that reported to MNCM. This consolidation led to approximately a 9 percentage point increase in the number of clinics in health systems with >30 clinics (Figure 1). Further consolidation occurred within the health system sizes presented in Figure 1. In 2009, for example, Sioux Falls–based Sanford Health and rural South Dakota's MeritCare merged, with both systems having >30 clinics at the time of the merger.
Figure 1.
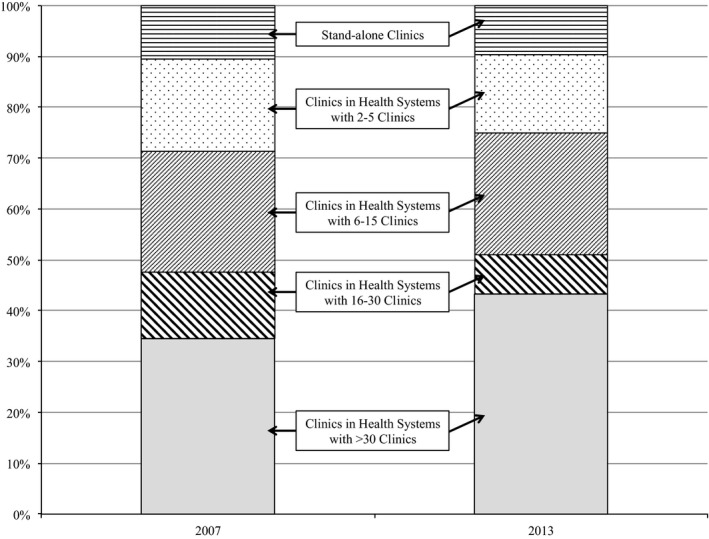
Percentage of Clinics Reporting to Minnesota Community Measurement by Health System Size, 2007 and 2013 Comparison
- Notes: Includes 661 clinics reporting to Minnesota Community Measurement from 2007 through 2013. Clinics were primarily located in Minnesota (572 clinics), with North Dakota (33), Wisconsin (29), South Dakota (24), and Iowa (3) accounting for the remainder.
The analyses conducted in this study do not include the 2013 combination of the Minnesota‐based HealthPartners and Park Nicollet health systems. The combination of these health systems, which occurred during the last year of our study, has been described as neither a merger nor an acquisition and both systems remain separate operating entities (Healthcare Financial Management Association 2014). Regardless, the results presented in this study are robust to coding the two health systems as separate entities or one system in 2013.
Data and Study Population
Approximately 85 percent of Minnesota clinics currently submit performance data to MNCM and some clinics outside of Minnesota voluntarily report (Minnesota Community Measurement 2012). Clinics submit patient‐level data to MNCM from either electronic medical records (EMR) or paper‐based medical charts. These data include a set of five treatment goals: (1) hemoglobin A1c <7 percent (changed to <8 percent in 2009), (2) blood pressure <130/80 mmHg (changed to <140/80 mmHg in 2010), (3) LDL cholesterol <100 mg/dL, (4) daily aspirin use unless contraindicated (changed to include only patients with ischemic vascular disease in 2010), and (5) documented tobacco‐free status. For each clinic, MNCM reports the percent of patients with diabetes achieving each goal. We obtained access to MNCM's clinic‐level performance data from 2007 through 2013.
Our data included 661 unique clinics that reported to MNCM at least once. These clinics were mostly located in Minnesota (572 clinics), with North Dakota (33), Wisconsin (29), South Dakota (24), and Iowa (3) accounting for the remainder. The clinics were grouped as part of health systems, defined by being under the same ownership, or as independent, stand‐alone clinics. The number of clinics reporting to MNCM was 307 for 2007 performance, 390 for 2008, 524 for 2009 (collected in 2010 at the start of mandatory reporting in Minnesota), 527 for 2010, 524 for 2011, 549 for 2012, and 579 for 2013. We used these observations to conduct our analyses.
MNCM data additionally included for each clinic: number of patients with diabetes (available 2007–2013), number of practicing physicians (2009–2013), proportion of patients with diabetes enrolled in Minnesota Health Care Programs (includes Medicaid and other programs for low‐income individuals), Medicare, or private insurance (2009–2013), and whether clinics submitted their data using EMR or paper records (2007–2011). We also determined clinic affiliation with critical access hospitals, federally qualified health center (FQHC) status, and whether a clinic was located in a rural zip code. Of these indicators, only the number of patients with diabetes was included in every year of data as a time‐varying measure and used in our main regression analysis (explained below), which employed clinic‐level fixed effects regression. We also used data submission type (EMR or paper) in a sensitivity analysis using only 2007–2011 data. The remaining indicators were used only to describe the initial conditions of our data (Table 1). For 18 clinics, we lacked any data for the number of practicing physicians and the proportion of patients by payor type, although we did have their performance data in the years they reported. For these clinics, we imputed each missing measure as the mean of the other clinics in their respective health systems.
Table 1.
Initiala Characteristics of Clinics Providing Diabetes Care and Reporting to Minnesota Community Measurement
| Never Acquired Clinics | Acquired Clinics | |||
|---|---|---|---|---|
| In Health Systems with >15 Clinics (N = 276) | In Health Systems with 2–15 Clinics/Stand‐alone Clinics (N = 285) | Acquired from Health Systems with >15 Clinics (N = 38) | Acquired from Health Systems with 2–15 Clinics/Stand‐alone Clinics (N = 62) | |
| Mean diabetes care performanceb | ||||
| Overall percent (SD) | 70.4 (8.0) | 64.0 (9.5) | 65.2 (7.0) | 61.7 (7.2) |
| Physiological percent (SD) | 60.2 (9.9) | 53.8 (11.1) | 52.1 (8.9) | 49.8 (8.2) |
| Behavioral percent (SD) | 85.8 (7.3) | 79.4 (10.2) | 84.8 (6.2) | 79.5 (8.2) |
| Blood pressure percent (SD) | 60.2 (16.2) | 52.1 (18.0) | 47.1 (11.4) | 45.6 (11.1) |
| Hemoglobin A1c percent (SD) | 62.2 (12.1) | 61.7 (12.7) | 56.6 (9.5) | 55.2 (12.4) |
| LDL cholesterol percent (SD) | 58.1 (9.7) | 47.7 (13.3) | 52.5 (12.1) | 48.4 (12.5) |
| Daily aspirin use percent (SD) | 89.6 (11.4) | 80.4 (15.4) | 88.2 (7.8) | 79.1 (10.8) |
| Tobacco‐free status percent (SD) | 81.9 (6.8) | 78.3 (11.6) | 81.3 (7.4) | 79.9 (9.8) |
| Median number of physicians practicing in clinic (SD) | 14.0 (199.2) | 7.0 (20.3) | 9.0 (16.3) | 9.5 (11.9) |
| Median number of patients with diabetes seen in clinic (SD) | 291.5 (504.3) | 133.0 (351.4) | 194.0 (212.6) | 240.5 (285.6) |
| Percentage of clinics affiliated with a critical access hospital | 10.1 | 10.9 | 7.9 | 4.8 |
| Percentage of clinics affiliated with a federally qualified health center | 0.7 | 9.1 | 0.0 | 0.0 |
| Percentage of rurally located clinics | 29.3 | 35.1 | 55.3 | 27.4 |
| Mean percentage of patients with diabetes by payor | ||||
| Private insurance (SD) | 47.1 (11.0) | 41.2 (16.4) | 51.9 (24.7) | 45.0 (9.4) |
| Medicare (SD) | 38.1 (9.5) | 37.1 (12.6) | 32.5 (21.3) | 40.7 (7.5) |
| Minnesota health care programs (SD) | 14.8 (6.9) | 21.1(19.4) | 15.8 (9.1) | 14.2 (6.7) |
| Percentage of clinics submitting data using electronic medical records versus paper records | 88.2 | 62.9 | 94.7 | 37.1 |
Includes 661 clinics reporting to Minnesota Community Measurement 2007–2013.
Initial conditions are clinics' characteristics in their first year of reporting to Minnesota Community Measurement. Initial conditions are always preacquisition for acquired clinics.
The performance of each clinic was measured using the percentage of patients with diabetes meeting five separate treatment goals. These treatment goals are (1) hemoglobin A1c <7% (changed to <8% in 2009), (2) blood pressure <130/80 mmHg (changed to <140/80 mmHg in 2010), (3) LDL cholesterol <100 mg/dL, (4) daily aspirin unless contraindicated (changed to include only patients with ischemic vascular disease in 2010), and (5) documented tobacco‐free status. Overall performance is the mean of all five measures. Physiological performance is the mean of the hemoglobin A1c, blood pressure, and LDL cholesterol measures. Behavioral performance is the mean of the daily aspirin and documented tobacco‐free status measures.
Measures
Performance
We defined the overall diabetes care performance of each clinic as the average over the five treatment goals. Because achievement of some goals relies heavily on patient behaviors, we created two additional performance measures; physiological diabetes care performance, defined as the mean of the hemoglobin A1c, blood pressure, and LDL cholesterol goals; and behavioral diabetes care performance, defined as the mean of the daily aspirin and documented tobacco‐free status indicators.
Acquisition
We attributed acquired clinics to their new health systems based on their acquisition dates. Clinics acquired between July 1, 2007, and June 30, 2008, were attributed to their new health systems beginning in 2008. We used the same rule for each subsequent July 1 to June 30 time period. Therefore, the first performance measures of acquired clinics attributed to their new health systems required acquired clinics to have been part of their new systems for at least 6 months.
Health System Size
We measured health system size by number of clinics. Health system size varied over time based on when we attributed acquired clinics to their new systems. This measure also accounts for openings and closings (approximately 5 percent of all clinics) that occurred during our study.
Statistical Analysis
We used clinic‐level, fixed effects regression to address whether health system consolidation affected clinics' diabetes care performance. We controlled for variation in the number of clinics in each health system to determine if increasing health system size affected performance. We also controlled for whether a clinic was acquired to determine if acquired clinics improved postacquisition. Specifically, we modeled the performance of clinic i within health system j at time t as:
where NumClinics jt is the number of clinics in clinic i's health system during year t and the binary indicator Acquired it is equal to 1 after clinic i is acquired and equal to 0 otherwise. We interacted Acquired it with NumClinics jt and NumClinics i , a measure of clinic i's initial health system size, to allow for heterogeneity in the effect of acquisition associated with changes in system size. We used acquisition duration dummy variables (AcquisitionYear it) to allow the effect of acquisition on performance to differ over time. These dummy variables start with Year 1, the first year that acquired clinics were attributed to their new health systems, and continue up to Year 5. The reference category is preacquisition/never acquired.
We controlled for time effects by including dummy variables (τ t) for each year using 2007 as the reference year. In addition to controlling for improvements in performance over time, the year variables controlled for changes in measure definitions. We interacted NumClinics jt with τ t to allow the effect of health system size to vary over time. Our model also included the number of patients with diabetes seen at each clinic (NumPatients it). All time‐invariant clinic attributes were controlled for by clinic fixed effects (α i). Lastly, ε ijt is the error term. We clustered our standard errors by clinic to control for correlation between observations over time.
We used the results of our regression model to determine how consolidation (both being acquired and changes to health system size) affected the performance of the 100 clinics acquired in our data. For each acquired clinic, this effect is the percentage point difference in its predicted postacquisition performance relative to its predicted performance if it had never been acquired. We predicted each acquired clinic's postacquisition performance by applying the regression coefficients to its observed data. We predicted never acquired performance by setting NumClinics jt equal to NumClinics i for all years (i.e., what acquired clinics' system sizes would be if they were never acquired), setting Acquired it and AcquisitionYear it to 0 for all years, and then applying the regression coefficients.
To obtain summary measures of the effect of consolidation at the acquired clinics, we calculated the mean consolidation effect for each postacquisition year weighted by the number of patients at each clinic. We estimated confidence intervals for these summary measures using bootstrapping. We drew random samples (equal to the full sample size) with replacement and reestimated our regression analysis and mean consolidation effect calculations 200 times. We use the 2.5th and 97.5th percentiles of each of the 200 average consolidation effects as 95 percent confidence intervals.
Sensitivity Analyses
As part of consolidation, clinics that join large health systems may receive upgraded HIT capabilities. Past research has found that larger health systems are better at implementing some forms of HIT than smaller systems (Casalino et al. 2003b). While our data lacked comprehensive measures of HIT capacity, we did observe whether clinics submitted their performance data via EMR or paper records from 2007 to 2011. We reestimated our regression model with 2007–2011 data and included a binary indicator equal to 1 if clinic i submitted data using EMR at time t. We interacted this measure with the NumClinics jt and Acquired it indicators to determine if performance changes due to health system size or acquisition were different for clinics that switched to EMR data submission.
We also considered whether differences between the preacquisition performance of acquired and never acquired clinics could bias our results. If health systems predominantly acquired low‐performing clinics then our results may be susceptible to bias due to the nonrandom selection of clinics into acquisitions. To test for this possibility, we reestimated our regression analysis with the inclusion of a variable indicating whether clinic i was acquired in the following year (i.e., a lead of Acquired it). A significant and negative coefficient on this variable would suggest that acquired clinics had, on average, lower performance than never acquired clinics in the year prior to acquisition even with the controls of our model.
All analyses were conducted using Stata Version 13 (StataCorp LP; College Station, TX, USA).
Results
Descriptive Statistics
Health systems acquired 100 clinics in our data from 2007 to 2013 with most clinics attributed to their new health systems in 2008 (28 clinics) and 2010 (40 clinics). Fifty‐four percent of acquired clinics originated in health systems with 2–15 clinics and 38 percent originated in systems with >15 clinics. The remaining acquired clinics were initially stand‐alone clinics (8 percent).
Table 1 reports initial differences between clinics that were acquired during our study period and clinics that were never acquired. Initial conditions are clinics' characteristics in their first year reporting to MNCM. For acquired clinics, initial conditions are always preacquisition. We divided both the acquired and never acquired clinics by health system size (>15 clinics or 2–15 clinics/stand‐alone clinics) for illustrative purposes.
Initial physiological and behavioral diabetes care performance, as well as overall performance, was highest at clinics in health systems with >15 clinics. Of clinics in health systems with >15 clinics, never acquired clinics had, on average, 5.2 percentage points (p‐value <.001) higher initial overall performance and 8.1 percentage points (p‐value <.001) higher initial physiological performance than acquired clinics. For clinics in health systems with 2–15 clinics/stand‐alone clinics, never acquired clinics had 4.1 percentage points (p‐value = .007) higher initial physiological performance than acquired clinics, although no significant difference for initial overall performance existed. Within each health system size category, initial behavioral performance was similar regardless of whether a clinic was acquired.
Acquired and never acquired clinics from similarly sized health systems did not have a significantly different number of patients with diabetes or number of providers. Never acquired clinics from health systems with 2–15 clinics/stand‐alone clinics had fewer patients with diabetes enrolled in private insurance and more enrolled in Minnesota Health Care Programs than the other clinic categories, although this occurrence was in large part due to this group of clinics including FQHCs. No acquired clinic was an FQHC.
Trends in overall diabetes care performance at acquired and never acquired clinics are shown in Figure 2. Note that the acquired clinic trend lines include clinics that were acquired at any point during our study. For example, in 2008 all 100 acquired clinics are included in the acquired clinic trend lines, although only 28 clinics had actually been acquired by 2008. A steep increase in overall performance was experienced by all clinics from 2008 to 2010. This large increase in performance is primarily attributed to changes to the definitions of the hemoglobin A1c, blood pressure, and daily aspirin measures (McCullough et al. 2015). The never acquired clinics from health systems with >15 clinics had the highest performance during all years. The remaining never acquired clinics and the acquired clinics had similar performance from 2007 to 2010. After 2010, the performance of the acquired clinics improved relative to the never acquired clinics from health systems with 2–15 clinics/stand‐alone clinics and began to converge with the performance of the never acquired clinics from health systems with >15 clinics. The improvement of the acquired clinics relative to the never acquired clinics was primarily restricted to physiological performance (Figure S1) with little improvement in behavioral performance (Figure S2). Trends for each individual performance measure are available in Figures S3–S7.
Figure 2.
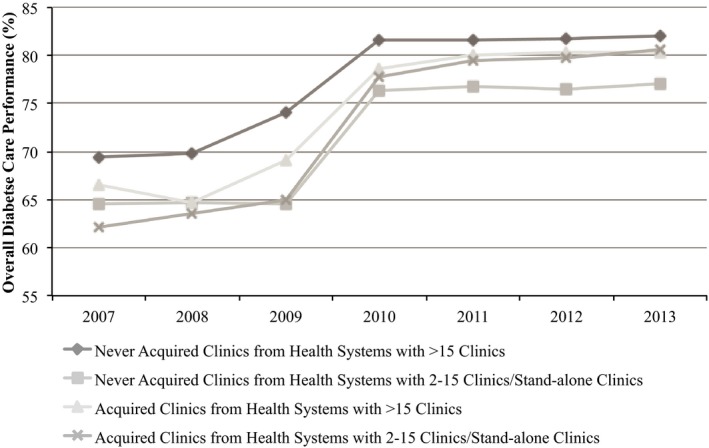
Overall Diabetes Care Performance* for Clinics Reporting to Minnesota Community Measurement
- Notes: Includes 661 clinics reporting to Minnesota Community Measurement during 2007–2013. *The performance of each clinic was measured using the percentage of patients with diabetes meeting five separate treatment goals. These treatment goals are (1) hemoglobin A1c <7 percent (changed to <8 percent in 2009), (2) blood pressure <130/80 mmHg (changed to <140/80 mmHg in 2010), (3) LDL cholesterol <100 mg/dL, (4) daily aspirin unless contraindicated (changed to include only patients with ischemic vascular disease in 2010), and (5) documented tobacco‐free status. Overall performance is the mean of all five measures.
Health System Size and Performance
Table 2 presents the effect of health system size on diabetes care performance. The coefficient on “Current number of clinics in system” represents the average increase in clinic performance for a one‐clinic increase in health system size for a never acquired clinic in 2007. In the remaining years, the effect of a one‐clinic increase on performance is the sum of the coefficient on “Current number of clinics in system” and the coefficient on the corresponding year interaction term (e.g., “Current number of clinics in system*2008”). In 2007, never acquired clinics' overall performance increased by 0.27 percentage points (95 percent confidence interval [CI]: 0.15, 0.39) per one‐clinic increase in health system size. Performance improvements associated with health system size decreased over time. For 2008, overall performance increased by 0.21 (0.27 − 0.06) percentage points (95 percent CI: 0.10, 0.31) per one‐clinic increase in health system size and by 2013 the effect size was only 0.13 (0.27 − 0.14) percentage points (95 percent CI: 0.03, 0.22) per one‐clinic increase. For health systems that acquired clinics during our study, the mean number of clinics acquired was 7.2, implying that at the end of the study increasing health system size was associated with an average overall performance improvement of 0.9 (0.13*7.2) percentage points at never acquired clinics within health systems that made acquisitions.
Table 2.
Clinic Performance on Diabetes Care,a Estimated Using Fixed Effects Regression
| Overall Performance | Physiological Performance | Behavioral Performance | ||||
|---|---|---|---|---|---|---|
| Adjusted Percentage Points (95% CI) | p‐value | Adjusted Percentage Points (95% CI) | p‐value | Adjusted Percentage Points (95% CI) | p‐value | |
| Current number of clinics in system | 0.27 (0.15, 0.39) | <.001 | 0.24 (0.13, 0.36) | <.001 | 0.30 (0.11, 0.49) | .002 |
| Current number of clinics in system interacted with year (Reference = 2007) | ||||||
| Current number of clinics in system*2008 | −0.06 (−0.10, −0.02) | .003 | −0.07 (−0.12, −0.02) | .010 | −0.05 (−0.09, −0.01) | .018 |
| Current number of clinics in system*2009 | −0.02 (−0.07, 0.02) | .337 | −0.03 (−0.09, 0.02) | .228 | −0.003 (−0.054, 0.049) | .916 |
| Current number of clinics in system*2010 | −0.11 (−0.16, −0.07) | <.001 | −0.08 (−0.14, −0.02) | .005 | −0.17 (−0.21, −0.12) | <.001 |
| Current number of clinics in system*2011 | −0.12 (−0.17, −0.08) | <.001 | −0.11 (−0.16, −0.05) | <.001 | −0.15 (−0.19, −0.10) | <.001 |
| Current number of clinics in system*2012 | −0.14 (−0.18, −0.10) | <.001 | −0.12 (−0.17, −0.06) | <.001 | −0.18 (−0.23, −0.13) | <.001 |
| Current number of clinics in system*2013 | −0.14 (−0.19, −0.10) | <.001 | −0.11 (−0.17, −0.05) | <.001 | −0.19 (−0.24, −0.15) | <.001 |
| Acquired | 6.08 (3.31, 8.85) | <.001 | 7.27 (3.75, 10.79) | <.001 | 4.30 (1.36, 7.24) | .004 |
| Acquisition duration (Reference = Preacquisition/Never acquired) | ||||||
| Year 1 | −6.61 (−8.75, −4.46) | <.001 | −7.26 (−9.70, −4.82) | <.001 | −5.62 (−7.73, −3.51) | <.001 |
| Year 2 | −6.88 (−8.96, −4.81) | <.001 | −7.37 (−9.52, −5.22) | <.001 | −6.15 (−8.62, −3.67) | <.001 |
| Year 3 | −4.25 (−5.82, −2.68) | <.001 | −4.88 (−6.77, −2.99) | <.001 | −3.30 (−4.78, −1.82) | <.001 |
| Year 4 | −3.50 (−4.95, −2.04) | <.001 | −3.96 (−5.70, −2.21) | <.001 | −2.80 (−4.20, −1.41) | <.001 |
| Year 5 | −2.49 (−3.76, −1.23) | <.001 | −2.79 (−4.42, −1.16) | .001 | −2.04 (−3.27, −0.81) | .001 |
| Acquired*Current number of clinics in system | −0.12 (−0.23, −0.02) | .017 | −0.104 (−0.204, −0.003) | .043 | −0.15 (−0.33, 0.02) | .077 |
| Acquired*Initial number of clinics in system | 0.119 (−0.002, 0.241) | .054 | 0.08 (−0.05, 0.20) | .229 | 0.18 (−0.01, 0.37) | .060 |
| Year (Reference = 2007) | ||||||
| 2008 | 2.31 (1.20, 3.41) | <.001 | 2.97 (1.58, 4.37) | <.001 | 1.31 (0.09, 2.54) | .036 |
| 2009 | 4.95 (3.74, 6.17) | <.001 | 9.04 (7.49, 10.59) | <.001 | −1.18 (−2.56, 0.21) | .096 |
| 2010 | 16.80 (15.68, 17.92) | <.001 | 20.46 (19.01, 21.90) | <.001 | 11.32 (10.13, 12.51) | <.001 |
| 2011 | 17.58 (16.42, 18.73) | <.001 | 22.13 (20.62, 23.64) | <.001 | 10.75 (9.56, 11.95) | <.001 |
| 2012 | 18.04 (16.88, 19.20) | <.001 | 22.03 (20.52, 23.54) | <.001 | 12.04 (10.84, 13.25) | <.001 |
| 2013 | 18.69 (17.53, 19.85) | <.001 | 22.63 (21.11, 24.15) | <.001 | 12.77 (11.58, 13.96) | <.001 |
| Patients with diabetes (per 10 patients) | −0.01 (−0.02, 0.01) | .467 | −0.002 (−0.022, 0.018) | .846 | −0.013 (−0.029, 0.004) | .134 |
| Constant | 58.79 (56.22, 61.36) | <.001 | 46.75 (44.13, 49.38) | <.001 | 76.83 (72.86, 80.81) | <.001 |
| Clinic fixed effects | Yes | Yes | Yes | |||
| R 2 | 0.50 | 0.48 | 0.34 | |||
Analysis included 3,400 clinic‐year observations from 661 clinics reporting to Minnesota Community Measurement during 2007–2013. Confidence intervals and p‐values adjusted for correlation between observations from the same clinic by clustering standard errors by clinic.
The performance of each clinic was measured using the percentage of patients with diabetes meeting five separate treatment goals. These treatment goals are (1) hemoglobin A1c <7% (changed to <8% in 2009), (2) blood pressure <130/80 mmHg (changed to <140/80 mmHg in 2010), (3) LDL cholesterol <100 mg/dL, (4) daily aspirin unless contraindicated (changed to include only patients with ischemic vascular disease in 2010), and (5) documented tobacco‐free status. Overall performance is the mean of all five measures. Physiological performance is the mean of the hemoglobin A1c, blood pressure, and LDL cholesterol measures. Behavioral performance is the mean of the daily aspirin and documented tobacco‐free status measures.
For acquired clinics, the overall performance improvement associated with increasing health system size was smaller relative to never acquired clinics as indicated by the negative and significant coefficient on the interaction “Acquired*Current number of clinics in system.” By the end of the study, changes in health system size were not associated with any overall performance improvement for acquired clinics (i.e., the sum of the coefficients on “Current number of clinics in System,” Current number of clinics in system*2013,” and “Acquired*Current number of clinics in system” was not significantly different than 0).
The association between increasing health system size and physiological performance, as well as behavioral performance, was similar to the association of system size and overall performance. However, no significant association between health system size and behavioral performance, for either acquired or never acquired clinics, was present at the end of the study.
We considered the possibility that a ceiling effect may have contributed to diminishing returns to consolidation. Clinics in large health systems, which were generally of higher quality, may have been unable to further improve in the latter years of our study, allowing low‐performing clinics to catch up. We found that the distribution of performances for clinics in large health systems became increasingly skewed left (i.e., clustering of higher performance scores) throughout the study period (Figure S8). We do not, however, find a dense mass at the upper end of the performance distribution. These findings suggest that a hard ceiling does not hamper diabetes performance improvement for clinics in our study.
Performance of Acquired Clinics
Figure 3 presents the average postacquisition performance improvement of the 100 acquired clinics in our study by comparing their predicted postacquisition performance to their predicted performance if they had never been acquired. This performance improvement takes into account both the effect of increasing health system size (from the above analysis) and the independent effect of being acquired. The effect of being acquired is captured by the coefficients on “Acquired” and the acquisition duration dummy variables in the regression model in Table 2. The acquisition effect after any duration is the sum of the coefficients on “Acquired” and the corresponding acquisition duration dummy variable (e.g., “Year 1”). Because we found almost no effect of health system size on performance for the acquired clinics, the performance improvements related to consolidation shown in Figure 3 are nearly entirely due to the independent effect of being acquired.
Figure 3.
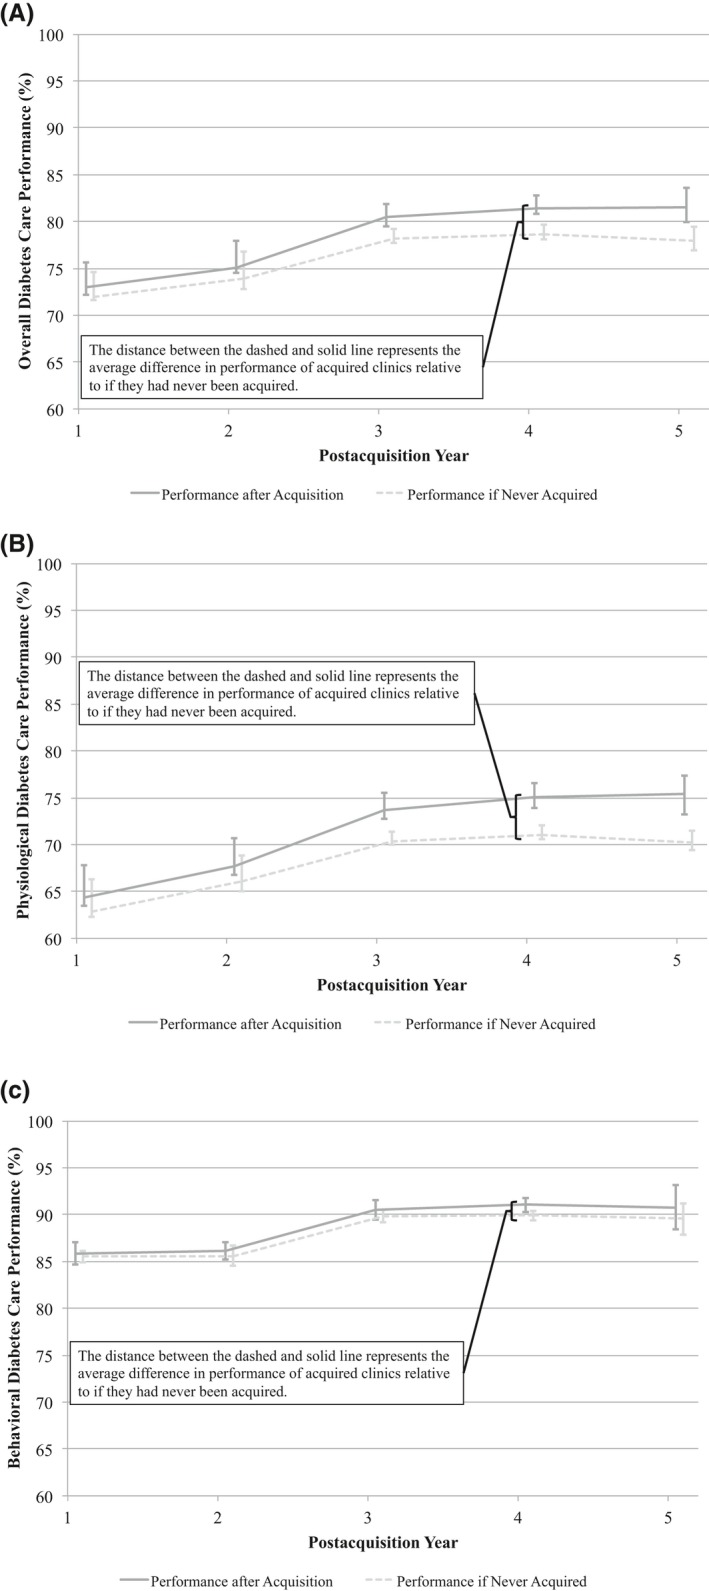
Predicted Diabetes Care Performance* for Acquired Clinics Relative to if They Had Never Been Acquired: (A) Overall Performance, (B) Physiological Performance, and (C) Behavioral Performance
Notes: Analysis included 391 clinic‐year observations from 100 clinics that reported to Minnesota Community Measurement during 2008–2013 and were acquired by a health system. Predicted performances calculated using the regression results of Table 2. Predicted never acquired performance held health system size constant at initial systems sizes. Average predicted performance for each year is the average performance of all acquired clinics weighted by the number of patients with diabetes at each clinic. *The performance of each clinic was measured using the percentage of patients with diabetes meeting five separate treatment goals. These treatment goals are (1) hemoglobin A1c <7 percent (changed to <8 percent in 2009), (2) blood pressure <130/80 mmHg (changed to <140/80 mmHg in 2010), (3) LDL cholesterol <100 mg/dL, (4) daily aspirin unless contraindicated (changed to include only patients with ischemic vascular disease in 2010), and (5) documented tobacco‐free status. Overall performance is the mean of all five measures. Physiological performance is the mean of the hemoglobin A1c, blood pressure, and LDL cholesterol measures. Behavioral performance is the mean of the daily aspirin and documented tobacco‐free status measure.
Consolidation had no significant effect on overall (Figure 3A) or physiological (Figure 3B) performance until the third year postacquisition. At 3 years postacquisition, acquired clinics had 2.3 percentage points (95 percent CI: 1.1, 3.4) higher overall performance and 3.4 percentage points (95 percent CI: 1.8, 4.7) higher physiological performance than if they had never been acquired. These effects modestly increased with duration and by the fifth year postacquisition, acquired clinics had 3.6 percentage points (95 percent CI: 2.0, 5.1) higher overall performance and 5.2 percentage points (95 percent CI: 3.0, 7.2) higher physiological performance than if they had never been acquired. We found no differences in behavioral performance whether a clinic was acquired or not (Figure 3C).
Sensitivity Analyses
EMR data submission was associated with slightly higher overall and behavioral performance relative to paper records data submission as health system size increased (Table S1). EMR data submission was associated with 0.059 percentage points (95 percent CI: 0.002, 0.116) higher overall performance and 0.12 percentage points (95 percent CI: 0.04, 0.20) higher behavioral performance per one‐clinic increase in health system size. However, we still found an independent effect of health system size on performance after controlling for data submission type, implying that EMR data submission did not account for all of the performance improvement associated with increasing health system size. Furthermore, switching from paper records to EMR data submission was not associated with performance improvements for acquired clinics compared to never acquired clinics. These results may suggest that consolidation allowed health systems to realize slight, system‐wide performance gains with HIT; however, performance improvements were not attributable to simply switching acquired clinics to EMR data submission.
If health systems acquired predominantly low‐performing clinics, then our results may be susceptible to bias due to the nonrandom selection of clinics into acquisitions. To test for this possibility, we reestimated our regression analysis with the inclusion of a variable indicating whether a clinic was acquired in the following year (Table S2). A significant and negative coefficient on this variable would suggest that acquired clinics had lower performance than never acquired clinics in the year prior to acquisition even after applying the controls of our model. However, we found this coefficient was insignificant, implying no significant difference between the performance of acquired clinics and never acquired clinics in the year prior to acquisition after applying the controls of our model.
Discussion
In our study setting, health systems consolidated through the acquisition of ambulatory clinics. Health systems modestly improved the diabetes care performance of their acquired clinics. By the third year postacquisition, acquired clinics had 2.3 percentage points higher overall diabetes care performance than if they had never been acquired. This effect persisted to the end of our study. Increasing health system size was associated with slight increases in diabetes care performance.
Potential explanations for the performance improvements due to acquisition include the implementation of quality improvement initiatives and access to HIT, which are both more prominent at larger health systems. Membership in a large health system also expands physicians' access to resources for performance improvement and often gives physicians critical feedback needed to increase performance (Casalino et al. 2003a; Burns and Muller 2008). Several studies have found that large and integrated medical groups are more likely to use evidence‐based care processes (Casalino et al. 2003b; Rittenhouse et al. 2004; Mehrotra, Epstein, and Rosenthal 2006). Mehrotra, Epstein, and Rosenthal (2006) reported a higher percentage of patients in integrated medical groups receiving preventive screenings, an asthma controller medication, or a beta‐blocker after acute myocardial infarction compared to patients receiving care in independent practice associations. Similarly, large medical groups associated with health systems are more likely to use care management processes for chronic diseases, including specifically for diabetes, compared to independent practice associations and solo physicians (Casalino et al. 2003b). Although our sensitivity analysis showed that switching to EMR data submission was not associated with increased performance at acquired clinics, this indicator was not a comprehensive measure of HIT capabilities. More advanced HIT in large systems may facilitate the use of standardized guidelines and algorithms via electronic decision‐support systems. Casalino et al. (2003b) found that HIT was positively associated with the use of specific care processes in medical groups with more than 20 physicians compared to independent providers.
Our analysis showed that increasing health system size was associated with only small increases in performance. This result implies that large health systems in our study area were unable to make large, system‐wide diabetes care performance improvements through consolidation. Kralewski et al. (2014), who also used MNCM data, found that physician‐owned medical groups, which tend to be small systems and stand‐alone clinics, outperformed integrated delivery systems in diabetes care. The lack of performance improvement associated with increasing health system size may be due to monitoring and coordination challenges faced by large integrated systems, as found by McCullough and Snir (2010).
The consequences of health system consolidation are of great interest to policy makers. Several provisions in the Affordable Care Act of 2010 may have prompted health systems to consolidate to achieve higher quality care at the population level (Kirchhoff 2013). However, these policies raise antitrust concerns as consolidation may decrease competition, giving health systems the capacity to command higher prices, and lowering incentives to provide high‐quality, low‐cost care. Studying the effect of health system consolidation on competition and costs was outside the scope of this research project. However, our results do suggest that consolidation, at least in our study area, had no negative effect on the diabetes care performance of ambulatory clinics.
Several limitations of our analysis should be noted. First, Minnesota's larger health systems have been consolidating for decades and are nearly all vertically integrated, providing a continuum of multispecialty outpatient and inpatient care (Moody and Silow‐Carroll 2009; Christianson, Carlin, and Warrick 2014). Therefore, our results may be less applicable to areas not dominated by vertically integrated systems. However, evidence suggests that vertically integrated systems are becoming more common, and are growing in size, across the United States (Kocher and Sahni 2011; Baker, Bundorf, and Kessler 2014).
Second, Minnesota is also unique in having publicly reported performance, and having mandated reporting beginning in 2010. Health systems may have felt pressured to improve the performance of their acquired clinics because they would be openly reporting their performance. If this occurrence is true, then some of the performance improvements at the acquired clinics are potentially attributable to locating in an area with public reporting. However, any impact that public reporting has on our results is reduced when all clinics (acquired and never acquired) similarly respond to public reporting. In our setting, all clinics faced a similar incentive to improve performance regardless if they were acquired or not because reporting became mandatory in 2010. Comparatively, in markets outside of our study area with voluntary reporting, clinics may have more heterogeneous responses to public reporting because low‐performing clinics could opt to not report.
Third, we focused only on diabetes care performance. Diabetes is commonly an emphasis of public reporting, signifying the importance placed on improving care in this area (Christianson et al. 2010). Kralewski et al. (2014) found little correlation between diabetes care performance and other performance measures such as the rate of inappropriate emergency room visits and cervical cancer screening rates. However, our results are likely generalizable to vascular disease performance as measured by MNCM as their vascular disease performance measures include four of the five diabetes treatment goals (excludes the Hemoglobin A1c goal). Future work should focus on addressing how consolidation affects health systems' performance for different illnesses.
Fourth, we were unable to determine the mechanisms that led to higher performance at acquired clinics. Future studies that determine how health systems achieve higher performance at acquired clinics will be beneficial to researchers and systems seeking to implement performance improvement interventions at newly acquired clinics. Such research likely would need to include qualitative components, such as interviewing leaders and frontline providers at consolidating health systems, alongside quantitative analysis.
Fifth, we defined health systems as groups of clinics under the same ownership. However, some health systems may be decentralized and allow clinics to act relatively independently. Our data did not allow us to control for health systems' level of centralization. We would expect that consolidation could have less effect in decentralized health systems.
Conclusion
Our analysis used a longitudinal dataset to examine the association between health system consolidation and clinic performance for patients with diabetes. Acquired clinics' performance improved after joining larger health systems, although not until their third year postacquisition. However, we did not find that health systems experienced large, system‐wide performance improvements that were associated with increasing health system size.
Supporting information
Appendix SA1: Author Matrix.
Table S1. Clinics Performance on Diabetes Care Controlling for Electronic Medical Records versus Paper Records Data Submission, Estimated Using Fixed Effects Regression.
Table S2. Clinic Performance on Diabetes Care Controlling for Being Acquired in Following Year, Estimated Using Fixed Effects Regression.
Figure S1. Physiological Diabetes Care Performance for Clinics Reporting to Minnesota Community Measurement.
Figure S2. Behavioral Diabetes Care Performance for Clinics Reporting to Minnesota Community Measurement.
Figure S3. Blood Pressure Performance on Diabetes Care for Clinics Reporting to Minnesota Community Measurement.
Figure S4. Hemoglobin A1c Performance on Diabetes Care for Clinics Reporting to Minnesota Community Measurement.
Figure S5. LDL Cholesterol Performance on Diabetes Care for Clinics Reporting to Minnesota Community Measurement.
Figure S6. Daily Aspirin Performance on Diabetes Care for Clinics Reporting to Minnesota Community Measurement.
Figure S7. Tobacco‐Free Status Performance for Clinics Reporting to Minnesota Community Measurement.
Figure S8. Distribution of Overall Diabetes Care Performance for Clinics in Health Systems with More Than Fifteen Clinics, 2007 and 2013 Comparison.
Acknowledgments
Joint Acknowledgment/Disclosure Statement: This research was funded in part by a grant from Pennsylvania State University to the University of Minnesota as part of the evaluation of the Robert Wood Johnson Foundation's Aligning Forces for Quality Initiative. The funding sources had no role in the design and conduct of the study; collection, analysis, and interpretation of data; and preparation of the manuscript. We are also grateful for the comments from the journal's referees.
Disclosures: None.
Disclaimers: None.
References
- Baker, L. C. , Bundorf M. K., and Kessler D. P.. 2014. “Vertical Integration: Hospital Ownership of Physician Practices Is Associated with Higher Prices and Spending.” Health Affairs 33 (5): 756–63. doi:10.1377/hlthaff.2013.1279. [DOI] [PubMed] [Google Scholar]
- Berenson, R. A. , Ginsburg P. B., Christianson J. B., and Yee T.. 2012. “The Growing Power of Some Providers to Win Steep Payment Increases from Insurers Suggests Policy Remedies May Be Needed.” Health Affairs 31 (5): 973–81. doi:10.1377/hlthaff.2011.0920. [DOI] [PubMed] [Google Scholar]
- Burns, L. R. , and Muller R. W.. 2008. “Hospital‐Physician Collaboration: Landscape of Economic Integration and Impact on Clinical Integration.” Milbank Quarterly 86 (3): 375–434. doi:10.1111/j.1468‐0009.2008.00527.x. [DOI] [PMC free article] [PubMed] [Google Scholar]
- Casalino, L. P. , Devers K. J., Lake T. K., Reed M., and Stoddard J. J.. 2003a. “Benefits of and Barriers to Large Medical Group Practice in the United States.” Archives of Internal Medicine 163 (16): 1958–64. doi:10.1001/archinte.163.16.1958. [DOI] [PubMed] [Google Scholar]
- Casalino, L. P. , Gillies R. R., Shortell S. M., Schmittdiel J. A., Bodenheimer T., Robinson J. C., Rundall T., Oswald N., Schauffler H., and Wang M. C.. 2003b. “External Incentives, Information Technology, and Organized Processes to Improve Health Care Quality for Patients with Chronic Diseases.” Journal of the American Medical Association 289 (4): 434–41. [DOI] [PubMed] [Google Scholar]
- Caslino, L. P. , Pesko M. F., Ryan A. M., Mendelsohn J. L., Copeland K. R., Ramsay P. P., Sun X., Rittenhouse D. R., and Shortell S. M.. 2014. “Small Primary Care Physician Practices Have Low Rates of Preventable Hospital Admissions.” Health Affairs 33 (9): 1680–8. doi:10.1377/hlthaff.2014.0434. [DOI] [PubMed] [Google Scholar]
- Christianson, J. B. , Carlin C., and Warrick L.. 2014. “The Dynamics of Community Health Care Consolidation: Acquisition of Physician Practices.” Milbank Quarterly 92 (3): 542–67. doi:10.1111/1468‐0009.12077. [DOI] [PMC free article] [PubMed] [Google Scholar]
- Christianson, J. B. , Volmar K., Alexander J., and Scanlon D. P.. 2010. “A Report Card on Provider Report Cards: Current Status of the Health Care Transparency Movement.” Journal of General Internal Medicine 25 (11): 1235–41. doi:10.1007/s11606‐010‐1438‐2. [DOI] [PMC free article] [PubMed] [Google Scholar]
- Coughlin, S. , and Gerhardt W.. 2013. Physician‐Hospital Employment: This Time It's Different. Washington, DC: Deloitte Center for Health Solutions. [Google Scholar]
- Crosson, F. J. 2005. “The Delivery System Matters.” Health Affairs 24 (6): 1543–8. doi:10.1377/hlthaff.24.6.1543. [DOI] [PubMed] [Google Scholar]
- Enthoven, A. C. 2009. “Integrated Delivery Systems: The Cure for Fragmentation.” American Journal of Managed Care 15 (10 Suppl): S284–90. [PubMed] [Google Scholar]
- Federal Trade Commission v. St Luke's Health System, LTD . 2014. Case No. 1:13 – CV‐00116‐BLW. United States District Court [accessed July 7, 2015]. Available at https://www.ftc.gov/enforcement/cases-proceedings/121-0069/st-lukes-health-system-ltd-saltzer-medical-group-pa
- Gaynor, M. , Ho K., and Town R.. 2014. The Industrial Organization of Health Care Markets. NBER Working Paper #19800. Cambridge, MA. [Google Scholar]
- Gaynor, M. , and Town R. J.. 2012. “Competition in Health Care Markets” In Handbook of Health Economics, Volume 2, edited by Pauly M. V., McGuire T. G., and Barros P. P., pp. 499–647. Cambridge, MA: Elsevier. [Google Scholar]
- Greenspun, H. , Coughlin S., and Stanley E.. 2013. Physician Adoption of Health Information Technology: Implications for Medical Practice Leaders and Business Partners. Washington, DC: Deloitte Center for Health Solutions. [Google Scholar]
- Healthcare Financial Management Association . 2014. Acquisition and Affiliation Strategies. Westchester, IL: Healthcare Financial Management Association. [Google Scholar]
- Healthcare Payment and Pricing Reform . 2008. Minn. Stat. §§ 62U‐02 1‐5. [Google Scholar]
- Kirchhoff, S. M. 2013. Physician Practices: Background, Organization, and Market Consolidation. Washington, DC: Congressional Research Service. [Google Scholar]
- Kocher, R. , and Sahni N. R.. 2011. “Hospitals' Race to Employ Physicians‐The Logic Behind A Money‐Losing Propostion.” New England Journal of Medicine 364 (19): 1790–3. [DOI] [PubMed] [Google Scholar]
- Kralewski, J. , Dowd B., Savage M., and Tong J.. 2014. “Do Integrated Health Care Systems Provide Lower‐Cost, High‐Quality Care?” Physician Executive Journal 2: 14–9. [PubMed] [Google Scholar]
- Leibert, M. 2011. “Performance of Integrated Delivery Systems: Quality, Service and Cost Implications.” Leadership in Health Services 24 (3): 196–206. doi:10.1108/17511871111151108. [Google Scholar]
- McCullough, J. S. , and Snir E. M.. 2010. “Monitoring Technology and Firm Boundaries: Physician‐Hospital Integration and Technology Utilization.” Journal of Health Economics 29 (3): 457–67. [DOI] [PubMed] [Google Scholar]
- McCullough, J. S. , Crespin D. J., Abraham J. M., Christianson J. B., and Finch M. D.. 2015. “Public Reporting and the Evolution of Diabetes Quality.” International Journal of Health Economics and Management 15 (1): 127–38. doi:10.1007/s10754‐015‐9167‐z. [DOI] [PubMed] [Google Scholar]
- Mehrotra, A. , Epstein A. M., and Rosenthal M. B.. 2006. “Do Integrated Medical Groups Provide Higher‐Quality Medical Care Than Individual Practices Associations?” Annals of Internal Medicine 145 (11): 826–33. [DOI] [PubMed] [Google Scholar]
- Minnesota Community Measurement . 2012. 2012 Health Care Quality Report. Minneapolis, MN: Minnesota Community Measurement. [Google Scholar]
- Minnesota Community Measurement . 2014. “Reports and Data” [accessed August 3, 2014]. Available at http://mncm.org/reports-and-websites/reports-and-data/
- Moody, G. , and Silow‐Carroll S.. 2009. Aiming Higher for Health System Performance: A Profile of Seven States That Perform Well on the Commonwealth Fund's 2009 State Scorecard: Minnesota. New York: The Commonwealth Fund. [Google Scholar]
- Rittenhouse, D. R. , Grumbach K., O'Neil E. H., Dower C., and Bindman A.. 2004. “Physician Organization and Care Management in California: From Cottage to Kaiser.” Health Affairs 23 (6): 51–62. doi:10.1377/hlthaff.23.6.51. [DOI] [PubMed] [Google Scholar]
- Solberg, L. I. , Asche S. E., Shortell S. M., Gillies R. R., Taylor N., Pawlson L. G., Scholle S. H., and Young M. R.. 2009. “Is Integration in Large Medical Groups Associated with Quality?” American Journal of Managed Care 15 (6): e34–41. [PubMed] [Google Scholar]
- Summer, L. 2010. Integration, Concentration, and Competition in the Provider Marketplace. Washington, DC: AcademyHealth. [Google Scholar]
- Weeks, W. B. , Gottlieb D. J., Nyweide D. E., Sutherland J. M., Bynum J., Casalino L. P., Gillies R. R., Shortell S. M., and Fisher E. S.. 2010. “Higher Health Care Quality and Bigger Savings Found at Large Multispecialty Medical Groups.” Health Affairs 29 (5): 991–7. doi:10.1377/hlthaff.2009.0388. [DOI] [PubMed] [Google Scholar]
Associated Data
This section collects any data citations, data availability statements, or supplementary materials included in this article.
Supplementary Materials
Appendix SA1: Author Matrix.
Table S1. Clinics Performance on Diabetes Care Controlling for Electronic Medical Records versus Paper Records Data Submission, Estimated Using Fixed Effects Regression.
Table S2. Clinic Performance on Diabetes Care Controlling for Being Acquired in Following Year, Estimated Using Fixed Effects Regression.
Figure S1. Physiological Diabetes Care Performance for Clinics Reporting to Minnesota Community Measurement.
Figure S2. Behavioral Diabetes Care Performance for Clinics Reporting to Minnesota Community Measurement.
Figure S3. Blood Pressure Performance on Diabetes Care for Clinics Reporting to Minnesota Community Measurement.
Figure S4. Hemoglobin A1c Performance on Diabetes Care for Clinics Reporting to Minnesota Community Measurement.
Figure S5. LDL Cholesterol Performance on Diabetes Care for Clinics Reporting to Minnesota Community Measurement.
Figure S6. Daily Aspirin Performance on Diabetes Care for Clinics Reporting to Minnesota Community Measurement.
Figure S7. Tobacco‐Free Status Performance for Clinics Reporting to Minnesota Community Measurement.
Figure S8. Distribution of Overall Diabetes Care Performance for Clinics in Health Systems with More Than Fifteen Clinics, 2007 and 2013 Comparison.