

Abstract
Background
T1 mapping and extracellular volume (ECV) have the potential to guide patient care and serve as surrogate end-points in clinical trials, but measurements differ between cardiovascular magnetic resonance (CMR) scanners and pulse sequences. To help deliver T1 mapping to global clinical care, we developed a phantom-based quality assurance (QA) system for verification of measurement stability over time at individual sites, with further aims of generalization of results across sites, vendor systems, software versions and imaging sequences. We thus created T1MES: The T1 Mapping and ECV Standardization Program.
Methods
A design collaboration consisting of a specialist MRI small-medium enterprise, clinicians, physicists and national metrology institutes was formed. A phantom was designed covering clinically relevant ranges of T1 and T2 in blood and myocardium, pre and post-contrast, for 1.5 T and 3 T. Reproducible mass manufacture was established. The device received regulatory clearance by the Food and Drug Administration (FDA) and Conformité Européene (CE) marking.
Results
The T1MES phantom is an agarose gel-based phantom using nickel chloride as the paramagnetic relaxation modifier. It was reproducibly specified and mass-produced with a rigorously repeatable process. Each phantom contains nine differently-doped agarose gel tubes embedded in a gel/beads matrix. Phantoms were free of air bubbles and susceptibility artifacts at both field strengths and T1 maps were free from off-resonance artifacts. The incorporation of high-density polyethylene beads in the main gel fill was effective at flattening the B1 field. T1 and T2 values measured in T1MES showed coefficients of variation of 1 % or less between repeat scans indicating good short-term reproducibility. Temperature dependency experiments confirmed that over the range 15–30 °C the short-T1 tubes were more stable with temperature than the long-T1 tubes. A batch of 69 phantoms was mass-produced with random sampling of ten of these showing coefficients of variations for T1 of 0.64 ± 0.45 % and 0.49 ± 0.34 % at 1.5 T and 3 T respectively.
Conclusion
The T1MES program has developed a T1 mapping phantom to CE/FDA manufacturing standards. An initial 69 phantoms with a multi-vendor user manual are now being scanned fortnightly in centers worldwide. Future results will explore T1 mapping sequences, platform performance, stability and the potential for standardization.
Electronic supplementary material
The online version of this article (doi:10.1186/s12968-016-0280-z) contains supplementary material, which is available to authorized users.
Keywords: T1 mapping, Standardization, Phantom
Background
Myocardial tissue characterisation by T1 mapping and estimation of extracellular volume (ECV) by cardiovascular magnetic resonance (CMR) is playing an increasingly important role in the diagnosis and management of patients and clinical trials [1]. T1 mapping is available as three broad classes of sequences, on multiple platforms, at two field strengths. Factors influencing T1 mapping stability and inter-sequence comparisons are well understood [1–4] but little is known about T1 mapping delivery at a larger scale over many sites and there is no global quality assurance (QA) system.
The goal of the T1MES program (T1 Mapping and Extracellular volume Standardisation) was to construct an optimised phantom for QA of myocardial T1 mapping, covering a relevant range of T1 values with suitable T2 values for the tissues modelled. The proposed QA consists of regular scans using fixed T1-mapping protocols identical to whatever fixed protocols are used in vivo at each participating site. We therefore aimed for a phantom design that would have stable T1 values for as long as possible. We also aimed for a phantom design avoiding temperature sensitivity of its T1 values as explained later in Methods.
Such a QA system would form part of a system for optimal mapping precision and accuracy [2] within the increasingly known fundamental limitations of the T1 mapping methods [5, 6].
The T1 Mapping and ECV Standardization (T1MES) program therefore aimed to:
Create a partnership of physicists, clinicians and national metrology institutes
Design phantom systems for 1.5 T and 3 T for any manufacturer/sequence reflecting T1 values in myocardium and blood, pre- and post-Gadolinium-based contrast agents (GBCA)
Reproducibly specify and mass produce phantoms with a rigorously repeatable process and to regulatory standards
Distribute them to global CMR sites with detailed instructions for fortnightly scanning
Publish full details of the formulation to encourage additional applications
Measure confounders (e.g. temperature dependency)
Analyse scans over 1 year to study the stability of T1 measurements over time at each scanner, including a temperature correction model for T1
Curate phantom data long-term in an open access repository available for reuse/analysis
Analyse the inter-site differences in T1 values and explore the deliverability of a technique-independent ‘T1/ECV Standard’ through local calibration
To date we have achieved steps 1 to 6 of this process, namely the development, testing, certification, QA protocol and preliminary results of T1MES. This paper summarises these first 6 milestones.
Methods
Definitions
The term “phantom” refers to the complete test object (Fig. 1).
Fig. 1.

Internal and external phantom structure. Internal (3 T, looking at the front—a) and external (1.5 T, front and back—b) T1MES phantom structure. The nine tubes are supported on a translucent resin base composed of unsaturated polyester/styrene. A careful hardening and curing process ensured a smooth surface finish for the resin base. The front of the phantom (b left) contains an isocenter cross label to aid positioning as well as an LCD thermometer. Careful positioning of the bottle on the scanner table (c) with the cap towards its head end is needed to ensure it is scanned at isocenter each time. HDPE = high-density polyethylene; LCD = liquid crystal display; NiCl2 = Nickel Chloride; PE = polyethylene; PVC = poly vinyl chloride
The term “tube” refers to each of the small bottles embedded within the phantom.
The “gel matrix” is the gel and bead mixture filling the phantom that surrounds all of the tubes.
Collaboration process
A design collaboration for developing and testing the T1MES phantom and its prototypes was established, consisting of clinicians, physicists, national metrology institutes (the US National Institute of Standards and Technology [NIST] and the German Physikalisch-Technische Bundesanstalt [PTB]) and a small-medium enterprise familiar with phantom production (Resonance Health [RH], Perth, Australia). Funding was secured including a grant from the European Association of Cardiovascular Imaging. Time and expertise was provided for free by the partnership. To engage a global community with constrained funding, the phantoms were gifted (first come, first served) to centers with the proviso that they: a) scan them fortnightly for 1 year and upload the results; b) engage with the partnership to explore any unexpected results; c) do not do anything that could potentially compromise (a) or (b) (e.g. deconstruct the phantom object); and d) give proper reference to the T1MES project if they use the phantoms for other purposes.
Phantom design
The design process involved several prototype iterations (known as models A—D before the final mass-production of E-models). Some aspects such as artefacts from the prototype A through D-models that guided the final E-model design are described in Methods and in Fig. 2 with a timeline in Fig. 3. At the very least, the initial A-D models were needed to achieve reasonable T1 and T2 values without deleterious imaging artefacts, especially as imaging was conducted remotely from the manufacturer.
Fig. 2.

Artifact examples in earlier prototypes (a-g) and final T1MES phantom (i, j). Four earlier prototypes (models A—D) were rejected before the final model. a Coronal image of the earlier A-model (aqueous fill) showing bright artifacts around the tubes resulting from bSSFP going off-resonance that would have led to variations in T1 values by MOLLI and similar sequences. b Transverse image of A-model showing the characteristic ‘cat’s head’ artifact of air-bubbles trapped in the paramagnetically doped aqueous tubes. Significant off-resonance artifact is also noticeable in the central tubes. c Another coronal image through A-model but with larger gaps between tubes showing the combined effect of motion artifact (due to the aqueous fill) and B 0 distortion. d Transverse image of C-model attempting to use narrower tubes to pack 12 instead of 9, but significant Gibbs artifact can be seen in each tube. e Transverse image of C-model showing three small dark circular artifacts (12, 3 and 9 o’clock positions) caused by glue used to stabilize the tube arrangement. We subsequently switched to silicone-based glues that were less likely to trap air bubbles and were artifact-free. f Severe stabilisation artifact appearing as a thick dark band around the border of a D-model—here the phantom was scanned immediately after being received from the courier company and the bottle was still very cold from the transportation. Additionally susceptibility artifacts can be seen as thin linear bands spoiling some of the tubes (9 and 3 o’clock). g Significant image intensity inhomogeneity during a D-model test session on a GE scanner caused by accidental omission of the folded blanket, intended to separate the phantom bottle from the anterior chest coil. h Curved tube artifact and dark rings arising from ink printed onto the sides of digestive tubes (images courtesy of K. E. Keenan and NIST). i Coronal bSSFP localiser image and (j) typical T1 map of a final 3 T T1MES phantom obtained by MOLLI using a bSSFP readout on a Siemens 3 T Skyra scanner. bSSFP = balanced steady-state free precession; MOLLI = modified Look-Locker inversion recovery. Other abbreviation as in Fig. 1
Fig. 3.
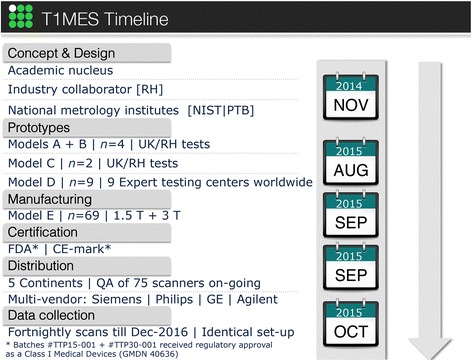
Prototype models and T1MES project timeline. CE = Conformité Européene; FDA = Food and Drug Administration; GE = General Electric; NIST = US National Institute of Standards and Technology; PTB = German Physikalisch-Technische Bundesanstalt; QA = quality assurance; RH = Resonance Health
The range of T1 and T2 values in the phantom aims to cover typical native and post-GBCA values in both myocardium and blood. The especially wide range of T1 post-GBCA (due to variable practice regarding dose, wash-out delays etc. and of course also disease) requires several tubes to cover it. From a review of published values and our own experience, we selected the values listed. Whatever rationale is adopted, with a limited number of tubes there will inevitably be gaps.
T1 is generally longer at 3 T compared to 1.5 T. Initially we aimed to design a single phantom for both 1.5 T and 3 T, containing a sufficient number of tubes to cover the needed T1 ranges in blood and myocardium, with suitable T2 values, pre and post-GBCA at both field strengths. However, the frequency dispersion (i.e. B0 field dependence) of relaxation times in the phantoms differed strongly from that of myocardium and blood, particularly for the long pre-GBCA tubes, requiring a total of 13 different tubes for 1.5 T and 3 T. Fitting 13 tubes into a single phantom would either have made the object ‘large’ (in relation to the B1 distortion at 3 T discussed below) or would have required the use of smaller calibre tubes. The following considerations justify our construction therefore of ‘field-specific’ phantoms:
Tubes had to be a minimum of 20 mm diameter so regions of interest (arbitrarily set to13 mm) would exclude in-plane imaging artifacts at the boundaries between tubes related to the use of clinical T1mapping protocols with coarse image resolution, mostly based on single-shot imaging (e.g. Gibbs artifact at the edge of tubes [Fig. 2d] or the potential impact of filtering against it applied differently by various protocol parameters). Altering protocols to optimise phantom scanning would be inconsistent with the aim of the project. The true resolution achieved is further convoluted by the use of asymmetric frequency-encoded readouts for faster repetition time (TR) in balanced steady-state free precession (bSSFP) imaging or partial-phase-encode sampling for shorter total shot duration, and to some extent also by signal variation during the shot.
Embedding tubes into a gel-filled phantom is important for three reasons: 1) to permit sufficient signal for scanner calibrations; 2) to minimise B0 and B1 field distortions local to each tube; and 3) for greater thermal stability. However, embedding all the 13 tubes (to cover 1.5 T and 3 T values) into a single phantom (whether water or water-based gel-filled) will have increased its overall dimensions making it harder to make (our tests and others [7, 8] show that B1 homogeneity across large ROIs could not be achieved especially at 3 T). Alternative oil-based phantoms have a smaller dielectric permittivity, useful for weaker radiofrequency (RF) displacement current distortion of B1, but the chemical shift of the matrix fill would require embedded tubes also to use oil-based chemistry (as in diffusion phantoms). Alkanes or similar [9] could not deliver the required range of T1 and T2 (written as T1|T2) and a predominately single-peak nuclear magnetic resonance (NMR) spectrum, with the required temperature stability. By using separate water-based gel-filled phantoms for 1.5 T and 3 T with the known high permittivity of water, at a size large enough to fit the needed tubes there was still significant B1 distortion (range of different flip angles achieved for a prescribed protocol nominal flip-angle) but we were able to counteract it using a method described later.
This project aims to provide quality assurance for clinically used T1 protocols without adapting to the phantom (e.g. no switching to spoiled-gradient echo, or using shorter-TR, no alterations of resolution or field of view etc.; see Additional file 1). Clinical T1 mapping protocols are sensitive to off-resonance effects for various well-known reasons. Therefore, B0distortion near any of the tubes needed to be minimised (tests showed how tube alignment with the B0 direction was best—this data not shown).
Phantom materials
All materials proposed for phantoms to date suffer different deficiencies. We adopted the most suitable formulation known, which are paramagnetically doped agarose or carrageenan gels [10, 11]. Some of the main design aspects are listed in Table 1.
Table 1.
Design factors when developing a T1 mapping phantom
| Design factor | Explanation | Our proposed solution |
|---|---|---|
| Bottle magnetostatics and B 0 distortion | The ideal phantom would be uniform and ellipsoidal to avoid susceptibility-induced magnetostatic field perturbation. Such a phantom would permit sphere of Lorentz uniformity but this is not easily mass produced. Many phantoms are cylindrical with the long axis along the static field, B 0 but there is usually off-resonance at the z-ends of such objects [7]. | An outer phantom body with a smooth surface and soft rounded-edges, placed inside B 0 still distorts some of the imposed magnetic field lines at its z-ends so we prescribed scanning halfway along the length of the bottle. |
| Long term gel stability and risk of moulding | Phantoms with long-term stability could assure the stability of methods applied to patients against scanner alternations and across multiple centers. | Moulding was prevented by aseptic manufacturing, the toxicity of Ni2+ ions, and the absence of nutrients in the type of agarose used. Tap water might contain microbial contamination and metal ions so high purity water was used. The main risk is from contraction of gel on loss of water leading to gaps and water condensation but NiCl2-doped agarose gel phantoms can be stable over a 1-year period [17]. |
| Seal, leakages, air trapping for aqueous fill | Air pockets in the agarose gel phantom will give rise to susceptibility artifacts on account of the large mismatch in static magnetic susceptibility between air and surrounding gel producing a local distortion in magnetic field strength. | The main phantom was sealed by a black polypropylene screw cap fitted with a polyethylene foam insert. Each internal digestive tube was sealed by a tight screw cap. Gel preparation with warm, degassed water reduced air bubble formation. Note the tube “base-upward” setting procedure and subsequent “top-up” of the contracted gel in each tube after setting, described in the text. |
| Adjustments of B 0 and reference frequency | Adjustments of B 0 and scanner reference frequency over the phantom have the ability to impact T1estimates. | We specified a constant shim volume for each scan. This is manufacturer-dependent—see the T1MES manual [23]. Consistency between repeat scans is the main point. |
| Gel diamagnetism | In the T1MES model system, because the impact of the paramagnetic ions is so small, we can conceptually treat the main phantom box as if it had no tubes, as if it were just filled with uniform gel throughout | The T1MES system has partly paramagnetic and partly diamagnetic constituents, but the impact of the paramagnetic Ni2+ ions is small, around 10 % (because concentrations are small) so the overall interaction is diamagnetic, considering the ~9 parts per million diamagnetism of most tissues relative to air from Lenz electronic diamagnetism. |
| Gibbs artifact ringing and other inplane effects | Truncating artifacts appear as lines of alternating brightness and darkness in the read-out and phase encode direction. Some effects also from asymmetric readout and ky coverage. | Large diameter digestive tubes to house the 9 agarose doped solutions, so that central regions of each tube are sufficiently distant (a number of pixels away) from regions impacted by artifacts from abrupt signal intensity transitions at the tube edges. |
| 1.4 T, 1.5 T, 3 T performance | Many paramagnetic relaxation modifiers, including Mn2+ and Cu2+, exhibit significant frequency dependence. | We used Ni2+[13]. |
| T1|T2 ranges: blood/myocardium, pre/post-GBCA | The T1|T2 values were carefully modelled for native and post-gadolinium based contrast agent, blood and myocardium. | 5 common tubes, 4 tubes specific to 1.5 T, 4 tubes specific to 3 T. There was no macromolecular addition (no magnetisation transfer modelling) [22]. |
| Tube arrangement | The phantom corners are more prone to inhomogeneities of the B 0 and B 1 magnetic fields. | Longer T1 tubes were placed nearer the middle of the phantom layout and avoided the corners. |
Cu 2+ copper ions, Mn 2+ manganese ions, Ni 2+ nickel ions, NiCl 2 nickel chloride
Agarose or similar gel phantoms are widely used in MR research but less often in commercial phantoms, probably because of long-term stability issues discussed later. Gels permit independent variation of T1|T2 and they avoid fluid movement within image slice during long inversion recovery (IR) times that could potentially introduce uncertainty in the T1* to T1 conversion [12]. A more concentrated gelling agent mainly shortens T2; a higher paramagnetic ion concentration mainly shortens T1 [11, 13]—the two effects are not independent but can be modelled [14] enabling design of mixtures with any required T1|T2 combination. We did not include sodium chloride (NaCl) (see B1 uniformity section below). Gel choices include carrageenan, gelatin, agar-agar, polyvinyl alcohol, silicone, polyacrylamide. Some have undesirable NMR spectral properties. The paramagnetic ion choice [15] includes copper, cobalt, iron, manganese (Mn2+), gadolinium and nickel (Ni2+). Due to the individual T1|T2 relaxivities of the various ions, no currently known ionic mixture in water can deliver the native myocardial T1|T2 combination (which requires a relatively high T1 with a short T2). Ni2+ was our first choice as the paramagnetic relaxation modifier at it is less temperature and frequency dependent than other ions [13, 16] and because nickel chloride (NiCl2) agarose gel phantoms have been shown to be stable over a 1 year period [17].
Characterization of T1 and T2 dependence on agarose and nickel
To achieve the required T1|T2 tube values we characterised the relation between T1|T2, agarose and NiCl2 concentrations. We made a wide variety of test mixtures as follows: we dissolved at 95 °C for 2.5 h, 135 different concentrations of NiCl2, water and agarose, each in a separate 50 ml digestive tube. Using a preheated serological pipette, samples were transferred into preheated NMR tubes (to prevent instant setting of the gel while flowing down the tube), allowed to set and analysed at a measuring temperature of 22 °C with a 1.4 T Bruker Minispec mq60 (60 MHz) relaxometer (Perth, Western Australia). Exponential fitting was done and T1 and T2 recorded. Based on these results we calibrated the equations [14] modelling the relationship between ingredients and T1|T2 relaxation times (omitting saline). The model assumes a linear relation between the ingredients and the relaxation rates (R1,R2) = (1/T1,1/T2). Using this the ingredients for any required T1|T2 tube could be calculated. The model was tested for the set of 13 unique T1|T2 combinations desired for the 1.5 T and 3 T phantoms. Some iterations (models A through D, Fig. 3) were required to derive from the model (based on a non-imaging 60 MHz relaxometer) tube values applicable to clinical 1.5 T and 3 T MR systems described later.
B0 uniformity
The approximately cuboid, outer body of the T1MES NiCl2-agarose gel phantom (Fig. 1a) consisted of a short, hollow, wide necked and leakproof brown-transparent poly vinyl chloride bottle with a melting temperature of 140 °C (Series #310-73353, Kautex Textron GmbH & Co. KG, Bonn, Germany). The adopted shape is more ellipsoidal than many of the shapes rejected in our tests, consistent with basic magnetostatics (sphere of Lorenz) at 1.5 T and 3 T. The B0 distortion by the phantom arises from electronic diamagnetism and is not significantly affected by the paramagnetic ion concentrations used. Adding sufficient paramagnetic material to cancel the diamagnetism and flatten B0 would excessively shorten the relaxation times.
The final body shape gave sufficient B0 uniformity for T1 mapping over only a small region approximately halfway along its length when aligned coaxially with B0. Regions towards the cap and base of this object were subject to off-resonance errors [18]. The tubes inside the phantom were therefore not fixed directly down to the base of the main bottle. A 20 mm layer of non-coloured (non-saturated) polystyrene resin (Diggers Casting and Embedding Resin 500GM, #FIE00506-9311052000759, Recochem Inc. Perth, Western Australia) was first set hard in the base of the main bottle, and the tubes were adhered to the top of this layer, so that the tubes occupied the middle of the phantom in the cap-to-base direction, where the B0 field is optimally uniform. B0 uniformity was mapped to evaluate this cause of distorted T1 estimates, using a multi-echo gradient echo sequence based on the phase difference between known echo times [19]. A frequency range of +/−50 Hz across the phantom was regarded as acceptable based on published T1-mapping sensitivity to off-resonance [18].
B1 uniformity
B1 uniformity in large water-based phantoms [20, 21] is complex but fundamentally the electric dipole moment of the water molecule rotates in the oscillating electric field associated with the RF B1field, giving rise to displacement current. Sucrose or other large nonionic molecules can reduce water permittivity, by in effect diluting the problematic water molecules. However, the spectral contribution of such molecules at the high concentrations required is a severe complication. An alternative approach often described in phantom literature is the addition of sodium chloride or similar simple ionic solutes (n.b. not to be confused with high permittivity of powdered titanates, suspended in deuterated water). This tackles the problem from a different direction as it leaves the permittivity unchanged but increases the conductivity (σ) instead, to reduce ωε/σ, i.e. the ratio of displacement current to conduction current. Adding NaCl to the T1MES phantom acted on B1 distortion at a shallower depth in the T1MES phantom and did not cancel the overall B1 curvature at any NaCl concentration tested.
In this work, deriving from the sucrose approach, we hypothesised that mixing plastic beads into the matrix gel might also effectively dilute the dielectric permittivity of water and lead to improved B1 uniformity without directly altering the outer matrix gel T1|T2 values (see Table 2, 846 ms |141 ms). Our choice of outer matrix gel T1|T2 values was informed by tests looking at different outer matrix gel T1|T2 combinations (data not shown) and their impact on bSSFP-stabilisation artifacts at both field strengths. For the beads, two different kinds of plastic bead were evaluated: highly monosized microbeads composed of crosslinked poly methyl-methacrylate (PMMA) polymer (6 μm, Spheromers, Microbeads AS, Norway) and high-density polyethylene (HDPE) beads of oblate spheroidal form (3 mm polar axis by 4.2 mm equatorial diameter) consisting of smooth, semi-translucent, colourless HDPE with a melt index >60 °C (HDPE Marlex HHM 5502 BN, Chevron Phillips Chemical Company LP, Texas, USA). It is important to control the supply of HDPE pellets to ensure that they have not been reground, reblended or otherwise modified. The two different plastic bead versions of T1MES matrix gel were compared to the use of sucrose or sodium chloride (formulations tested: (1) added to 1050 ml of Ni2+-doped gelling solution, separately and in combination = 800 g sucrose, 50 g NaCl; (2) added to 1000 ml of distilled water containing NiCl2 and MnCl2 with T1 ~ 600 ms, T2 ~ 170 ms: 5 g NaCl; (3) added to 2534 ml of distilled water: 1 g, 4 g, 6.5 g, 11.5 g, 14 g, 19 g, 21.5 g NaCl). B1 homogeneity was evaluated by flip angle (FA) maps derived by the double angle method using FA 60° and 120° (θ1, 2*θ1) by long TR (8 s) scanning using a 4 ms duration sinc (−3π to +3π) slice excitation width to minimise error due to FA variation through the slice.
Table 2.
List of T1|T2 values for the target 13 tubes and outer matrix gel and the required agarose/NiCl2 concentrations for the final phantom
| Description target (Tube ID) | T1 (ms at 1.4 Ta) | T2 (ms at 1.4 Ta) | Agarose (%) | NiCl2 (mM) |
|---|---|---|---|---|
| “Short” post-GBCA blood (A) | 256 | 172 | 0.244 | 5.547 |
| “Normal” native blood 1.5 T (B) | 1490 | 282 | 0.373 | 0.362 |
| “Long” post-GBCA blood (C) | 427 | 212 | 0.325 | 2.860 |
| “Short” native myocardium 1.5 T (D) | 818 | 54 | 2.214 | 1.231 |
| “Long” native myocardium 1.5 T (E) | 1384 | 57 | 2.279 | 0.461 |
| “Medium” native myocardium 1.5 T (F) | 1107 | 56 | 2.256 | 0.725 |
| “Short” post-GBCA myocardium (G) | 295 | 50 | 2.174 | 4.510 |
| “Long” post-GBCA myocardium (H) | 557 | 51 | 2.377 | 2.103 |
| “Medium” post-GBCA myocardium (I) | 429 | 50 | 2.306 | 2.942 |
| “Normal” native blood 3 T (J) | 1870 | 288 | 0.388 | 0.180 |
| “Short” native myocardium 3 T (K) | 1043 | 56 | 2.245 | 0.858 |
| “Long” native myocardium 3 T (L) | 1510 | 55 | 2.289 | 0.342 |
| “Medium” native myocardium 3 T (M) | 1279 | 56 | 2.273 | 0.531 |
| Outer matrix gel fill | 846 | 141 | 0.780 | 1.155 |
aBy Bruker minispec mq60 relaxometer 1.4 T (22 °C) at Resonance Health laboratory, Australia
GBCA gadolinium-based contrast agents, ID identity number
Temperature dependence of T1 and T2
Temperature dependency experiments on T1|T2 values [15] were carried out at various stages:
Test 1: Performed at the PTB laboratory in June 2015 on a 3 T prototype-D (whole phantom with 9 tubes) across 17 temperatures between 14.9 °C and 32.0 °C for T1 and across 6 temperatures between 15.6 °C and 31.1 °C for T2. Each measurement was repeated twice (with a 2 day gap) and made using a 3 T Siemens Magnetom Verio system (VB17) and a 12-channel head coil.
Test 2: Performed at the NIST laboratory in November 2015 on six loose tubes from the final production run of E-model phantoms. T1|T2 were measured at 9.9, 17.1, 20.1, 23.1 and 30.1 °C on an Agilent 1.5 T small bore scanner in a temperature-controlled environment. Temperatures were measured using a fiber optic probe. T1 was measured by inversion-recovery spin echo (IRSE) (TR [s] = 10, inversion time [TI, ms] = 50, 75, 100, 125, 150, 250, 500, 1000, 1500, 2000, 3000) and T2 by SE (TR [s] = 10, TE [echo time, ms] = 15, 30, 60, 120, 240, 480, 960). Note that some of the data acquired under short-term reproducibility was obtained in support of temperature Test 2.
Short-term reproducibility
Short-term reproducibility (single site, single manufacturer, single sequence) aided temperature sensitivity work and assessed baseline variability between fortnightly scans with all other parameters constant (not least, temperature). For the final T1MES phantom (E-model) two short-term reproducibility experiments were performed:
Test 1: Six loose tubes from the final production run of E-model phantoms were tested for short-term reproducibility of T1|T2 values at the NIST laboratory in November 2015, at 20.1 °C on an Agilent 1.5 T small bore scanner. T1 was measured by IRSE (TR [s] = 10, TE [ms] = 14.75, TI [ms] = 50, 75, 100, 125, 150, 250, 500, 1000, 1500, 2000, 3000) and T2 by SE (TR [s] =10, TE [ms] =14.75, 20, 40, 80, 160).
Test 2: One of the final E-model phantoms for 3 T was tested for short-term repeatability of T1|T2 values using a Siemens 3 T Skyra at Royal Brompton Hospital in November 2015. This test was performed by removing and repositioning the receiver coil, phantom and its supports on each of ten runs, incurring full readjustment of all scanner setup procedures before each run. The acquired data was ten runs, each containing two repeated T1 maps, performed at 20.3 ± 0.5 °C. An extension of this work showed that the temperature increase of the T1MES phantom caused by specific absorption rate (SAR) deposition during imaging for repeated T1 maps was negligible.
Detailed construction of phantoms
Some of the detailed construction topics and constraints are listed in Table 1.
Each phantom (1.5 T or 3 T) contains nine tightly capped digestive tubes (#SC475, 50 ml from Environmental Express, South Carolina, USA) embedded in a gel matrix containing Nickel (II) Chloride hexahydrate (99.9999 % purity grade, Acros Organics, New Jersey USA, n.b. highly hygroscopic), high purity deionized water (Ibis Technology) and polysaccharide agarose powder with low endosmotic flow for electrophoresis (molar ratio ≤0.07, Acros Organics).
Mass production was from large batches of 14 solutions (13 tubes + outer matrix gel, Table 2) from which all the tubes and outer containers were filled accordingly. The mass production required some caution against deterioration of the agarose/NiCl2 mixtures if kept at high temperatures for periods exceeding around 8 h. The production of all copies of each tube therefore had to be completed within a single working day and as rapidly as possible. Deterioration was noted as a change of agarose gel colour from colourless to faint yellow. Microwave oven heating for initial agarose dissolution was followed by further magnetically-stirred heating and adjustments (based on relaxometry of samples from the mixture). Stirring was essential for uniform gel production into all copies of each tube. Each of the nine tubes is filled with differently doped agarose gels and contains minimal air gaps. Agarose gel contracts as it sets solid, contracting more in stronger agarose mixtures. By “topping up” more gel to the space left by contraction after the initial fill had set in each tube, the air gap can be minimised. Further, by cooling the tubes from the base (by standing them in approximately 2 cm depth of cold water), the gel solidified from the base upward so that contraction left a gap at the top of the tube for adding the “top-up”. This practical step was essential to avoid mid gel contraction gaps forming that is otherwise observed when the gel is allowed to set naturally earlier along the tube sidewalls. Such mid-gel gaps tend to cause a tear down the middle of the gel-filled tube making it unusable for ROI placement in images. The dissolving and solidifying temperatures of agarose gel show hysteresis, dissolving fully only near boiling-point, but requiring cooling to around 45 °C for solidification. The hysteresis assists practically, for example when pouring molten gel around the HDPE beads needed for the main matrix fill.
Of the 18 tubes used in the 1.5 T and 3 T phantoms, 4 are 1.5 T specific, 4 are 3 T specific (because tissue native T1 is longer at 3 T) and five tubes (the post-GBCA tubes) common to both field strengths (Fig. 4). Although some difference in post-GBCA T1 values does occur between 3 T vs. 1.5 T, this difference is absorbed within the very wide range of GBCA doses, post-GBCA times, GBCA types etc. in clinical use. Therefore 13 individual recipes were made. The 9 tubes in each field-specific phantom generate 9 different T1|T2 combinations (Fig. 5) modelled to cover the physiological range of native and post-GBCA, blood and myocardium in health and disease. There was no macromolecular addition with no attempt to model magnetisation transfer [22].
Fig. 4.
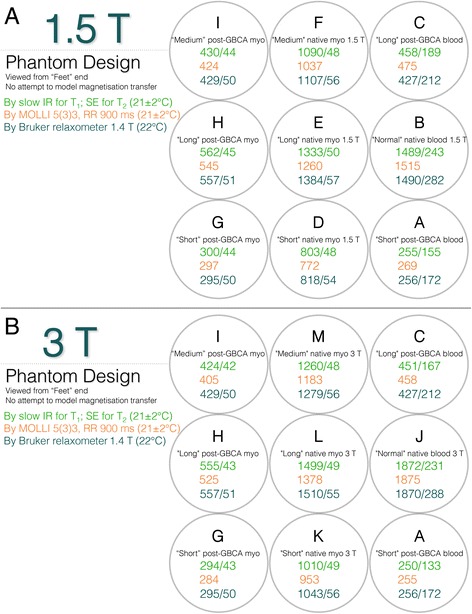
T1 and T2 values in T1MES. T1 and T2 values in the phantom mimic those of myocardium and blood pre and post-GBCA at 1.5 T (Panel a) and 3 T (Panel b). The 13 relaxometry scopes (refer to Table 2) are explained in the figure. Slow scan reference data for T1|T2 is displayed in green (for T1 by slow IRSE and for T2 by slow SE, RR interval 900 ms at 21 ± 2 °C), T1 values shown in orange represent the mean value per tube derived from tests on five of the E-model phantoms (using a 5(3)3 256-matrix RR = 900 ms at 21 ± 2 °C variant of MOLLI adapted for native T1 mapping; Siemens WIP 448B at 1.5 T and WIP 780B at 3 T), and in blue are T1|T2 values obtained by the manufacturer in Australia using a 1.4 T Bruker minispec relaxometer at 22 °C. Tube arrangement is such that long T1 tubes potentially suffering from more artifacts are kept towards the middle of the phantom and away from the corners. GBCA = gadolinium-based contrast agents; IRSE = inversion recovery spin echo; myo = myocardium; RR = inter-beat interval; SE = spin echo. All T1|T2 values are stated in ms. Other abbreviation as in Fig. 2
Fig. 5.
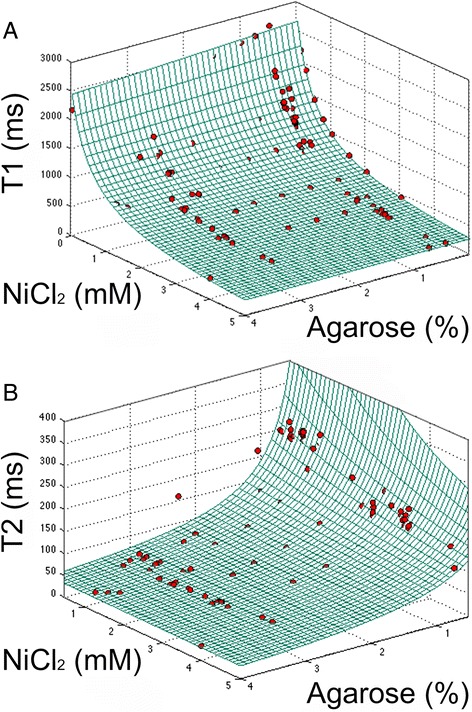
T1 and T2 relaxation times versus ingredients at 1.4 T: agarose and NiCl2. Grid represents results of the model. Red points represent single measurements. a Longitudinal relaxation time constant (T1), RMSE in R1 compared to the linear model was 4.8 × 10⁻⁵ /ms. b Spin–spin relaxation time (T2), RMSE in R2 compared to the linear model = 5.3 × 10⁻⁴ /ms. Since the x and y axes of both fits are comparable, the ingredient that contributes most can be identified. RMSE = root mean square error
After pouring in the resin base, leaving this to set, and adhering the 9 filled tubes on top of this base using ethylene vinyl acetate and polypropylene uncoloured mixture based hotmelt typically applied from a “hot glue gun”, we packed the compact HDPE pellets into the bottle and then poured in the agarose/NiCl2 mixture (typically at a temperature ~ 50–60 °C) taking care to avoid air pockets from forming in the matrix gel fill.
The T1MES phantom has a volume of 2 l, inner length of 187 mm and inner body cross section 122 mm by 122 mm. The labels show an isocenter cross mark, the correct orientation for positioning it under an anterior chest coil, and a serial number and date of manufacture. Also attached to the outside of the phantom is a liquid crystal display (LCD) thermometer of 1 °C resolution. Notably some pigments used on plastic tubes distort the magnetic field [12] (Fig. 2h), so all components were tested carefully, rigorously sourced and documented to avoid unexpected changes which could affect future production batches. Even with the efforts to optimise B0 and B1 uniformity, some T1|T2 combinations are more sensitive to off-resonance errors so these tubes were placed centrally in the phantom avoiding corner locations of greater B0/B1 error (explaining the otherwise somewhat counterintuitive ordering of tubes according to their T1 values).
Production of one phantom took on average 5 h (distributed over batch production not serial manufacture). As the phantom build was all by manual labour and not automated, it took 3 weeks and four full-time members, 340 h in total to produce the 69 phantoms in this batch.
Prototype and production batch testing and quality control
Reproducible manufacturing was established for all tubes. Three prototypes (models A to C) had unsatisfactory B0 and B1 uniformities before the satisfactory model-D design. Between June and August 2015, 10 D-model phantoms (five for each of 1.5 T and 3 T) were characterized at ten experienced CMR centers for artifacts and for initial verification of the tube T1|T2 values. In September 2015, the final batch of artifact-free (Fig. 2i, j) T1MES phantoms (E-models) were mass-manufactured and shipped to CMR centers worldwide.
All aspects of phantom production conducted at the RH laboratory were performed in accordance with their certified quality management system including the recruitment and training of staff and the quality control checks of final phantoms. Prior to the mass manufacturing, extensive experiments were done in order to setup the standard operation procedures and working instructions to ensure final phantom integrity. Quality control was ensured at three levels: operator level (e.g. careful choice of materials), engineering level (e.g. the responsible process engineer conducted in-production tests/measurements and inspections, such as checks for bubbles in the tubes and bottle seals, and based on the outcome of this analysis, initiated improvement activities) and management level (e.g. by facilitating training and identifying better measurement or production equipment that could be used for future batches). Operator level quality control evaluated phantoms in real-time during the production process through visual inspection to ensure production ran smoothly, predictably, and to the required standards (e.g. by ensuring a flat resin surface, correctly sealed tubes, tight bead packing of the outer matrix gel, etc.). Overall phantom integrity was also visually checked for any production defects prior to shipment (e.g. precise alignment of isocenter cross label correctly offset from the upper surface of the resin base, no distortion of the outer bottle due to excessively hot gel etc.).
Phantom calibration and validation has limitations as phantoms do not fully model tissue (see Discussion). Nonetheless, ‘ground truth’ values in phantoms were measured using slow scanning ‘gold standard’ sequences that have previously demonstrated accuracy in phantom work. Of the 69 final E-model phantoms, 10 (14.5 %; 5 at each of 1.5 T and 3 T) underwent ‘gold standard’ slow T1 measurements by IRSE (8 TIs from 25–3200 ms) and T2 measurements by slow SE (8 TEs from 10–640 ms) at a single center (Royal Brompton Hospital; Siemens, 1.5 T Aera and 3 T Skyra; Fig. 6). These slow T1|T2 measurements were only performed once and the results used as ‘ground truth’ for the subsequent measurements. In addition, all tubes were relaxometer-certified pre-assembly.
Fig. 6.

Reference T1|T2 values. Variation in the mean T1 (red dots) and T2 (blue dots) reference values and standard deviation (whiskers) of the nine tubes averaged for the ten final batch T1MES phantoms that underwent ‘gold standard’ slow T1 and T2 measurements by IRSE and SE respectively at 1.5 T (a) and 3 T (b). T1 values obtained by MOLLI (5(3)3 [256] (WIP# 448B at 1.5 T and WIP# 780B at 3 T) pre-GBCA sequence (green dots) are also shown. Abbreviations as in Figs. 2 and 4
Scanning protocol for T1MES
A fundamental aspect of T1MES was to invite each site to submit phantom data with whichever T1 mapping sequence they were using clinically. We did not pre-specify any aspect of the T1 mapping sequence to use, except careful replication of position and phantom setup without any alteration of the parameters used clinically and not to modify any other parameter of the chosen protocolled T1 mapping method during the period of supplying T1MES repeat scans—i.e. to stick to a fixed protocol (as specified in the JCMR Consensus Guidelines for T1/ECV). If changes were inevitable, for example due to scanner upgrades, a method of informing T1MES has been implemented and is described in the manual (Additional file 1). Instructions for adjustment and sizing of the shim volume did need to be vendor-specific and these are explained in the appendix section of the T1MES user manual circulated to all participants.
At all participating T1MES sites, the final phantom is currently scheduled for fortnightly scanning for 1 year using a fixed protocol for inter-scan test-retest analysis. Some centers are additionally scanning the phantom using the same sequence at the same position providing data necessary for short-term intra-scan test–retest analysis. Results from this longitudinal data collection are expected to be published in 2017. The T1MES user manual and QA protocol [23] stipulates that the T1MES phantom be kept in the MR magnet room (for stability and also so that its internal temperature will match that displayed by the surface LCD label) and imaged every 2 weeks for 1 year using consistent coil and phantom arrangement. The T1MES user manual emphasises that image parameters be kept unchanged for serial scans except for automatic adjustments of FA and reference frequency. The user manual specifies the range of acceptable positioning of the phantom in the scanner aligned with the main magnetic field. The phantom is scanned axially halfway along the length of the 9 internal tubes corresponding to halfway along the length of the main bottle, imaging only that slice, to avoid z-end B0 distortion. To ensure consistent adjustments of B0 and scanner reference frequency over the phantom at each repeat scan, the shim volume (also referred to as adjustments volume, adjust region, shim region, shim box) is identically sized and positioned on the phantom bottle for each scan (see Additional file 1). The scan protocol is kept identical for serial scans at each center. Centers were requested to use the same standard anterior chest coil each time.
The minimum fortnightly contribution to T1MES consists of conventional CMR scans: A) the initial localizers; B) at least any one T1 mapping sequence with simulated electrocardiogram set at 67 beats per minute (inter-beat [RR] interval 900 ms). The T1MES QA program generates three main types of multicenter data: 1) raw data pertaining to long reference scans for T1 (IRSE) and T2 (SE) that we reconstruct on receipt: 2) raw T1 mapping data from some specific centers without the ability to reconstruct their own maps locally, thus we reconstruct the maps on receipt; 3) reconstructed T1|T2 maps (majority of sites). T1|T2 values were taken as mean values from circular ROIs of fixed diameter, in each of the nine tubes in pixel-wise maps.
Within the network are sites using identical magnets, coils and protocols providing an opportunity for a wide range of inter-sequence and inter-site analyses (scheduled for 2017).
Statistics
Statistical analysis was performed in the R programming language (version 3.0.1, The R Foundation for Statistical Computing). Descriptive data are expressed as mean ± standard deviation except where otherwise stated. Distribution of data was assessed on histograms and using Shapiro-Wilk test. The coefficient of variation (CoV) between repeated scans was calculated as a measure of reproducibility. For defining the model that describes the relation between ingredients and relaxation rates (R1|R2), the fitted parameters were found by fitting a surface for both T1 and T2 using the MATLAB (The MathWorks Inc., Natick, MA, USA, R2012b) curvefitting tool and the linear least-squares approach. The analysis of incoming T1MES datasets is carried out using a MATLAB graphical user interface. From the data, mean T1 and T2 values were measured from each of the nine contrast tubes. Using the ROI measurement tool in MATLAB, mean signal intensity of the central 50 % area of each of the nine tubes was calculated.
Results
Model predictions of T1 and T2
Linear models for longitudinal and transverse relaxation rates R1|R2 in terms of the ingredients agarose and NiCl2 can be written following similar work previously published [14]:
where x = 1, 2, Cw,agarose and are the weight and molar concentration of agarose and Ni2+, respectively, and ax, bx and cx are found by surface fitting (Fig. 5):
From these relationships and replacing relaxation rate Rx by relaxation time Tx we calculated the required agarose % (by weight) and Ni2+ concentrations (equal to added molar concentration of NiCl2.6H2O as it is highly dissociated) for each of the 13 tube stock solutions as shown in Table 2.
The presented model was accurate within the root-mean-square errors (RMSE) in Fig. 5 caption over the range T1 = 300–1900 ms and T2 = 40–300 ms that cover the range of relaxation times expected in healthy and diseased myocardium pre- and post-GBCA.
Reference T1 and T2 values
Comparison of ‘gold standard’ T1 and T2 values (Fig. 6) between the ten E-model phantoms tested, confirmed reproducibility of manufacturing. Across the 9 tubes, CoV for T1 ranged from 0.17 to 1.25 % at 1.5 T and 0.08 to 1.0 % at 3 T, while T2 ranged from 0.74 to 2.12 % at 1.5 T and 0.40 to 1.72 % at 3 T.
B0 uniformity
Final phantoms were free of air bubbles and susceptibility artifacts at both field strengths. T1 maps were obtained in the specified mid-phantom slice at the specified scan setup, and were free from off-resonance artifacts (Fig. 2i, j). Provided the bottle was placed coaxial with z-axis, imaged as a transverse slice halfway along, and with the use of shimming as specified in the T1MES manual, B0 uniformity was delivered (Fig. 7a) to within ±30 Hz at 3 T.
Fig. 7.
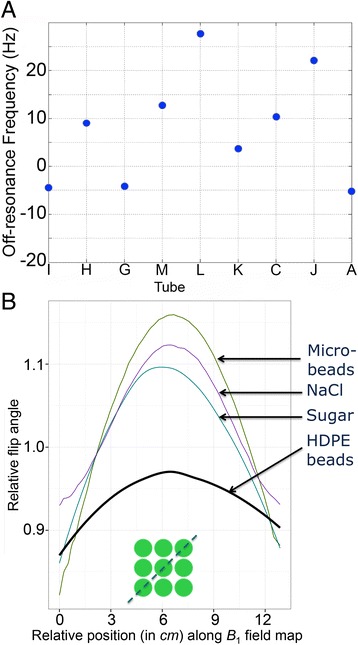
B 0 and B 1 field homogeneity. a B 0 field homogeneity across the nine phantom compartments as a measure of off-resonance in Hz at 3 T (single E-model phantom results). These are extremely small shifts in frequency (30 Hz = 0.25 ppm) at 3 T and should not be regarded as significantly different between the tubes. b Diagonal profile of the B 1 field (as per green discontinuous line in the inset) comparing relative flip angles on a Siemens 3 T system. Variance of B 1 was smallest across the 9 compartments with CoV 1.54 % for HDPE beads consisting of smooth, semi-translucent, colourless compact discs (as colouring in plastics has the potential to distort the B 0 magnetic field [12], see Fig. 2h) with a melt index >60 °C. We choose pellets that had not been regrinded, reblended or composite for this purpose. Highly monosized microbeads measured 6 μm and were composed of crosslinked PMMA polymer. Neither microbeads, sucrose nor NaCl were comparably effective in flattening the B 1 field. PMMA = poly methyl methacrylate. Other abbreviation as in Fig. 4
B1 uniformity
The compact HDPE beads (~1 kg of compact pellets per phantom bottle) adequately flattened the B1 field at 3 T (Fig. 7b), compared to the PMMA microbeads, sucrose and sodium chloride. The HDPE beads cause a speckle of dark regions in the gel matrix as they generate no MR signal that is normally detectable. The beads are expected to have similar diamagnetism to the gel so they have no impact on the B0 field.
Temperature dependency experiments
Collectively the results (Fig. 8) by slow SE scanning methods show that over the range 15–30 °C the short-T1 tubes are more stable with temperature than the long-T1 tubes where T1 increased more strongly with temperature. T2 values also change significantly with temperature (Fig. 8b), decreasing as temperature increases.
Fig. 8.
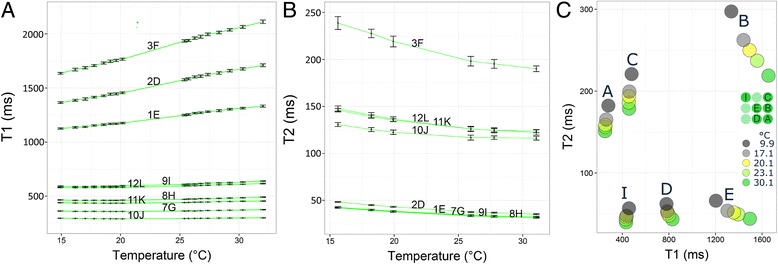
Temperature experiments in T1MES. Temperature dependency experiments (Test 1 in methods) performed on a D-model whole phantom (tube nomenclature differed from that used in E-models) comparing the stability of T1 (a) and T2 (b) values between two repeat experiments (2 days apart) at various temperatures between 15 °C and 32 °C on a 3 T Siemens Verio system. Whiskers represent mean ± standard error. (c) Temperature dependency experiment (Test 2 in methods) comparing T1|T2 values in tubes A, B, C, D, E and I (middle right insert) from a final E-model phantom across five temperatures
Short-term reproducibility
Test 1: Six loose tubes as used in the 1.5 T E-model (Fig. 9) showed a CoV of ≤1 % for both T1 and T2reproducibility. Tube B with the longest T1 and T2 showed the greatest variability between repeated scans.
Test 2: Test-retest evaluation of one of the final phantoms for 3 T by cardiac T1 mapping, including complete repositioning and readjustments, also gave a short-term repeatability CoV for T1 ≤1 % (Table 3 detailing results for 3 T). For T2 measured by fast T2-prepared single-shot methods, the CoV was usually below 1 % with an exceptionally large 4.1 % in the tube B with longest T1.
Fig. 9.
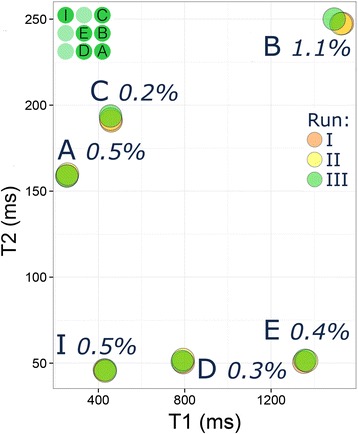
Short-term reproducibility. Short-term reproducibility (three runs) at the NIST laboratory (Test 1 in methods) for phantom T1values in six loose tubes (top left insert) from a final E-model phantom showing CoV of 1 % or less. Tube B with the longest T1|T2 showed the greatest variability between reads. CoV = coefficient of variation
Table 3.
Short-term reproducibility experiments in a 3 T final phantom (E-model)*
| Tube | Parameter | Sequence | CoV (%) | Mean diff. ± s.d. |
|---|---|---|---|---|
| A | T1 | pre_MOLLI_5(3)3_256_T1 | 0.16 | 255 ± 0.4 |
| post_MOLLI_4(1)3(1)2_256_MOCO_T1 | 0.18 | 255 ± 0.5 | ||
| T2 | T2_4pt_TRUFI_192i_T2 | 0.66 | 194 ± 1.3 | |
| T2_4pt_GRE_192i_T2 | 0.61 | 134 ± 0.8 | ||
| J | T1 | pre_MOLLI_5(3)3_256_T1 | 0.14 | 1860 ± 2.6 |
| post_MOLLI_4(1)3(1)2_256_MOCO_T1 | 0.17 | 1672 ± 2.8 | ||
| T2 | T2_4pt_TRUFI_192i_T2 | 4.06 | 227 ± 9.2 | |
| T2_4pt_GRE_192i_T2 | 1.37 | 203 ± 2.8 | ||
| C | T1 | pre_MOLLI_5(3)3_256_T1 | 0.08 | 460 ± 0.4 |
| post_MOLLI_4(1)3(1)2_256_MOCO_T1 | 0.08 | 461 ± 0.4 | ||
| T2 | T2_4pt_TRUFI_192i_T2 | 0.52 | 195 ± 1.0 | |
| T2_4pt_GRE_192i_T2 | 0.76 | 160 ± 1.2 | ||
| K | T1 | pre_MOLLI_5(3)3_256_T1 | 0.13 | 953 ± 1.2 |
| post_MOLLI_4(1)3(1)2_256_MOCO_T1 | 0.10 | 917 ± 0.9 | ||
| T2 | T2_4pt_TRUFI_192i_T2 | 0.98 | 60 ± 0.6 | |
| T2_4pt_GRE_192i_T2 | 0.67 | 49 ± 0.3 | ||
| L | T1 | pre_MOLLI_5(3)3_256_T1 | 0.08 | 1372 ± 1.1 |
| post_MOLLI_4(1)3(1)2_256_MOCO_T1 | 0.16 | 1252 ± 2.0 | ||
| T2 | T2_4pt_TRUFI_192i_T2 | 0.91 | 56 ± 0.5 | |
| T2_4pt_GRE_192i_T2 | 0.89 | 49 ± 0.4 | ||
| M | T1 | pre_MOLLI_5(3)3_256_T1 | 0.15 | 1178 ± 1.8 |
| post_MOLLI_4(1)3(1)2_256_MOCO_T1 | 0.12 | 1104 ± 1.3 | ||
| T2 | T2_4pt_TRUFI_192i_T2 | 0.91 | 58 ± 0.5 | |
| T2_4pt_GRE_192i_T2 | 0.66 | 49 ± 0.3 | ||
| G | T1 | pre_MOLLI_5(3)3_256_T1 | 0.19 | 285 ± 0.6 |
| post_MOLLI_4(1)3(1)2_256_MOCO_T1 | 0.20 | 285 ± 0.6 | ||
| T2 | T2_4pt_TRUFI_192i_T2 | 0.29 | 86 ± 0.2 | |
| T2_4pt_GRE_192i_T2 | 1.02 | 49 ± 0.5 | ||
| H | T1 | pre_MOLLI_5(3)3_256_T1 | 0.11 | 527 ± 0.6 |
| post_MOLLI_4(1)3(1)2_256_MOCO_T1 | 0.09 | 527 ± 0.5 | ||
| T2 | T2_4pt_TRUFI_192i_T2 | 0.35 | 66 ± 0.2 | |
| T2_4pt_GRE_192i_T2 | 0.72 | 46 ± 0.3 | ||
| I | T1 | pre_MOLLI_5(3)3_256_T1 | 0.06 | 406 ± 0.3 |
| post_MOLLI_4(1)3(1)2_256_MOCO_T1 | 0.05 | 409 ± 0.2 | ||
| T2 | T2_4pt_TRUFI_192i_T2 | 0.21 | 72 ± 0.2 | |
| T2_4pt_GRE_192i_T2 | 0.19 | 47 ± 0.1 |
*All tests performed at 20.3 ± 0.48 °C on Siemens, Skyra 3 T at RBHT, November 2015 with RR interval 900 ms and using two T1 mapping sequences (pre-MOLLI 5(3)3 [256] and post-MOLLI 4(1)3(1)2 [256] with MOCO, WIPs# 780B) and two T2 mapping sequences (TRUFI T2 map and GRE T2 map)
CoV coefficients of variation, diff. difference, GRE gradient echo, MOCO motion correction, MOLLI modified Look-Locker inversion recovery, RR inter-beat interval, s.d. standard deviation, TRUFI true fast imaging with steady-state free precession
Production, distribution and initiation of trial
On 1st September 2015 the E-model T1MES phantoms (batch numbers TTP15-001 and TTP30-001 for 1.5 T and 3 T respectively) received regulatory clearance by the Food and Drug Administration (FDA) and Conformité Européene (CE) marking as a Class I Medical Device (GMDN 40636). This initial mass manufacturing phantom experience was not always 100 % successful and important quality control lessons have been learnt: for example two different fill solutions for tubes were accidentally mislabelled initially and had to be discarded and remade; individual tubes with visible bubbles on inspection had to be corrected with appropriate procedures; any solution stock with T1 or/and T2 not falling within +/− 3 % of our pre-specified targeted range had to be adjusted.
A total of 75 multi-vendor CMR scanners (four systems: Siemens, Philips, General Electric [GE] and Agilent) across five continents (Table 4), are currently using T1MES phantoms for their local T1 mapping QA as part of the international T1MES program. This amounts to an initial 53 individual CMR centers and 69 devices, with six centers using the same field-specific phantom for QA scans on more than one local machine.
Table 4.
Quality assurance of T1 mapping: the initial T1MES CMR centers
| Center | Magnet characteristics | ||||||
|---|---|---|---|---|---|---|---|
| Vendor | Tesla | Name | YOM | Software | Boreb (cm) | Gradient performancec | |
| St Thomas’ Hospital UK | Siemens | 1.5 | Aera | 2015 | VE11 | 70 | 45/200 |
| St Thomas’ Hospital UK | Philips | 1.5 | Ingenia | 2013 | R4.1.3SP2 | 70 | 33/200 |
| Oslo University Hospital Norway | Siemens | 1.5 | Aera | 2014 | VE11 | 70 | 40/200 |
| Bristol Heart Institute UK | Siemens | 1.5 | Avanto | 2009 | VB17A | 60 | 44/180 |
| Diagnostikum Berlin Germany | Siemens | 1.5 | Aera | 2015 | VE11 | 70 | 45/200 |
| GOSH UK | Siemens | 1.5 | Avanto | 2007 | VB17 | 60 | 40/180 |
| NIH Bethesda US | Siemens | 1.5 | Aera | 2014 | VE11 | 70 | 45/200 |
| Pittsburgh Pennsylvania US | Siemens | 1.5 | Espree | 2009 | VB17A | 70 | 40/200 |
| Leiden UMC The Netherlands | Philips | 1.5 | Ingenia | 2014 | R5.1.7SP2 | 70 | 45/200 |
| Leeds General Infirmary UK | Philips | 1.5 | Ingenia | 2014 | R5.1.7SP2 | 70 | 45/200 |
| MUMC The Netherlands | Philips | 1.5 | Ingenia | 2012 | R 5.1.7SP2 | 70 | 45/200 |
| Policlinico San Donato Italy | Siemens | 1.5 | Aera | 2012 | VD13A | 70 | 45/200 |
| Papworth UK | Siemens | 1.5 | Avanto | 2008 | VB17A | 60 | 50/200 |
| Wythenshawe Manchester UK | Siemens | 1.5 | Avanto | 2008 | VB17A | 60 | 45/200 |
| Copenhagen University Hospital Denmark | Siemens | 1.5 | Avanto | 2008 | VD13A | 60 | 45/200 |
| Queen Elizabeth Hospital Birmingham UK | Siemens | 1.5 | Avanto | 2008 | VB17A | 60 | 33/125 |
| Birmingham Children’s Hospital UK | Siemens | 1.5 | Avanto | 2010 | VB17A | 60 | 33/125 |
| University of Kentucky USA | Siemens | 1.5 | Aera | 2012 | VD13A | 70 | 45/200 |
| Charles Perkins Sydney Australia | Siemens | 1.5 | Avanto | 2013 | VE17A | 70 | 45/200 |
| Taichung Veterans Hospital Taiwan | Siemens | 1.5 | Aera | 2005 | VE11 | 60 | 45/200 |
| Monash Heart Australia | Siemens | 1.5 | Avanto | 2010 | VB17 | 55 | 40/200 |
| Niguarda Hospital Milan Italy | Siemens | 1.5 | Avanto | 2005 | VB17A | 60 | 40/200 |
| Golden Jubilee Glasgow UK | Siemens | 1.5 | Avanto | 2008 | VB17A | 60 | 45/200 |
| T-T!ME Multi-center phantoma | |||||||
| INSERM U1044 France | Siemens | Aera | 2012 | VD13A | 70 | 40/200 | |
| King Abdul-Aziz Saudi Arabia | GE | 1.5 | Discovery MR450 | 2012 | DV24 | 60 | 50/200 |
| Prince Charles Hospital Queensland | Siemens | 1.5 | Aera | 2011 | VD13A | 70 | 45/200 |
| Federal Medical Center Moscow | GE | 1.5 | Optima MR450w | 2014 | DV25 | 70 | 44/200 |
| Medical University of Vienna Austria | Siemens | 1.5 | Avanto | 2006 | VD13B | 60 | 40/200 |
| DHZ Berlin Germany | Philips | 1.5 | Achieva | 2008 | R5.1.8 | 60 | 33/180 |
| St George’s University London UK | Siemens | 1.5 | Aera | 2014 | E11 | 70 | 45/200 |
| RBHT London UK | Siemens | 1.5 | Avanto | 2005 | VB17A | 60 | 40/170 |
| University Hospital Southampton UK | Siemens | 1.5 | Avanto | 2006 | VB17A | 60 | 40/200 |
| Barts Heart Center London UK | Siemens | 1.5 | Aera | 2014 | VD13A | 70 | 45/200 |
| Barts Heart Center London UK | Siemens | 1.5 | Aera | 2015 | VE11A | 70 | 45/200 |
| The Heart Hospital London UK | Siemens | 1.5 | Avanto | 2009 | VD13A | 70 | 40/200 |
| Charité Campus Buch Germany | Siemens | 1.5 | Avanto | 2007 | VB13B | 60 | 40/200 |
| University of Virginia US | Siemens | 1.5 | Avanto | 2005 | VB17A | 60 | 45/200 |
| University of Virginia US | Siemens | 1.5 | Avanto | 2015 | VD13A | 60 | 45/200 |
| SIEMENS EU | Siemens | 1.5 | Aera | 2009 | VE11 | 70 | 45/200 |
| UZ Leuven Belgium | Philips | 1.5 | Ingenia | 2007 | R5.1.7 | 60 | 45/ 200 |
| UZ Leuven Belgium | Philips | 1.5 | Achieva XR | 2014 | R5.1.7 | 70 | 33/122 |
| Beth Israel Deaconess Medical Center, US | Philips | 1.5 | Achieva | 2005 | R3.2 | 60 | 33/180 |
| NIH Bethesda US | Siemens | 1.5 | Aera | 2012 | VD13A | 70 | 45/200 |
| St Thomas’ Hospital UK | Philips | 3 | Achieva TX | 2007 | R3.2.3 | 60 | 40/200 |
| St Thomas’ Hospital UK | Siemens | 3 | Biograph mMR | 2013 | VB20P | 60 | 45/200 |
| Fondazione Toscana Monasterio Pisa Italy | Philips | 3 | Ingenia | 2012 | R5.1.8 | 70 | 45/200 |
| Oslo University Hospital Norway | Philips | 3 | Ingenia | 2011 | 5.1.7 | 70 | 45/200 |
| Oslo University Hospital Norway | Siemens | 3 | Skyra | 2014 | VE11 | 70 | 45/120 |
| CRIC Bristol UK | Siemens | 3 | Skyra | 2009 | VD13C | 60 | 44/180 |
| Diagnostikum Berlin Germany | Siemens | 3 | Skyra | 2012 | VE11 | 70 | 45/200 |
| University of Aberdeen Scotland UK | Philips | 3 | Achieva TX | 2015 | R5.1.7 | 60 | 80/100 |
| NIH Bethesda US | Siemens | 3 | Verio | 2009 | VB17 | 70 | 33/125 |
| Leiden UMC The Netherlands | Philips | 3 | Achieva TX | 2012 | R5.1.8.2 | 70 | 45/200 |
| MUMC The Netherlands | Philips | 3 | Achieva TX | 2011 | R 3.2 | 60 | 40/200 |
| Wythenshawe Manchester UK | Siemens | 3 | Skyra | 2014 | VE11 | 70 | 45/200 |
| Copenhagen University Hospital Denmark | Siemens | 3 | Verio | 2010 | VB17 | 70 | 45/200 |
| Charles Perkins Sydney Australia | GE | 3 | Discovery MR750w | 2014 | DV25 | 70 | 44/200 |
| BHF Glasgow Center UK | Siemens | 3 | Prisma | 2015 | VE11 | 60 | 80/200 |
| INSERM U1044 France | Siemens | 3 | Prisma | 2015 | VE11 | 60 | 80/200 |
| DHZ Berlin Germany | Philips | 3 | Ingenia | 2011 | R5.1.8 | 70 | 45/200 |
| St George’s University London UK | Philips | 3 | Achieva TX | 2012 | R5.1 | 60 | 40/150 |
| RBHT London UK | Siemens | 3 | Skyra PTX | 2011 | VD13C | 70 | 43/180 |
| Barts Heart Center London UK | Siemens | 3 | Prisma | 2015 | VE11 | 60 | 80/200 |
| Leeds General Infirmary UK | Philips | 3 | Achieva TX | 2010 | R5.2 | 60 | 40/120 |
| Montreal Heart Institute Canada | Siemens | 3 | Skyra | 2012 | VD13A | 70 | 45/200 |
| PTB Germany | Siemens | 3 | Verio | 2010 | VB17A | 70 | 45/200 |
| University of Virginia US | Siemens | 3 | Skyra | 2011 | VE11A | 70 | 45/200 |
| UZ Leuven Belgium | Philips | 3 | Ingenia | 2010 | R5.1.7 | 70 | 45/200 |
| NIH Bethesda US | Siemens | 3 | Skyra | 2012 | VD13A | 70 | 45/200 |
| University of Queensland Australia | Siemens | 7 | Magnetom 7 | 2013 | VB17B | 60 | 72/200 |
| University of Queensland Australia | Siemens | 3 | Trio TIM | 2008 | VB17A | 60 | 45/200 |
| Glenfield Hospital Leicester UK | Siemens | 3 | Skyra | 2010 | VD13A | 70 | 45/200 |
| Baker IDI Australia | Siemens | 3 | Prisma | 2014 | VD13D | 60 | 80/200 |
| NIST USd | Agilent | 1.5 | Varian | 2013 | VnmrJ 4 | 14 | 300/475 |
| NIST USd | Agilent | 1.5 | Varian | 2013 | VnmrJ 4 | 14 | 300/475 |
aThis phantom is a gift to support the ongoing ’T-T!ME’ study. It will be scanned across multiple UK centers
bInner diameter i.e. around patient
cMaximum gradient performances as returned on the T1MES registration forms by each site. These values are subject to many modifying conditions. More relevant parameters such as TR and TE will be extracted from uploaded Digital Imaging and Communications in Medicine (DICOM) images where this is possible from DICOM
dLoose tubes only for 1.5 T and 3 T
YOM year of manufacture
Discussion
Results obtained thus far demonstrate that: 1) mass production of phantoms to regulatory standards and in accordance with a rigorously repeatable process is feasible, 2) based on the sequences used, T1|T2 times in gels are highly reproducible in the short-term, 3) a significant temperature dependency of measured T1|T2 values exists in tubes with longer T1 values that will require the use of a correction model.
The T1MES program seeks to advance the field of quantitative CMR relaxometry and the use of imaging biomarkers like T1 mapping and ECV in clinical trials and clinical practice. Our aim was to collaborate with industry, with leading CMR academics and clinical centers with an interest in T1 mapping, so as to develop and test a multicenter QA infrastructure, to protect normal reference data at centers and also potentially to improve consistency of T1 mapping and ECV results across imaging platforms, clinical sites, and over time. Key to the achievement of accurate and reproducible T1mapping/ECV results in CMR is the accelerated development and adoption of rigorous hardware and software standards.
However, this proposal is subject to a further limitation that the phantoms do not model other aspects of tissues, particularly for myocardium—the magnetisation transfer [22] neither does it address the mapping techniques’ ability to discriminate T1 values between adjacent regions of interest (the clinical challenge of discriminating tissue T1 values in adjacent myocardial segments). For example, the signal-to-noise ratio in the phantoms is unrealistically high as the surface coils are typically nearer; evaluating such an ability is beyond the scope of T1MES. The only realistic aim may prove to be that of providing individual (or genuinely identical) centers with a QA phantom that could protect normal reference data and assure (or even permit correction of changes in) stability of protocols during a long study.
The 1-year study, now running, is expected also to give information about gel stability. It seems reasonable to expect sudden steps in T1 values from genuine changes in the acquisition, or scatter from any remaining uncontrolled parameters or imperfect temperature correction, but there would be a gradual monotonic drift as the gel water content changes. Agarose gel is inherently unstable even within a sealed tube, because the gel contracts as water leaves it, appearing as excess water (as droplets) in the gap left by the contraction, often visible on the inner wall of the tube. Note that this effect can occur within well-sealed tubes. It is unrelated to contamination because agarose without added nutrients does not support mould growth. Over time, this shrinkage may also occur in the matrix fill leading to air-gaps and B0 distortion, potentially occurring near the tubes making a possible contribution to an apparent drift in T1 values over time. For the first time, the 1-year study will give large-scale initial data on the durability of this type of phantom. At study end, we aim to recall approximately 10 % of the phantoms which will be inspected for flaws in the gel using high-resolution 3D imaging, with collection also of long reference T1|T2data as gel drying with shrinkage and condensation into the gap is known to occur even within a sealed tube. Centers are free to keep and use the T1MES phantoms after the 1-year study ends. There is no provision for return shipment to the coordinating site, nor any knowledge of how long the gels will remain usable.
The field and temperature dependence of T1 for phantoms containing Ni2+ is much smaller than those containing other paramagnetic ions like Cu2+. As T1 increases above 500 ms (in tubes with a low concentration of Ni2+), the tube’s T1 becomes more temperature-sensitive as it is increasingly dominated by the temperature sensitive T1 of water in the gel [24, 25]. Therefore temperature monitoring of each fortnightly session is essential. Our results enable us to integrate a temperature-correction model into our multicenter T1MES analysis, that will be published at the end of the project. The temperature sensitivity of T1 revealed in the present work may not be a concern for clinical T1 mapping in healthy volunteers (as the human body is homeothermic—temperature of 37 °C) but it may be a concern for hypothermic or febrile patients. Furthermore T2 temperature dependence could also impact measured T1 as some fast-T1 methods have considerable T2 sensitivity.
Conclusion
We report on the establishment of a collaboration to develop CMR phantoms to CE/FDA standards and an initial multicenter repeat scanning program aiming for global QA of T1 and ECV protocols. A rigorous and reproducible manufacturing process for the phantoms has been established. The temperature sensitivity, short-term stability and inter-phantom consistency have all been assessed in support of the main project. An initial 69 phantoms with a multi-vendor user manual are now being scanned fortnightly in centers worldwide, permitting the academic exploration of T1 mapping sequences, platform performance and stability over a year.
Acknowledgements
The authors are indebted to all the staff of Resonance Health and to scientists and physicists at St. Thomas’ Hospital, in particular Dr Amedeo Chiribiri. They are also indebted to Siemens Healthcare GmBH (Dr Andreas Greiser, Dr Carmel Hayes, Dr Shivraman Giri), Philips (Dr David Higgins) and GE Healthcare (Dr Glenn Slavin and Dr Anja Brau) for their ongoing advice.
Funding
This project has been funded by a European Association of Cardiovascular Imaging (EACVI part of the ESC) Imaging Research Grant, a UK National Institute of Health Research (NIHR) Biomedical Research Center (BRC) Cardiometabolic Research Grant at University College London (UCL, #BRC/199/JM/101320), and a Barts Charity Research Grant (#1107/2356/MRC0140). G.C. is supported by the National Institute for Health Research Rare Diseases Translational Research Collaboration (NIHR RD-TRC) and by the NIHR UCL Hospitals Biomedical Research Center. J.C.M. is directly and indirectly supported by the UCL Hospitals NIHR BRC and Biomedical Research Unit at Barts Hospital respectively. This work was in part supported by an NIHR BRC award to Cambridge University Hospitals NHS Foundation Trust and NIHR Cardiovascular Biomedical Research Unit support at Royal Brompton Hospital London UK.
Availability of data and materials
A supplementary material is now provided with detailed information about the T1MES analysis procedure and setup instructions.
Authors’ contributions
JCM, PG and GC developed the concept and approach; PK provided crucial scientific advice, computational scripts and graphical user interfaces that permitted T1MES data analysis; GC, PG and JCM wrote the manuscript; PG and GC performed phantom design experiments in London; JD provided methodological insights; WP, AB and CR oversaw the mass production and technical development of phantoms in Australia; WP and FGH performed temperature experiments in Australia; GC performed the statistical analysis; FGH and WP performed the model curvefitting for tube recipes; GC, RBo, RJE, CT and GB contributed to analysis of international phantom datasets. PK, KEK, RBr, MP, MJG, BI, RN and MS performed phantom experiments on prototypes in the expert centers, participated in data interpretation, study design and contributed to the manuscript; all authors reviewed and approved the final manuscript.
Authors’ information
This is all reported in the title page including author degrees, affiliations, emails and titles. The manuscript has neither been published nor is currently under consideration for publication by any other journal. All named authors have seen and approved the final version.
Competing interests
An industrial group (Resonance Health) is being funded to mass-produce the described T1MES phantoms to CE mark/FDA standards to permit international distribution in the T1MES academic program. No financial or non-financial competing interests exist for any of the authors.
Consent for publication
Not applicable - As this research did not involve human participants there is no consent for publication required. All authors have read and approved the final manuscript for publication.
Ethics approval and consent to participate
Not applicable - As this research did not involve human participants there is no ethical approval to report.
Abbreviations
- CE
Conformité Européene
- CoV
Coefficients of variation
- Cu2+
Copper ions
- DICOM
Digital imaging and communications in medicine
- ECV
Extracellular volume
- FA
Flip angle
- FDA
Food and Drug Administration
- GBCA
Gadolinium-based contrast agents
- GE
General electric
- HDPE
High-density polyethylene
- Hz
Hertz
- IRSE
Inversion recovery spin echo
- LCD
Liquid crystal display
- Mn2+
Manganese ions
- MOLLI
Modified look-locker inversion recovery
- MR
Magnetic resonance
- NaCl
Sodium chloride
- Ni2+
Nickel ions
- NiCl2
Nickel chloride
- NMR
Nuclear magnetic resonance
- PMMA
Poly methyl-methacrylate
- QA
Quality assurance
- R1|R2
Relaxivity of T1 and T2
- RF
Radiofrequency
- RMSE
Root-mean-square error
- ROI
Region of interest
- RR
Inter-beat interval
- SAR
Specific absorption rate
- SASHA
Saturation recovery single-shot acquisition
- SE
Spin echo
- ShMOLLI
Shortened modified Look-Locker inversion recovery sequence
- T1|T2
T1 and T2
- TE
Echo time
- TI
Inversion time
- TR
Repetition time
Additional file
The T1MES User Manual. (PDF 13350 kb)
Contributor Information
Gabriella Captur, Phone: +44 07809621264, Email: gabriella.captur.11@ucl.ac.uk.
Peter Gatehouse, Email: p.gatehouse@rbht.nhs.uk.
Kathryn E. Keenan, Email: kathryn.keenan@nist.gov
Friso G. Heslinga, Email: friso_heslinga@live.nl
Ruediger Bruehl, Email: ruediger.bruehl@ptb.de.
Marcel Prothmann, Email: marcel.prothmann@charite.de.
Martin J. Graves, Email: mjg40@cam.ac.uk
Richard J. Eames, Email: richard.eames13@imperial.ac.uk
Camilla Torlasco, Email: camilla.torlasco@gmail.com.
Giulia Benedetti, Email: benedetti.giulia@hsr.it.
Jacqueline Donovan, Email: j.donovan@rbht.nhs.uk.
Bernd Ittermann, Email: bernd.ittermann@ptb.de.
Redha Boubertakh, Email: r.boubertakh@qmul.ac.uk.
Andrew Bathgate, Email: akbathgate@iinet.com.au.
Celine Royet, Email: celiner@resonancehealth.com.
Wenjie Pang, Email: wenjiep@resonancehealth.com.
Reza Nezafat, Email: rnezafat@bidmc.harvard.edu.
Michael Salerno, Email: MS5PC@hscmail.mcc.virginia.edu.
Peter Kellman, Email: kellmanp@nhlbi.nih.gov.
James C. Moon, Phone: +44 2034563081, Email: j.moon@ucl.ac.uk
References
- 1.Moon JC, Messroghli DR, Kellman P, Piechnik SK, Robson MD, Ugander M, Gatehouse PD, Arai AE, Friedrich MG, Neubauer S, Schulz-Menger J, Schelbert EB. Myocardial T1 mapping and extracellular volume quantification: a Society for Cardiovascular Magnetic Resonance (SCMR) and CMR Working Group of the European Society of Cardiology consensus statement. J Cardiovasc Magn Reson. 2013;15:92. doi: 10.1186/1532-429X-15-92. [DOI] [PMC free article] [PubMed] [Google Scholar]
- 2.Kellman P, Arai AE, Xue H. T1 and extracellular volume mapping in the heart: estimation of error maps and the influence of noise on precision. J Cardiovasc Magn Reson. 2013;15:56. doi: 10.1186/1532-429X-15-56. [DOI] [PMC free article] [PubMed] [Google Scholar]
- 3.Kellman P, Hansen MS. T1-mapping in the heart: accuracy and precision. J Cardiovasc Magn Reson. 2014;16:2. doi: 10.1186/1532-429X-16-2. [DOI] [PMC free article] [PubMed] [Google Scholar]
- 4.Raman FS, Kawel-Boehm N, Gai N, Freed M, Han J, Liu C-Y, Lima JA, Bluemke DA, Liu S. Modified look-locker inversion recovery T1 mapping indices: assessment of accuracy and reproducibility between magnetic resonance scanners. J Cardiovasc Magn Reson. 2013;15:64. doi: 10.1186/1532-429X-15-64. [DOI] [PMC free article] [PubMed] [Google Scholar]
- 5.Messroghli DR, Greiser A, Fröhlich M, Dietz R, Schulz-Menger J. Optimization and validation of a fully-integrated pulse sequence for modified look-locker inversion-recovery (MOLLI) T1 mapping of the heart. J Magn Reson Imaging. 2007;26:1081–6. doi: 10.1002/jmri.21119. [DOI] [PubMed] [Google Scholar]
- 6.Gai ND, Stehning C, Nacif M, Bluemke DA. Modified Look-Locker T1 evaluation using Bloch simulations: Human and phantom validation. Magn Reson Med. 2013;69:329–36. doi: 10.1002/mrm.24251. [DOI] [PMC free article] [PubMed] [Google Scholar]
- 7.Tofts PS. Standing waves in uniform water phantoms. J Magn Reson. 1994;104:143–7. doi: 10.1006/jmrb.1994.1067. [DOI] [Google Scholar]
- 8.Kuchel PW, Chapman BE, Bubb WA, Hansen PE, Durrant CJ, Hertzberg MP. Magnetic susceptibility: Solutions, emulsions, and cells. Concepts Magn Reson. 2003;18A:56–71. doi: 10.1002/cmr.a.10066. [DOI] [Google Scholar]
- 9.Freed DE. Dependence on chain length of NMR relaxation times in mixtures of alkanes. J Chem Phys. 2007;126:174502. doi: 10.1063/1.2723734. [DOI] [PubMed] [Google Scholar]
- 10.Christoffersson JO, Olsson LE, Sjöberg S. Nickel-doped agarose gel phantoms in MR imaging. Acta radiol. 1991;32:426–31. doi: 10.1177/028418519103200519. [DOI] [PubMed] [Google Scholar]
- 11.Mitchell MD, Kundel HL, Axel L, Joseph PM. Agarose as a tissue equivalent phantom material for NMR imaging. Magn Reson Imaging. 1986;4:263–6. doi: 10.1016/0730-725X(86)91068-4. [DOI] [PubMed] [Google Scholar]
- 12.Keenan K, Stupic K, Horneber E, Boss M, Russek S. Paramagnetic ion phantom to independently tune T1 and T2. Proc from ISMRM 23rd Annu Meet Exhib. 2015, Abstract.
- 13.Kraft KA, Fatouros PP, Clarke GD, Kishore PR. An MRI phantom material for quantitative relaxometry. Magn Reson Med. 1987;5:555–62. doi: 10.1002/mrm.1910050606. [DOI] [PubMed] [Google Scholar]
- 14.Yoshida A, Kato H, Kuroda M, Hanamoto K. Development of a phantom compatible for MRI and hyperthermia using carrageenan gel — relationship between T 1 and T 2 values and NaCl concentration. Int J Hyperth. 2004;8:803–14. doi: 10.1080/0265673042000199268. [DOI] [PubMed] [Google Scholar]
- 15.Kellar KE, Briley-Saebø K. Phantom standards with temperature- and field-independent relaxation rates for magnetic resonance imaging. Invest Radiol. 1998;33:472–9. doi: 10.1097/00004424-199808000-00008. [DOI] [PubMed] [Google Scholar]
- 16.Koenig SH, Brown RD. Relaxation of solvent protons by paramagnetic ions and its dependence on magnetic field and chemical environment: implications for NMR imaging. Magn Reson Med. 1984;1:478–95. doi: 10.1002/mrm.1910010407. [DOI] [PubMed] [Google Scholar]
- 17.Vassiliou V, Heng E, Donovan J, Greiser A, Babu-Narayan SV, Gatzoulis MA, Firmin D, Pennell DJ, Gatehouse P, Prasad SK. Longitudinal stability of gel T1 MRI Phantoms for quality assurance of T1 mapping. J Cardiovasc Magn Reson. 2015;17(Suppl 1):W28. doi: 10.1186/1532-429X-17-S1-W28. [DOI] [Google Scholar]
- 18.Kellman P, Herzka DA, Arai AE, Hansen MS. Influence of off-resonance in myocardial T1-mapping using SSFP based MOLLI method. J Cardiovasc Magn Reson. 2013;15:63. doi: 10.1186/1532-429X-15-63. [DOI] [PMC free article] [PubMed] [Google Scholar]
- 19.Hernando D, Kellman P, Haldar JP, Liang Z. Robust water/fat separation in the presence of large field inhomogeneities using a graph cut algorithm. Magn Reson Med. 2010;63:79–90. doi: 10.1002/mrm.22177. [DOI] [PMC free article] [PubMed] [Google Scholar]
- 20.Tofts PS, Barker GJ, Dean TL, Gallagher H, Gregory AP, Clarke RN. A low dielectric constant customized phantom design to measure RF coil nonuniformity. Magn Reson Imaging. 1997;15:69–75. doi: 10.1016/S0730-725X(96)00220-2. [DOI] [PubMed] [Google Scholar]
- 21.Webb A. Optimizing the point spread function in phase-encoded magnetic resonance microscopy. Concepts Magn Reson. 2004;22A:25–36. doi: 10.1002/cmr.a.20010. [DOI] [Google Scholar]
- 22.Robson MD, Piechnik SK, Tunnicliffe EM, Neubauer S. T1 measurements in the human myocardium: The effects of magnetization transfer on the SASHA and MOLLI sequences. Magn Reson Med. 2013;70:664–70. doi: 10.1002/mrm.24867. [DOI] [PubMed] [Google Scholar]
- 23.Captur G, Gatehouse P, Pang W, Royet C, Moon J. T1MES user manual. 2015. Download link: https://redcaphh.c-cloudservices.net/surveys/?s=dRcYg3HGz5 2015.
- 24.Simpson JH, Carr HY. Diffusion and nuclear spin relaxation in water. Phys Rev. 1958;111:1201–2. doi: 10.1103/PhysRev.111.1201. [DOI] [Google Scholar]
- 25.Tofts P. Quality assurance, accuracy, precision and phantoms. In: Tofts P, editor. In Chapter 3: Quantitative MRI of the brain: measuring changes caused by disease. Chichester: John Wiley; 2003. pp. 55–81. [Google Scholar]
Associated Data
This section collects any data citations, data availability statements, or supplementary materials included in this article.
Data Availability Statement
A supplementary material is now provided with detailed information about the T1MES analysis procedure and setup instructions.