Abstract
Nitrogen dioxide retrievals from the Aura/Ozone Monitoring Instrument (OMI) have been used extensively over the past decade, particularly in the study of tropospheric air quality. Recent comparisons of OMI NO2 with independent data sets and models suggested that the OMI values of slant column density (SCD) and stratospheric vertical column density (VCD) in both the NASA OMNO2 and Royal Netherlands Meteorological Institute DOMINO products are too large, by around 10–40%. We describe a substantially revised spectral fitting algorithm, optimized for the OMI visible light spectrometer channel. The most important changes comprise a flexible adjustment of the instrumental wavelength shifts combined with iterative removal of the ring spectral features; the multistep removal of instrumental noise; iterative, sequential estimates of SCDs of the trace gases in the 402–465 nm range. These changes reduce OMI SCD(NO2) by 10–35%, bringing them much closer to SCDs retrieved from independent measurements and models. The revised SCDs, submitted to the stratosphere‐troposphere separation algorithm, give tropospheric VCDs ∼10–15% smaller in polluted regions, and up to ∼30% smaller in unpolluted areas. Although the revised algorithm has been optimized specifically for the OMI NO2 retrieval, our approach could be more broadly applicable.
Keywords: remote sensing, instruments and techniques, atmosphere: composition and chemistry
Key Points
We developed new NO2 fitting approach for the Aura Ozone Monitoring Instrument
New fitting algorithm provides 10–35% lower NO2 slant column densities
Both the stratospheric and tropospheric NO2 components are reduced
1. Introduction
Nitrogen oxides (NOx = NO + NO2) are important species in both the stratosphere and troposphere, where they impact ozone chemistry and air pollution [Finlayson‐Pitts and Pitts, 2000; Seinfeld and Pandis, 2006]. Away from regions of tropospheric pollution, close to 90% of the NO2 total vertical column density (VCD) is found in the stratosphere, where it is approximately zonally symmetric and varies meridionally with season. In polluted tropospheric regions, the tropospheric column exceeds the stratospheric NOx and comes from fossil fuel combustion, with lightning and bacterial soil emissions as secondary sources. Nitrogen dioxide (NO2) leads to photochemical ozone and aerosol production and is itself the subject of environmental regulation. NO2 VCDs have been retrieved from satellite‐based measurements since 1995, by Global Ozone Monitoring Experiment (GOME) [Burrows et al., 1999], GOME‐2 [Callies et al., 2000], Scanning Imaging Absorption Spectrometer for Atmospheric Chartography, on Envisat (SCIAMACHY) [Bovensmann et al., 1999], and Ozone Monitoring Instrument (OMI) [Levelt et al., 2006]. Each of these instruments uses the solar backscatter technique. All are in polar, Sun‐synchronous orbits, permitting, for some, nearly daily global NO2 measurements.
Satellite‐based estimates of NO2 columns have been widely used in studies of atmospheric chemistry, air quality, and climate (greenhouse gas trends and lifetimes), and in the evaluation of chemistry transport models (CTMs). In the stratosphere, satellite‐based NO2 observations have been used to study factors influencing ozone loss and recovery [e.g., Adams et al., 2013] as well as long‐term trends in stratospheric composition [e.g., Dirksen et al., 2011, Hendrick et al., 2012]. In the troposphere, satellite NO2 records show the sources [van der A et al., 2008; Lin et al., 2010; Ghude et al., 2013; Mebust et al., 2011; Mebust and Cohen, 2013], spatial patterns [Martin et al., 2003; Toenges‐Schuller et al., 2006; Russell et al., 2010; Hilboll et al., 2013a], and trends of NOx emissions [Richter et al., 2005; Kim et al., 2006; Zhang et al., 2007; Boersma et al., 2008; McLinden et al., 2012; de Wildt et al., 2012; Russell et al., 2012; Duncan et al., 2013; Streets et al., 2013; Vinken et al., 2014], NOx lifetimes [Schaub et al., 2007; Lamsal et al., 2010; Beirle et al., 2011], and the impact of population and economic activity on NOx emissions [Lamsal et al., 2013].
NO2 VCDs for both the stratosphere and troposphere have been produced operationally by OMI since its launch in 2004 [Levelt et al., 2006]. Aura/OMI has an equator crossing time of approximately 13:45 in the ascending node, nearly global daily (until 2008) coverage, and a spatial resolution at nadir of 13 × 24 km2. Nitrogen dioxide slant column density (SCD), or the effective total column amount along the optical path, is retrieved using differential optical absorption spectroscopy (DOAS) [Platt and Stutz, 2006]. The NO2 vertical column density is then calculated as VCD = SCD/AMF, where the air mass factor (AMF) is estimated using radiative transfer calculations [e.g., Bucsela et al., 2013]. There are two independent sets of OMI operational NO2 products: OMNO2 (NASA) [Bucsela et al., 2008, 2013; Lamsal et al., 2014] and DOMINO (Royal Netherlands Meteorological Institute, KNMI) [Boersma et al., 2007, 2011], which are derived from the same SCD retrieval but use independent AMF computations and stratosphere–troposphere separation schemes. OMNO2 and DOMINO VCDstrat agree to within a few percent on a zonal mean basis, although Bucsela et al. [2013] showed that there are important differences in the spatial distribution of the stratospheric NO2 field. The current versions of the OMNO2 and DOMINO VCDtrop products (version 2) are also in generally good agreement [Bucsela et al., 2013].
Recent studies compared OMI VCD(NO2) to VCDs obtained from other instrumental measurements, both space based and ground based [Krotkov et al., 2012; Maasakkers et al., 2013; Belmonte Rivas et al., 2014; van Geffen et al., 2014], and suggest that the OMI‐estimated VCDs are greater than the others by as much as 30% over unpolluted regions. An almost constant, ∼−1.0 × 10¹⁵ mol cm−2 bias between the SCDs provided by DOMINO and an alternative QDOAS algorithm was noted by Anand et al. [2015]. All these studies suggest that the biased SCD(NO2) values are the likely source of the discrepancy in the final VCD(NO2) product.
In this study we address the long‐standing problem of the OMI SCD(NO2) bias by proposing a sequential DOAS SCD retrieval algorithm, applying it to the OMI data and highlighting some key results. The revision was made possible by an understanding of OMI's performance gained through more than 10 years of measurements, as well as a thorough analysis of fitting residuals. We show that the proposed approach radically reduces the known systematic OMI SCD(NO2) differences with respect to independent data sets. We also use the new SCD retrievals to examine the impact on both stratospheric and tropospheric VCD(NO2).
2. OMI and Operational NO2 Algorithm
The OMI detector is a two‐dimensional CCD array. The instrument optics are designed such that the spatial dimension of the detector is oriented across the orbit track with a 115° field of regard, while the other dimension records spectral information. The spatial dimension is divided into either 60 or 30 rows (after coadding), thus providing 60(30) effective cross‐track fields‐of‐view (FOVs; we call them rows in the technical discussion). Three separate detectors [Dobber et al., 2006], designated UV‐1, UV‐2, and VIS, have spectral coverage in the ranges 264–311 nm (δ λ = 0.63 nm), 307–383 nm (δ λ = 0.42 nm), and 349–504 nm (δ λ = 0.63 nm), respectively. The NO2 molecule has strong, broad, highly structured spectral features in the ∼350–510 nm range; hence, the VIS detector covers most of the wavelength range needed for the NO2 retrieval. Spectral measurements in the 60 cross‐track FOVs are made over 2 s intervals. This results in along‐track coverage of 13 km, and a cross track of ∼24 km for the near‐nadir FOVs. During each orbit a total of about 1640 exposures are recorded on the sunlit side of the Earth. The width of the swath is such that 15 orbits are required to observe the entire surface of the Earth.
An operational algorithm to derive VCD(NO2) is described in Bucsela et al. [2013] and Lamsal et al. [2014]. The algorithm runs in three separate, consecutive steps: (1) spectral fit, producing SCD(NO2) and SCD errors, (2) calculation of air mass factors and AMF errors, and (3) generation of vertical column densities using a stratosphere‐troposphere separation scheme.
2.1. Operational SCD Fitting Algorithm
The currently implemented SCD fitting algorithm [Boersma et al., 2002, 2007] closely follows the general concepts of DOAS [Platt and Stutz, 2006]. The earthshine spectra are converted to reflectances using a static solar reference spectrum, after a wavelength adjustment. The fixed‐temperature NO2, H2O, and O3 cross sections (each convolved with a parametrized slit function to match the OMI resolution), the single‐scattering air ring spectrum (RS) and a high‐order (currently, fifth‐order) polynomial function are simultaneously fitted to the reflectances, to produce the respective SCDs and RS amplitudes. The RS component is treated as a pseudoabsorber [van Geffen et al., 2014].
2.2. The Subsequent Steps: AMF Calculation and SCD‐to‐VCD Conversion
The retrieved SCDs are corrected for instrumental artifacts (in particular, for interrow systematic differences called stripes [see Dobber et al., 2008a]) using the stratospheric AMFs as described in Bucsela et al. [2013]. AMFs are calculated from tabulated, precomputed values of vertically resolved NO2 sensitivities (scattering weights) and a priori NO2 vertical profile shapes. The scattering weights are parametrized by three optical angles, the surface pressure and reflectivity at the FOV center. The surface pressure is determined from a digital elevation model, and the reflectivity is inferred from a climatology developed using OMI reflectance measurements [Kleipool et al., 2008]. The effect of clouds is modeled using the cloud radiance fraction and the effective cloud pressure taken from an independent OMI level 2 product [Acarreta et al., 2004]. The NO2 profile shape is selected from a monthly geographical climatology constructed from 4 years' simulations using the Global Modeling Initiative (GMI at 2°× 2.5° latitude‐longitude spatial resolution) chemistry and transport model [Strahan et al., 2007]. The stratospheric and tropospheric components are then separated following the method described by Bucsela et al. [2013].
In the following discussion, we apply the revised fitting algorithm (we call it Goddard SCD hereafter) to a representative sample of OMI L1B (calibrated radiances) data, convert the resulting SCDs into VCDs using the above‐mentioned procedure and compare the new estimates to the operationally produced (referred to as DOMINO V2 SCD) SCDs and VCDs.
3. The Proposed Sequential SCD Fitting Algorithm
While the currently implemented, operational algorithm simultaneously fits the ring pseudoabsorption spectrum, three absorbing chemical species, and up to six polynomial coefficients to the spectral reflectances, the proposed algorithm takes a step‐by‐step approach that we describe in this section. One of the advantages of the proposed approach is in its sequential, iterative parameter estimation, done in an order determined by the relative sizes of the spectral signatures. This potentially mitigates spurious dependencies, which could show up as correlations between the retrieved parameters. Such putative nonorthogonality of basis functions is recognized as a source of error in least squares parameter estimation [Anand et al., 2015]. Since these spurious dependencies could be, among other reasons, caused by presence of a structured instrumental noise, we pay specific attention to the procedures helping to reduce, if not altogether eliminate, the sources of such noise. In particular, we introduce an iterative, flexible wavelength adjustment procedure, as well as multistep correction of the noisy measurements, with a particular attention to the structured noise. Optimizing the approach, we use the fitting residuals as the most sensitive diagnostic. Any successful (i.e., robust and unbiased) SCD retrieval, performed either with a “conventional” DOAS algorithm, or under the proposed sequential DOAS approach, directly depends on a full account and optimal elimination of the interfering instrumental noise.
A flowchart of the proposed procedure is shown in Figure 1, while Table 1 compares some of the salient differences between the two algorithms. In the following section we only outline the major steps of the algorithm: the wavelength correction, the ring spectrum evaluation, and, finally, the sequential retrieval of the trace gas SCDs and evaluation of the SCD errors. The technical details and numerous performance evaluations are presented in the Appendix. In particular, in the Appendix we demonstrate the advantages of the flexible, multiwindow wavelength adjustment and discuss the benefits of the sequential SCD retrieval. We also provide the details of removal of the instrumental noise and calculations of the fixed‐pattern spectral residuals, finally comparing the algorithm's performance to the various metrics produced by an independent algorithm.
Figure 1.
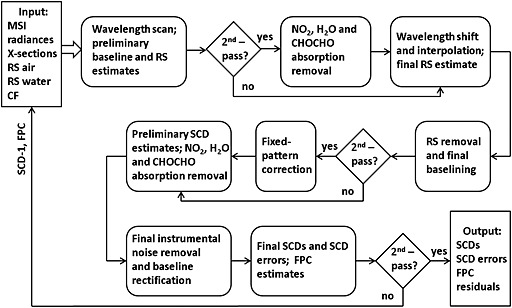
In the Input block we list the monthly mean solar irradiances (MSI), the radiances (wavelength, line‐of‐sight (row) and position (along‐orbit) dependent), the laboratory cross sections of NO2, H2O, and CHOCHO (X sections), the atmospheric (RS air) and liquid water (RS water) ring spectra convolved with the OMI slit function, the cloud fraction (CF) estimates provided by an independent retrieval from OMI observations. The preliminary estimates of the NO2, H2O and CHOCHO slant column densities (SCD‐1), as well as the spectral fixed‐pattern corrections (FPC) are used as additional input during the second‐pass SCD retrieval. RS denotes the amplitudes of the combined air and water ring spectrum.
Table 1.
The Operational (DOMINO V2) and the Proposed (Goddard) SCD Fitting Parameters
| DOMINO V2a | Goddard | |
|---|---|---|
| Wavelength range (nm) | 405–465 | 402–465 |
| Degree of polynomial | 5, full spectral range | 2 in 7 microwindows: (402‐410),(409‐418), |
| (415–425), (424–434), (433–444), (438–453), and (451–465) | ||
| Solar spectrum | convolved high‐resolutionb | monthly averages of OMI irradiances |
| Retrieved SCDs | NO2, H2O, O3 | NO2, H2O, and CHOCHO |
| Ring spectral reference | air, single scattering | air + water, multiscattering |
| NO2 reference spectrum | T = 220 Kc | T = 220 Kc |
| H2O reference spectrum | HITRAN‐2004 | HITRAN‐2008 |
3.1. Simultaneous Wavelength Adjustment and Ring Pattern Removal: The Microwindow Approach
In order to produce reflectances used in the SCD retrieval algorithm, we create monthly averages from the original daily OMI solar irradiance observations, thus striking a reasonable compromise between the high S/N required of the reflectances (individual daily solar records lack such S/N) and the dynamics of instrumental changes, mainly seen as gradual, long‐term wavelength shifts, as well as wavelength‐dependent changes in the OMI throughput [Marchenko and DeLand, 2014].
We choose the 402–465 nm spectral range for the NO2 retrieval, taking into consideration the strength of the NO2 spectral features. The wavelength range is limited on one end by the strong Solar CaII lines at wavelengths below 400 nm, and the broad, relatively intense O2‐O2 atmospheric absorption at 477 nm. Numerical simulations showed that the retrieved SCD(NO2) change by less than 5% with changes up to 10 nm in the placement of the retrieval window.
The earthshine radiance wavelengths are affected by instrumental thermal effects, as well as inhomogeneous illumination of the slit due to clouds. These effects can lead to pixel‐dependent wavelength shifts in the individual radiance spectra. This pixel dependence implies both the FOV‐sensitive wavelength shifts (clouds), as well as orbital changes in the prescribed wavelength grid for any particular FOV (mostly, thermal flexures, plus, to a far lesser extent, stray light). In the following procedure, we use the ring effect signatures on the measured radiances to estimate the relative wavelength offsets between the (monthly averaged) solar irradiance and the instantaneous earthshine radiance. This proves to be advantageous over the direct use of irradiances as a wavelength calibrator. In the particular OMI case, the ring spectrum may provide relatively better defined, high‐contrast, numerous spectral details, thus augmenting the method's sensitivity to the very small (∼0.01 pixel) wavelength shifts routinely recovered by the proposed approach. This is especially true for the critically important region around 420–440 nm, populated by prominent NO2 features. Moreover, since the RS amplitudes must be assessed and removed from the radiances, the use of the RS spectrum instead of irradiances allows us to combine the evaluation of the RS amplitudes and the inherently interrelated estimates of the wavelength shifts into a single iterative process. As the ring signal in the reflectances is easily an order of magnitude larger than the trace gas signal, any attempt to fit both the ring and trace gas SCD (as is done in the DOMINO V2 SCD fit) may introduce uncontrollable biases into the latter (see Appendices A1 and A3 for additional tests). Hence, it is desirable to remove ring signal prior to the SCD evaluation.
Our testing results conform to the conclusions of van Geffen et al. [2014], showing high sensitivity of the fitting residuals, as well as the retrieved SCDs, to the relatively small, ∼0.002 nm wavelength shifts (cf. OMI's ∼0.2 nm spectral sampling in the VIS channel), thus highlighting importance of the very accurate wavelength adjustments. To achieve such accuracy, we subdivide the NO2 fitting window into seven overlapping “microwindows” of various widths, from 8 to 15 nm. The microwindows enable flexible adjustments of wavelength‐dependent shifts between the radiance and irradiance spectra. More importantly, the use of overlapping, relatively short microwindows leads to robust evaluation of the RS amplitudes.
We determine the radiance‐irradiance wavelength shift in each microwindow, minimizing the spectral residuals with respect to the two parameters: the relative wavelength shift and RS amplitude. In the process of simultaneous evaluation of the wavelength shifts and the RS amplitudes, the low‐order polynomial (usually, n = 2) is used to adjust the reflectance so that the integral of the residual reflectance, over the spectral window, is unity. This is critical to avoiding errors in the subsequent trace gas fitting steps. That is, for subsequent steps in the algorithm, the reflectances are normalized to a wavelength‐dependent reference level. Hereafter we define the procedure of normalizing the reflectances to polynomials as “baselining”.
Once an optimal wavelength shift is found for each of the seven microwindows, the ring amplitudes are estimated one more time, checked for negative values and smoothed with a running mean (n = 3) filter. The ring patterns are removed, and in each microwindow the ring‐free reflectances are iteratively refitted with low‐order polynomials, n = 2. This iterative process provides a spectral reference level (“baseline”) that is very stable (usually to <0.01%) for the subsequent SCD retrieval.
3.2. The Iterative SCD Retrieval
The 402–465 nm wavelength window contains a highly structured NO2 absorption feature that is well suited to the retrieval of SCD(NO2). However, it also contains a relatively strong H2O absorption complex at 440–450 nm, and a generally much weaker glyoxal (CHOCHO) signal. The edges of absorption bands of O3 (>450 nm) and O2‐O2 (around 447 nm) also encroach on the window. However, they are relatively broad and featureless (considering the spectral span of the microwindows; this especially applies to O2‐O2), and they are effectively removed from the reflectances by the final baselining step of the microwindow approach described in the previous section. The same applies to the liquid water absorption feature [Peters et al., 2014].
We use the laboratory‐measured, high‐resolution, fixed‐temperature spectra for NO2 (T = 220 K) [Vandaele et al., 1998], H2O vapor (T = 280 K: produced by HITRAN08) [see Rothman et al., 2009], and CHOCHO (T = 296 K) [Volkamer et al., 2005]. These were convolved with wavelength‐ and row‐dependent slit functions appropriate to the OMI VIS channel [Dirksen et al., 2006]. There is no evidence for either long‐term secular changes or along‐orbit changes in the OMI slit function; hence, we apply the same set of the slit‐convolved reference spectra to all the available OMI data. We preserve the original wavelengths grids of the slit function‐convolved laboratory spectra, even if they far exceed the OMI wavelength sampling rate. This helps to reduce the inevitable errors introduced during the wavelength interpolation. Comparison of the implemented NO2 cross sections and those currently used by DOMINO V2 shows some relatively small deviations that could not cause the ∼30% SCD differences in the Goddard and DOMINO V2 SCD retrievals.
At OMI's spectral resolution, the highly structured absorption spectra of the trace gases are convolved with the relatively broad slit function. In general, this could result in significant nonorthogonality between the cross‐section functions. During a simultaneous retrieval of multiple SCDs, it is not possible to ensure that there is no mutual interference. For that reason, we elect to use a sequential, iterative approach that accounts for the trace gas features in turn.
The iterative Goddard SCD retrieval proceeds as follows: First of all, note that during the SCD evaluation we abandon the microwindow approach, since it completely served its purpose during the initial wavelength correction and baselining. Hence, we estimate SCD(NO2) using the normalized (baselined) reflectances in a truncated window (402–452 nm), excluding the 441.5–444 nm range (the strongest H2O absorption). We remove the NO2 signal from the reflectance at all wavelengths, and then estimate the H2O SCD using the reflectances in 440–449 nm. Finally, we estimate the CHOCHO SCD using the relatively short 433–459 nm window, centered on the most pronounced CHOCHO absorption features. All SCDs are independently evaluated by two algorithms (the multidimensional minimization Nelder‐Mead method and the nonlinear least squares Levenberg‐Marquardt fit; both described in Press et al. [1992]), with reflectances either in a linear (for the latter) or logarithmic form (for the former fit), and with the outcome cross checked for consistency. We use the SCDs estimates provided by the Levenberg‐Marquardt approach, unless this results in the unphysical, negative SCDs, in contrast to the positive SCDs from the Nelder‐Mead method. In such cases we revert to the latter. If both solutions turn negative, we provide their average and flag the result.
Applying the preliminary SCD estimates, we remove the trace gas absorptions from the normalized (“baselined”) reflectances which, at this point, could be regarded as fitting residuals; i.e., they should adhere to the baseline = 1.0. Using progressively tighter thresholds, initially set at ±5σ, we iteratively identify the low‐amplitude (<1%) instrumental noise and correct the corresponding pixels in the original, trace gas affected reflectances. These noise‐corrected reflectances are then subjected, one more time, to the SCD fitting, now using practically the whole 402–465 nm region for the final NO2 retrieval, minus the H2O active region 441.5–444.0 nm. The significantly broader NO2 window provides, on average, more stable solutions for the low‐value SCD(NO2).
After the second SCD evaluation, all the trace gas features are removed, once again, from the reflectances, and the resulting fitting residuals are evaluated for the presence of stable spectral patterns that arise primarily from undersampling (see more details in Chance et al. [2005]) of the OMI solar spectra. These patterns are averaged over large blocks of up to 250 consecutive orbital exposures. The fixed‐pattern correction is then applied to the radiances, and the iterative SCD retrieval process is repeated one more time (the “second pass” in Figure 1), now using the fixed‐pattern‐corrected radiances. The first‐pass SCD estimates are also used to rectify the reflectances prior to the second‐pass wavelength adjustment and ring spectrum removal procedure. After that, the final SCD estimates are computed.
3.3. SCD Errors
In the process of SCD retrieval the reflectances are cleaned of instrumental noise and finally adjusted for the fixed‐residual patterns. Removing, at the very last step, the spectral features of the trace gases from the reflectances, we find that the distribution of final fitting residuals is nearly normal (section A6). This allows us to calculate the SCD uncertainties from the shape of the χ 2 surface around the optimal SCD solution following the recipe from Press et al. [1992]. Because the fitting procedure disentangles the large‐amplitude rotational Raman patterns from the trace gas absorption features and implements a flexible estimation of wavelength shifts, the SCD uncertainties are determined with relatively small contamination from these effects, leading to considerably smaller SCD errors (see below).
4. Results and Discussion
To demonstrate the performance of the revised algorithm, we first analyze the NO2 retrievals produced by the DOMINO V2 and Goddard SCD algorithms, and then compare the new OMI NO2 retrievals with the time‐adjusted SCIAMACHY observations and NO2 simulation from the GMI CTM. To illustrate seasonal and latitudinal dependencies, the discussion focuses on four sets of SCD(NO2), centered on the solstices and equinoxes in 2005.
4.1. Comparison of the Operational DOMINO V2 and New Goddard SCDs
Below we show that the new Goddard‐retrieved NO2 columns are substantially reduced compared to the current, operational SCD estimates, and in better agreement with independent measurements and models. We attribute the larger values produced by the DOMINO V2 SCD fitting to a combination of factors: the wavelength adjustment based on a single wavelength shift assumed to apply over the entire wavelength range; the interference between the dominant ring spectrum patterns and the far weaker trace gas absorptions; and biases introduced by the high‐order polynomial fitting of the reflectances (see tests in the Appendices A1, and A3).
Figure 2 shows a single orbit #03610 from 20 March 2005. This particular orbit encompasses the highly contaminated suburbs of Beijing as well as relatively unpolluted open ocean regions. In general, over unpolluted regions the DOMINO V2 SCD algorithm produces substantially higher SCDs than does the Goddard SCD retrieval, which is consistent with the earlier conclusions by Krotkov et al. [2012] and Belmonte Rivas et al. [2014]. The Goddard − DOMINO V2 difference is smaller in polluted areas and larger in clean areas. The data from orbit 03610 are also presented, as a scatterplot, in Figure 3 (left), color coded according to the cloud radiance fraction (CRF). For relatively cloud‐free scenes (CRF < 0.5), it is apparent that the difference in the algorithms results primarily in an additive SCD shift, with some multiplicative effect. In cloudy circumstances (CRF > 0.5), the data are much more scattered. This is likely due to less precise SCD determination by either or both algorithms when clouds are present. For example, in the partially clouded FOVs the spatially inhomogeneous illumination of the Earth‐viewing aperture causes substantial wavelength shifts, which might not be accurately enough (i.e., ≲0.002 nm) estimated by the preprocessing algorithms. Either one or both of the SCD retrieval approaches may not fully apply the necessary additional wavelength corrections in such complex cases. This may result in less stable retrievals. One more factor may lead to the seemingly more robust DOMINO V2 SCD estimates. Specifically, we note the high correlation of the low‐value DOMINO V2 SCD NO2 retrievals and the ring‐scale estimates (section A3). Such interference presumably “stabilizes” the retrievals, artificially lessening the scatter, especially for the retrievals with the lowest SCDs. On the other hand, the DOMINO V2 shows systematically larger fitting residuals compared to the Goddard approach (the latter either with or without the fixed‐residual patterns), once we convert and scale the Goddard fitting residuals to the “root‐mean‐square error of fit” values provided by the DOMINO V2 output.
Figure 2.
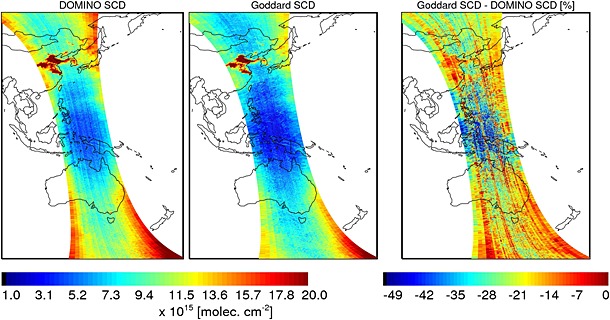
(left) SCD(NO2) from the DOMINO V2 SCD, (middle) Goddard SCD retrievals, and (right) their relative differences: OMI orbit #03610 from 20 March 2005.
Figure 3.
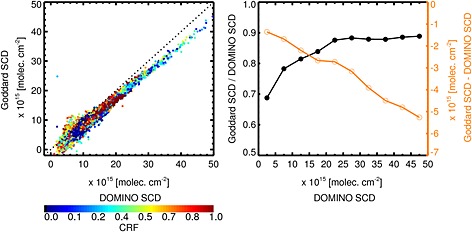
(left) DOMINO V2 and Goddard SCD(NO2) retrievals for different cloud conditions: OMI orbit #03610 from 20 March 2005. (right) The (Goddard/DOMINO V2) ratios (black line) and (Goddard − DOMINO V2) differences (orange line).
There is another important aspect of the Goddard − DOMINO V2 difference. Figure 3 (right) clearly demonstrates that the difference cannot be treated as being SCD invariant. Converting the SCDs from Figure 3 to VCDs with AMFstrat, we find (not shown) that, in the low‐VCD (<4 × 10¹⁵ mol cm−2) domain explored in detail by van Geffen et al. [2014], the average offset comes close to −0.85 × 10¹⁵ mol cm−2, the value quoted by van Geffen et al. [2014], however, with a definite VCD‐dependent slope. Such offset reaches −1.5 × 10¹⁵ mol cm−2 for VCD>1016 mol cm−2. This suggests an interplay between some additive and multiplicative factors responsible for the SCD difference.
4.2. Striping
Since first light, Level‐2 OMI data products have been bedeviled by “striping,” where there are row‐to‐row mean biases that change from orbit to orbit. Such stripes are evident in Figure 2 (left; DOMINO V2 SCD). Figure 2 (middle; Goddard SCD) shows much smaller amplitudes of striping. Figure 2 (right; Goddard SCD − DOMINO V2 SCD) shows the magnitude and persistence of this effect on individual cross‐track rows along an orbit. Figure 4 summarizes, for the same data set (orbit 03610), the magnitude of the striping, computed as described in Bucsela et al. [2013]. While there is still some striping in the Goddard SCDs, it is much less pronounced than that found in the DOMINO V2 SCDs. In subsequent processing, to estimate the VCDs, we remove the stripes from SCDs applying the approach from Bucsela et al. [2013].
Figure 4.
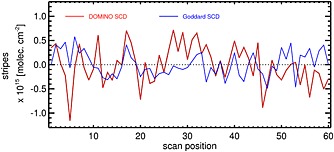
Striping amplitude in the DOMINO V2 and Goddard NO2 retrievals: OMI orbit #03610 from 20 March 2005.
4.3. Impact on Stratospheric and Tropospheric NO2 VCDs
In Figure 5, we compare OMI SCD(NO2) retrieved by the DOMINO V2 SCD and Goddard SCD algorithms over the entire globe on 20 March 2005. The features seen in the single‐orbit data are also evident in the global coverage: Compared to the DOMINO V2 SCD algorithm, the Goddard retrievals are consistently lower, by ∼10–40%, and are less affected by striping. The diminished striping and, more importantly, the smaller Goddard SCD fitting residuals should reduce the SCD errors and, consequently, the errors in the stratospheric and tropospheric NO2 columns. Figure 6 shows that the SCD(NO2) errors produced by the Goddard algorithm are significantly smaller than those produced by the DOMINO V2 algorithm, by ∼15–20%, even if we additionally account for the systematically smaller Goddard SCDs (Figure 3). It is also clear that the relative difference is a function of the SCD itself. The Goddard SCD errors in the high‐SCD areas (either polluted or observed at large solar zenith angles) do not exceed 5–7%, while the low‐SCD values (equatorial regions of oceans) bear substantially higher relative uncertainties, typically around 15–20%.
Figure 5.
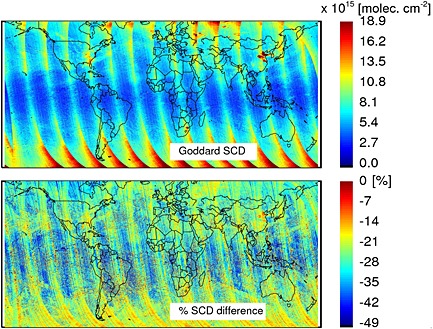
Daily, 20 March 2005 SCD(NO2) retrievals (top) for the Goddard algorithm, (bottom) with the relative difference, (Goddard − DOMINO)/D O M I N O.
Figure 6.
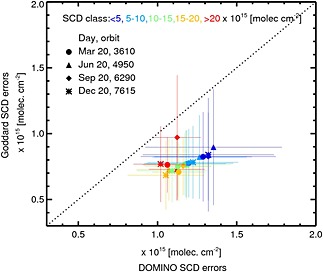
SCD(NO2) errors for different SCDs (color coded: see the figure legend) and different months, with ±σ bars, to show the spread of the values.
To quantify how the observed SCD differences affect the derived stratospheric and tropospheric NO2 columns, we applied the operational OMI NO2 SCD‐VCD conversion algorithm [Bucsela et al., 2013; Lamsal et al., 2014] to both Goddard and DOMINO V2 SCDs. The algorithm calculates AMF and AMF errors, then generates VCDs from SCDs using a stratosphere‐troposphere separation scheme. Figures 7 and 8 show the comparison of stratospheric and tropospheric NO2 columns for 20 March 2005. As expected, the Goddard SCD retrievals yield consistently lower (∼30–40%) stratospheric NO2 columns in the tropics, with slightly less pronounced (∼20%) differences at high latitudes. These results agree with the findings of Krotkov et al. [2012] and Belmonte Rivas et al. [2014]. Since the stratosphere‐troposphere separation scheme uses NO2 observations from unpolluted and cloudy areas to estimate the stratospheric NO2 fields, the absolute differences in VCDtrop over those areas are expected to be small, as anticipated in Belmonte Rivas et al. [2014]. In the polluted regions, however, where VCDtrop constitutes a substantial fraction of the total NO2 column, the large change of SCDs also affects the tropospheric column NO2 retrievals, though these revisions look relatively smaller (Figure 9). Figure 10 explores the putative seasonal changes produced by the initial Goddard SCD‐DOMINO V2 SCD SCD biases. Predictably, both the VCDstrat and VCDtrop differences behave in a manner already revealed in Figures 7 and 8.
Figure 7.
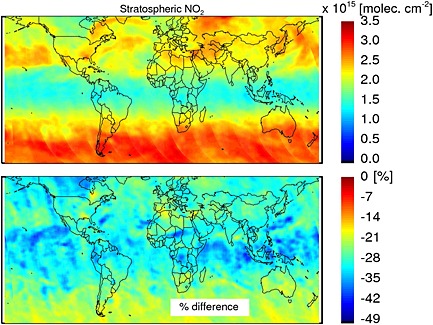
(top) Stratospheric VCD(NO2) estimated from Goddard SCD(NO2) for 20 March 2005. (bottom) The relative difference, (Goddard − DOMINO)/DOMINO.
Figure 8.
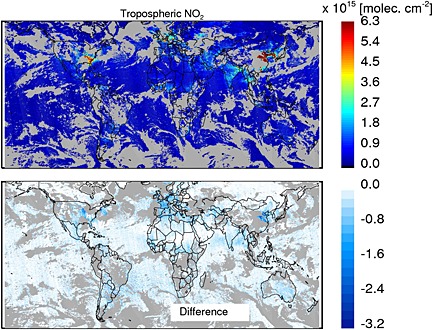
(top) Tropospheric VCD(NO2) derived from Goddard SCD(NO2) for 20 March 2005. (bottom) The absolute difference: Goddard − DOMINO. The gray color represents cloudy areas with CRF > 50.
Figure 9.
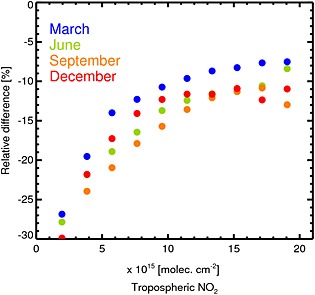
Binned relative differences, (Goddard − DOMINO)/DOMINO, of the tropospheric NO2 columns derived from the DOMINO V2 and Goddard SCDs, for 20 of March (blue), June (green), September (orange), and December (red). The shown data have Vtrop>1015 mol cm−2 for the relatively low cloud coverage, CRF < 50%.
Figure 10.
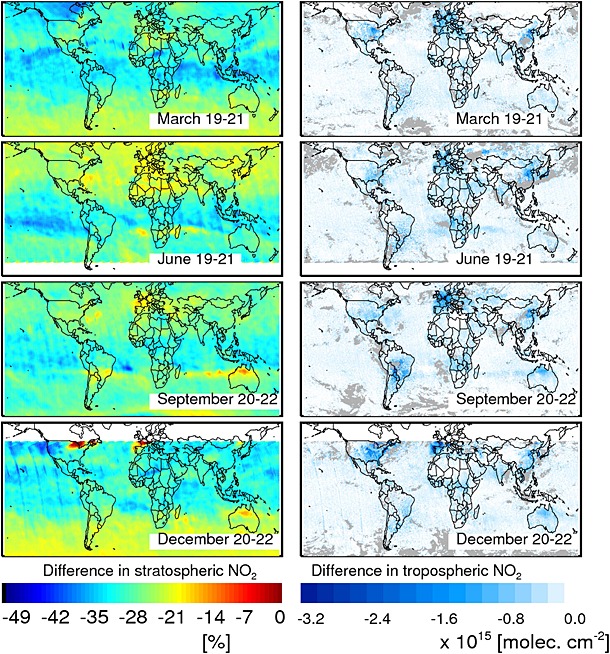
Three day average differences (Goddard − DOMINO) binned at 0.25°×0.25° for the (left column) stratospheric and (right column) tropospheric VCD(NO2) for four representative months of the year 2005. The gray color in the right panel marks the cloudy areas (CRF > 50%).
4.4. Comparison to SCIAMACHY and Global Modeling Initiative Model
For evaluation with independent observations and a model, OMI data were compared with the total NO2 VCDs from SCIAMACHY [Bovensmann et al., 1999] nadir measurements and the German Aerospace Center (DLR) retrievals (version 5.02) [Lichtenberg et al., 2010] in Figure 11. We also compare the OMI data with NO2 simulated with the Global Modeling Initiative (GMI) CTM [Duncan et al., 2007; Strahan et al., 2007]. The GMI model incorporates a detailed chemical mechanism in the stratosphere [Douglass et al., 2004] and troposphere (based on the Harvard GEOS‐Chem model [Bey et al., 2001]) and includes up‐to‐date emissions, deposition, radiation, advection, and other important physical processes.
Figure 11.
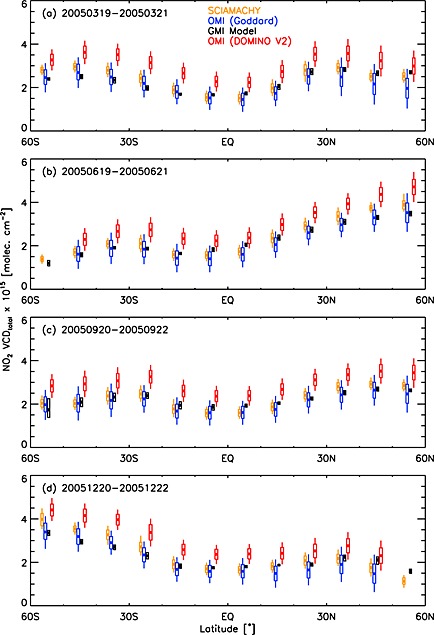
Seasonal comparison of NO2 Pacific zonal mean (180°W–140°W) total VCDs over 3 day periods in March, June, September, and December 2005, as indicated. Model output from the GMI model and data from three nadir retrievals are shown: SCIAMACHY (DLR nadir), OMI (DOMINO V2 SCD fitting), and OMI (Goddard SCD fitting). The model was sampled at 13:30, and the satellite data were corrected to 13:30 local solar time. Dots mark the mean VCD values, the boxes delimit the interquartile (25%, 75%) ranges and medians, and the whiskers (for the satellite data) show the 10%–90% ranges. The boxes are shifted slightly horizontally for clarity.
4.4.
Stratospheric NO2 displays a well‐established diurnal variation, manifesting as a linear increase in NO2 during daylight hours [e.g., Bracher et al., 2005], with a similar effect in the total VCD over relatively unpolluted regions. In the following comparisons, we sampled the model at 13:30 time and used the normalized diurnal variation of NO2 in the GMI model to correct or adjust the OMI and SCIAMACHY data to 13:30. This allowed for comparison under similar photochemical conditions. In Figure 11 we plot the NO2 zonal means in 10° latitudinal bands sampled over the practically unpolluted Pacific Ocean regions (longitudes 180°W–140°W). We compare the total VCDs from 3 day periods in March, June, September, and December 2005. We show the GMI model output (sampled at 13:30, local solar time) along with the data from three independent retrievals: SCIAMACHY, OMI (DOMINO V2 SCD fitting), and OMI (Goddard SCD fitting). The OMI data were restricted to solar zenith angles below 85°, and radiative cloud fractions below 0.5. The substantially broader cross‐track spatial coverage of OMI was reduced to match the SCIAMACHY field of regard. The new VCD(Goddard SCD ) values are significantly lower and closely match both the model and SCIAMACHY averages. This is consistent with the works of Krotkov et al. [2012], Belmonte Rivas et al. [2014], and van Geffen et al. [2014]. The noticeably smaller spread of SCIAMACHY VCDs within latitude/month bins in Figure 11 could be due in part to SCIAMACHY's larger‐ground FOVs, which effectively averages out geophysical variability resolved by OMI. The inherent noise of SCIAMACHY measurements is also reduced by its comparatively higher signal‐to‐noise ratio.
4.5. Method Limitations
The problem of atmospheric trace gas retrievals from hyperspectral measurements presents many challenges to algorithm development. Some of these arise from the performance of the instrument. Those include various noise processes, uncertainties in the slit function characterization, stray light, wavelength shifts, and spectral undersampling. The trace gas SCDs are retrieved from reflectances, hence being exposed to inherent differences in the instrumental performance of the irradiance and radiance channels. Other difficulties are related to both uncertainties in the laboratory measurements and the dependence of monochromatic absorption cross sections on temperature, and, sometimes, pressure. Finally, there are challenges associated with constructing the SCD retrieval algorithm: atmospheric absorption is inherently nonlinear, and the spectral absorption cross sections, which serve as basis functions in the fitting procedure, are generally not mutually orthogonal; this gives rise to inaccuracies in the retrieved columns and spurious correlations between the retrieved SCDs of different species. Furthermore, the large disparity in the optical depths of different absorbers can lead to numerical stability issues when the absorbers are retrieved simultaneously in a multidimensional fitting algorithm. Some of these issues are generic, while others are closely tied to the performance of the particular instrument.
In the proposed optimized NO2 retrieval, we have sought to overcome many of the challenges just described. For example, we use a monthly median solar irradiance spectrum, which suppresses the instrumental noise in the daily OMI irradiances, and tracks with the real, physical spectral output of the Sun. We carefully register the wavelengths of the irradiance and radiance spectra. We do this in seven microwindows, which allows us to compensate for the wavelength‐dependent shifts between the wavelength grids of radiances and irradiances. We identify transient spikes—for example, those characteristic of cosmic ray signals—and remove them from the data. And we sequentially fit the spectral reflectances in order to overcome the problem of nonortnogonality of the basis functions of the three retrieved species (NO2, H2O, and CHOCHO), as well as of the RS. As a result of the sum of these measures, the reflectance residuals appear devoid of any coherent structures that would indicate either residuals of unretrieved species, or mutual interference between basis functions. The reflectance residuals are also normally distributed, to a very good approximation.
Nevertheless, it is possible that situations may arise in which the method's accuracy is compromised. For example, under conditions of very large absorber optical depth, their deeper spectral structures in the reflectances may be mistaken for noise and subjected to modification by one of the noise‐attenuating steps. This would result in a bias in the retrieved absorber column. When that biased absorber's spectral signature is subsequently removed from the reflectances, its residuals may alias into one of the other retrieved absorbers. At best, this event would lead to an anomalously large estimated uncertainty.
Though the removal of residual, along‐track coherent spectral patterns accounts for undersampling, it may not do so completely. No special undersampling correction is made beyond this, so it is possible that some signature of undersampling yet remains.
While the microwindows are optimized to take advantage of the structure in the RS, it is true that there is less such structure in some windows than in others. Thus, the wavelength offset may not be uniformly well determined in each of the windows. The process we use for merging the wavelength offsets between adjacent windows goes some way to stabilizing the solution to account for this. Still, there remains a possibility that inhomogeneities in the determination of the wavelength offset remain.
Our wavelength registration method, and, in particular, the selection of the microwindow boundaries, relies on a distinctively structured RS in the wavelength region where our target absorber has a favorable absorption band. In addition, in most cases, the effect of the RS is much larger than the optical depth of the absorber. To apply the overall algorithm to other atmospheric species, the wavelength registration step may need to be adapted to the situation in hand.
The gains provided by the flexible wavelength adjustment and sequential SCD retrieval could be offset, under specific circumstances, by the extremely high sensitivity of the SCD retrievals to the imposed wavelength shifts. This particularly applies to low‐SCD values coming from the unpolluted equatorial regions, as well as the areas with relatively higher SCDs, e.g., at the high northern latitudes in the equinox samples from Figure 11. In both cases the spread is mainly driven by the data coming from the partially clouded scenes. Such conditions may cause substantial wavelength shifts (see Voors et al. [2006] for more details). Could it be that the proposed algorithm results in less stable retrievals for the extreme cases of the inhomogeneous slit illumination? Such possibility prompts further targeted testing. However, this particular issue may affect the reported OMI results in a minor way, as only the data from almost cloud‐free areas (routinely, CF < 0.2–0.3) are used in the NO2 surveys.
5. Conclusions
The SCD retrieval approach redesigned and optimized for orbital OMI performance provides 10%–35% smaller SCD(NO2) estimates than the current operational DOMINO V2 algorithm. The new approach also results in less prominent striping and lower SCD errors. The ∼30% difference in SCD(NO2) leads to a similar‐magnitude decrease of the stratospheric VCD(NO2). We also see systematically reduced VCDtrop in the heavily polluted areas, by ∼10–15%. Less polluted regions show ∼20–30% decrease in VCDtrop.
Though the proposed algorithm was optimized for the NO2 retrieval in the 402–465 nm spectral range easily accessible in the OMI data, we have also been able to extend the approach to the NO2 spectral features in the 350–380 nm region and produce preliminary SCD(NO2) estimates. This spectral range is sampled by the Ozone Mapping Profiler Suite Nadir Mapper, flying on board the Suomi National Polar‐orbiting Partnership (NPP) satellite.
Acknowledgments
We thank A. Richter for kindly providing us with the preliminary SCD(NO2) fitting results for the OMI orbits #03610 and #03622 (both from 20 March 2005). The OMI OMNO2 data used in this analysis are publicly available at http://disc.sci.gsfc.nasa.gov/Aura/data-holdings/OMI, and the DOMINO product is available at http://www.temis.nl. The SCIAMACHY data were obtained from the Aura Validation Data Center, http://avdc.gsfc.nasa.gov. This work was supported by NASA's Earth Science Division through an Aura science team grant. The Dutch‐ and Finnish‐built OMI instrument is part of the NASA EOS Aura satellite payload. The OMI instrument is managed by KNMI and the Netherlands Agency for Aerospace Programs. We wish to thank the referees for their constructive, helpful criticism.
Appendix A. Additional Technical Details and Performance Evaluation
A.1.
In the following technical discussion, for illustrative purposes we mostly use the spectral fits from OMI orbit #03610 (20 March 2005). This particular orbit samples both the highly contaminated areas of eastern China, as well as practically uncontaminated regions of the equatorial Pacific and Australia (Figure 2).
A1. Benefits of the Microwindow Approach
The number, as well as the widths, locations. and spectral overlaps (Table 1 and Figure A1) of the individual microwindows were chosen to minimize the fitting residuals. Once chosen, we fixed them for all subsequent work. We define the limits of the seven microwindows as follows: 402–410, 409–418, 415–425, 424–434, 433–444, 438–453, and 451–465 nm. The wavelength ranges, as well as breadths of spectral overlaps are dictated primarily by the ring spectral patterns, as well as the appearance of the NO2 and H2O absorption features. In particular, we avoid placing the microwindow's ends on any prominent spectral features (Figure A1). The window overlaps provide a means of stabilizing the polynomial fitting of the reflectances (see below).
Figure A1.
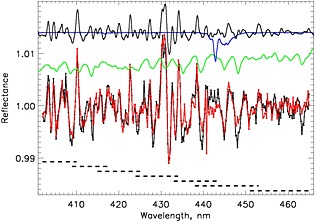
Normalized reflectances from the OMI exposure (20 March 2005, orbit #03610) passing over the Beijing suburbs (row #10, black line) and the open water region (row #51, red line). The arbitrarily shifted and scaled reference ring spectrum (black), NO2 (green), and H2O (blue) cross sections are plotted above the normalized reflectances. The NO2 and H2O cross sections are negated as an aid to visually recognizing the corresponding absorption details in the reflectances. The dashed lines show the wavelength spans of the microwindows.
In order to estimate the wavelength‐dependent shifts between the wavelength grids of radiances and irradiances within each microwindow, we loop through candidate wavelength shifts in the monthly averaged irradiances. At each wavelength shift we produce reflectances and estimate the RS amplitudes. Evaluation of the gradual (orbital) shifts, as well as occasional wavelength excursions of the OMI radiances shows that introduction of the ±0.03 nm shift‐sampling range with 0.003 nm increments is quite adequate for the wavelength adjustment task. At each wavelength step we evaluate ring pattern amplitudes after iterative fitting and normalization of the reflectances with low‐order polynomials, n≤2. To accommodate the growing O3 absorption, at large solar zenith angles (S Z A > 85°) we increase the polynomial order to 4 in the 450–465 nm range. Such iterative refitting is aimed at providing a stable (to ∼0.01%) spectral reference level (the baseline).
A1.1. The Flexibility: Wavelength Shifts and Baselining
The microwindow approach provides maximum flexibility during the wavelength adjustment. The traditionally exploited “shift‐and‐squeeze” approach may prove inadequate for an instrument with flexures caused by fairly rapid orbital changes of the spacecraft's temperature. Indeed, this seems to be the case for OMI. In Figure A2 we plot the averaged (along the orbit #03610, in blocks of 400 orbital exposures) wavelength differences between the radiances and the monthly mean average irradiance spectrum used to produce reflectances. Since the solar spectra are taken around the north‐pole terminator, one may expect the absolute wavelength adjustments to be smaller for the late‐orbit spectra. Our numerical simulations show that for OMI the retrieved SCDs are highly sensitive to the wavelength shifts exceeding ∼0.002 nm. This particular sensitivity threshold was also noted by van Geffen et al. [2014]. There is no guarantee that the traditionally implemented shift‐and‐squeeze approach will result in better than ∼0.002 nm wavelength correction. Indeed, the estimated wavelength shifts routinely show deviations from a linear trend exceeding 0.002 nm (Figure A2), which justifies the use of microwindows.
Figure A2.

The average wavelength adjustments for the row #60 (the farthest off‐nadir FOV) and row #31 (close to nadir). Black lines follow the average corrections for orbital exposures 200–599; blue: exposures 600–999; and red: exposures 1000–1399 of the test orbit #03610. The ±1σ bars characterize the spread within the orbital blocks.
When adjusting the wavelength shifts, we always resample the reference irradiance spectra onto the wavelength grids of the far more structured earthshine radiances, in order to minimize interpolation biases.
During the final adjustments of the wavelength grids, we do not smooth the seven individual microwindow shifts, save some editing of rare deviations exceeding quite generous tolerances. Nevertheless, the estimated wavelength corrections show rather smooth trends throughout the orbit. Moreover, they are highly correlated: e.g., r = 0.74 between wavelength shifts from the first and last microwindows for the orbit #3610. In general, one would not expect well‐correlated wavelength shifts between widely separated wavelength regions due to the nature of the temperature‐induced flexures and the imposed operational wavelength registration applied to produce the calibrated radiances and irradiances. However, we do expect a greater correlation between the wavelength shifts in adjacent microwindows. Indeed, in such cases we find r≥0.95.
Since the ring spectral patterns dominate the appearance of a typical reflectance spectrum (see below), one should minimize any potential biases in estimates of the RS amplitudes, and ensure a robust determination of the spectral reference level (baseline) in the presence of a strong RS signal. Splitting the SCD retrieval wavelength range into multiple, overlapping regions achieves this goal much better than the traditional single‐window fitting with a high‐degree polynomial. To prove the point, we take a representative ring spectrum used to calibrate the OMI data for row #31, and fit it with either a fifth‐order polynomial (as in the currently implemented DOMINO V2 SCD retrievals) or with the second‐order polynomials in seven overlapping microwindows (Figure A3: for comparison, we also add the third‐order polynomial fit in the 425–450 nm window traditionally used for the GOME‐2 and SCIAMACHY retrievals). The microwindow splitting produces a match of better than 10−4 of the known spectral reference level, which is essential for unbiased NO2 retrieval. Hence, at least for the OMI data, the microwindow approach is a decisive improvement in baselining. To further improve the spectral referencing, in the regions of spectral overlaps we use wavelength‐weighted averages of the polynomials determined for the two overlapping microwindows.
Figure A3.
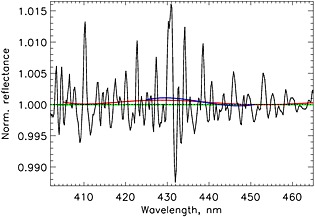
A representative pure‐air ring spectral pattern (black line) with the reference level marked by the dotted line. Green line shows the microwindow second‐order polynomial fits; red line follows the fifth‐order polynomial in the 405–465 nm window; and blue line corresponds to a third‐order polynomial fit in the 425–450 nm window.
A1.2. The Flexibility: RS Amplitudes
There is one more advantage of the microwindow approach, though seemingly less important from a standpoint of the potential impact on the robust and unbiased SCD retrievals. Though one may expect a single‐value RS amplitude (“scale”) in the relatively narrow OMI NO2 fitting window, in practice one must apply a more flexible approach, allowing for some wavelength dependence of the retrieved RS amplitudes. Our comprehensive modeling of the wavelength and orbital behavior of the OMI instrumental stray light shows that the current operational algorithm captures a majority of the stray light contamination, proving to be adequate for practically all scientific products derived from the OMI radiances. However, completeness of the stray light removal by the operational algorithm depends on wavelength, gradually diminishing toward the ends of the sensitivity range for the given OMI spectral channel (either UV1, UV2, or VIS, the latter being used for the NO2 retrieval) and also varying along the orbit. Such a slight but systematic undercompensation of the stray light may cause some wavelength dependence in the retrieved RS scales. Thus, it should be taken into consideration. Indeed, we note that the retrieved RS scales show a tendency to diminish toward longer wavelengths. In Figure A4 RS[1] corresponds to the first, 402–410 nm, microwindow, placed practically in the middle of the VIS channel sensitivity range; RS[7] comes from the seventh microwindow, 451–465 nm, which is placed closer to the long‐wavelength end of the VIS sensitivity range. In line with the expected instrumental trends, one may notice the slightly smaller RS[7] values, as well as the gradual convergence of RS[1] and RS[7] for progressively larger RS amplitudes, with lessening sensitivity to the quality of the stray light correction.
Figure A4.
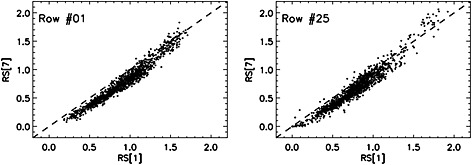
The ring spectrum scales, RS[1], obtained from the first microwindow, 402–410 nm, plotted versus RS[7] from the last wavelength window, 451–465 nm, for two rows: the off‐nadir row #01 and the near‐nadir row #25, for the test orbit #03610, 20 March 2005.
At the first step, we estimate RS amplitudes for all seven windows independently. Then, before the final removal of the ring structures, we check these seven values for obvious outliers (either negative or exceedingly large RS) and smooth the estimates with a running mean filter (n = 3). Overall, even the initial RS amplitudes from different microwindows show a high degree of correlation. For example, the initial RS[1] values shown in Figure A4 correlate with the completely independent initial RS[7], estimates with r = 0.88–0.94. The correlation improves to r = 0.95–0.98 in the final, smoothed RS data.
A1.3. The Single‐Window Emulation
To emulate the performance of the single‐window approach, we introduce the wavelength corrections provided by the 408–423 nm spectral window (as currently implemented in the operational DOMINO V2 SCD algorithm: van Geffen et al. [2014]) and use a single RS scale for the SCD retrieval. We compare the root‐mean‐square (RMS) of the single‐window fitting residuals to the RMS values provided by the multiwindow approach (Figure A5), averaging them over the 100 exposure blocks of data sampled along the test orbit #03610. The multiwindow approach shows consistently better performance over the entire orbit.
Figure A5.
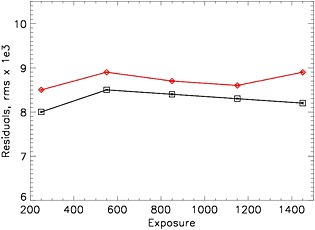
The average RMS (blocks of 100 orbital exposures, all FOVs (rows) included) of the fitting residuals for the single‐window approach are shown as red diamonds. Black line follows the multiwindow results (squares) for the test orbit #03610. The corresponding ±1σ errors of the mean values are smaller than the symbol sizes.
A2. The Combined Air and Liquid Water Ring Spectrum
Over land and coastal waters, a purely atmospheric ring spectrum [Cebula et al., 1995] is used. Over open water, a linear combination of atmospheric and liquid water (i.e., vibrational Raman scattering) [Vasilkov et al., 2002]) ring spectrum is constructed, weighted by the cloud fraction. Both the multiscattering air and water ring spectra were calculated (A. Vasilkov, private communication, 2013) from the high‐resolution solar reference spectrum [Chance and Kurucz, 2011] and then convolved with the wavelength‐ and row‐dependent OMI slit functions.
The introduction of the combined, pure‐air plus liquid water ring spectrum provides an additional, relatively small, yet expected, improvement in the fitting residuals. For testing we select the residuals coming from the clear‐sky (cloud fractions < 0.05), open ocean regions within orbit #03610 and calculate the RMS of residuals in 10 nm spectral intervals for the water + air and pure‐air cases. The overall improvements in the residuals are perceptible (Figure A6), but rather small, with the maximum effect corresponding to the spectral range with the most pronounced differences between the liquid water and the pure‐air ring spectral features, i.e., around 425–435 nm.
Figure A6.
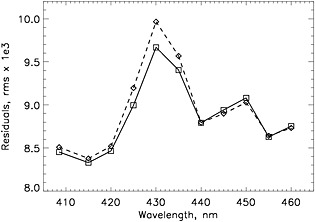
The average (over 10 nm spectral intervals) RMS of the fitting residuals for the combined (air + water) ring spectrum (full line) and the pure‐air RS (dashed line) for the orbit #03610, sampled over the open water (ocean), practically cloud‐free (cloud fraction <0.05) areas.
A3. Sequential Versus Simultaneous Ring Spectrum and NO2 SCD Retrieval
To highlight the point of dominance of the RS patterns over the rest of spectral absorption features, in Figure A1 we show the normalized reflectances for the suburban Beijing and the open ocean areas. The corresponding difference in the NO2 column densities is a factor of ∼3. Both scenes are almost cloud‐free, and since the geometric AMFs are comparable, the amplitudes of the ring spectrum patterns are comparable too. The spectral appearance is practically unaffected by the presence of very high and, moreover, variable NO2 signals, save in the region λ > 435 nm, where the ring spectrum is relatively unstructured.
Such spectral dominance of the RS component may lead to biases and uncontrollable correlations in the simultaneously retrieved SCDs, thus warranting a sequential RS and SCD retrieval. Furthermore, with decreasing spectral resolution the NO2 spectrum and ring spectrum are substantially broadened by an instrumental slit function (e.g., FWHM ∼ 0.6 nm for OMI). This results in a gradually increasing similarity in the general appearance and contrast of spectral details in the reference spectra. In the presence of substantial instrumental errors and other biases such convergence poses a potential impediment to multivariate minimization procedures employed in the SCD retrievals. Figure A7 illustrates this point. Here we use all the analyzed data, i.e., all the orbits from the four epochs in 2005. For each orbit, we calculate the linear Pearson correlation coefficients for the RS scales and SCD(NO2), separately for the DOMINO V2 and Goddard approaches. We use these orbital correlation coefficients (about 250 values for each approach) to build the histograms in Figure A7, where the DOMINO V2 SCD retrievals show systematically higher correlation coefficients. This comes in line with our assumption about the possible interference between the spectral details during simultaneous estimate of the RS amplitudes and trace gas SCDs from the relatively low‐resolution (∼1 nm) spectral data in the presence of relatively large (exceeding ∼ 0.002 nm in the OMI's case) errors in the wavelength adjustment.
Figure A7.
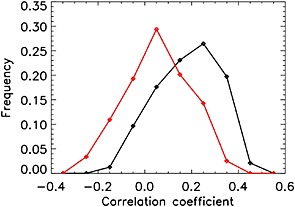
Distributions of the linear Pearson correlation coefficients between the RS scales and SCD(NO2). Red curve: Goddard retrieval. Black curve: DOMINO V2 retrieval.
One may argue that some correlation between the RS and SCD(NO2) values could be expected, since in a general case of a low‐absorbing atmosphere both values scale, if roughly, with AMF. However, one should note that both distributions in Figure A7 are drawn from the same subsample of orbits, so the degree of the possible RS and SCD correlation should be similar in both samples. Hence, there might be some inherent factor in the DOMINO V2 approach that produces the relatively higher NO2 and RS correlation. As a test of the assumption that correlations are of algorithmic, rather than geophysical origin, we select the central part of orbit #03610 (mostly, open water, noncontaminated NO2 areas) and avoid all FOVs with cloud fractions ≥0.1. In Figure A8 we plot the normalized SCD(NO2) retrievals versus the normalized RS scales. The DOMINO V2 retrievals show clear RS‐SCD(NO2) correlation in the data with low RS values. In light of the obtained evidence we assume that this bias could be related to the simultaneous RS and SCD retrieval.
Figure A8.
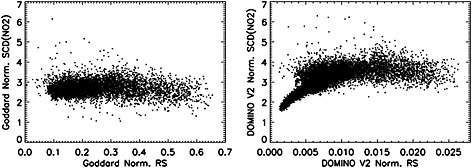
(left) The normalized by the geometric AMF and 1015 factor SCD(NO2) from the Goddard SCD retrievals plotted versus normalized RS scales (averages of 7 RS microwindow values, divided by a geometric AMF). (right) The normalized SCD(NO2) versus the normalized RS values for the DOMINO V2 SCD retrievals from orbit #03610, orbital exposures 400–900 and relatively cloud‐free areas with cloud fractions <0.1.
Such interference between the RS and NO2 signals may “stabilize” the DOMINO V2 retrievals. Indeed, there is an apparent absence of negative SCD(NO2) in the DOMINO V2 SCDs, while, from a general statistical standpoint, one should see some negatives in the particular portion of data which are negligibly different from 0. We routinely register up to 0.02%–0.06% of negative values in the Goddard retrievals. This specifically applies to SCDs values at or below the 1σ level: ∼1.1 × 10¹⁵ mol cm−2 for DOMINO V2, or ∼0.8 × 10¹⁵ mol cm−2 for Goddard. There is a sizeable portion of such data in orbit #03610 (e.g., Figure 3), mostly coming from the unpolluted, partially clouded equatorial regions. Hence, the DOMINO retrievals tend to show an artificially truncated SCD distribution which might be related to the cross talk between the RS and NO2 signals.
The proposed approach may not eliminate the putative cross‐talk problem entirely, nevertheless making it less likely to occur. Besides the growing similarity between the trace gas features in the low‐resolution spectra, the cross talk between the RS and trace gas signals could be augmented by presence of any structured instrument noise which was not completely accounted for.
A4. Iterative Removal of Instrumental Noise
The algorithm's ability to detect relatively low‐level (<1%) instrumental noise could be augmented once we eliminate the interference from the trace gas absorptions and any recognizable spectral trends, mostly of the geophysical origin: e.g., Rayleigh scattering, surface reflection/absorption, and Mie scattering by aerosols. This happens between the preliminary and the final SCD estimates (Figure 1). Using the preliminary SCD values, we remove the trace gas absorptions from the normalized (baselined) reflectances. Then we iteratively identify and eliminate the low‐amplitude (<1%) “spikes.” Presumably, these are either cosmic ray‐related events or short‐lived instrumental noise omitted during the onboard and ground‐based preprocessing. The frequency of these short‐lived spikes was low in the early part of the mission but has increased steadily throughout the mission. The spikes are located via estimates of the median values of the fitting residuals in the adjacent rows and wavelengths. At this stage of the calculation, the normalized reflectances are expected to be very close to unity; any significant deviation from unity can be interpreted as instrumental noise. To identify noisy data, we single out the residuals exceeding ±5σ level, then tighten it to ±3σ. The selected outliers are then replaced with the revised median values. Since this operation may change the spectral reference level, we apply a low‐pass filter in a form of a running mean box over n = 31 consecutive values of the fitting residuals. Then we normalize the reference level by the filter's output and propagate the changes into the original reflectances that contain the trace gas signals.
A5. Correction of the Fixed Spectral Patterns
While optimizing the performance of the new SCD algorithm, we investigated the impact of removal of the residual patterns seemingly related to the spectral undersampling [e.g., Chance et al., 2005]. Addressing this problem, we correct the second‐pass radiances (see Figure 1) for the stable spectral patterns presumably arising from the interpolation, exposure‐by‐exposure, of the monthly mean irradiances to the radiance wavelengths. Analyzing the stable patterns in the fitting residuals and dynamics of their changes, we decided to average them in 250‐exposure orbital blocks (Figure A9) and introduce appropriate corrections prior to the final SCD retrieval (second pass: Figure 1). Generally, the applied fixed‐pattern corrections do not exceed ±0.2%. The patterns are reasonably stable across the orbit. They also show some relatively minor, ≲0.05%, changes on a daily/weekly/monthly basis, thus pointing to the possibility that instrumental factors might be responsible for the patterns. Most likely, the subtle differences in the optical throughput in the instrumental pathways responsible for acquisition of radiances and irradiances (e.g., the volume diffusor in the solar data pathway) may introduce slight spectral differences that propagate into the reflectances during the inevitable interpolations of the solar reference spectrum. The gains from the spectral fixed‐pattern corrections are obvious (Figures A10 and A11).
Figure A9.
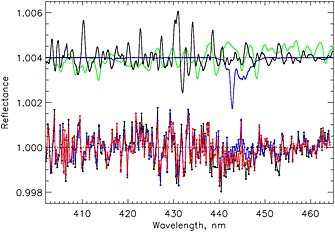
Black line: the fixed‐pattern corrections for the beginning/end of orbit #03610, obtained from the orbital exposures 200–300 and 1300–1400; blue line: the same for the midorbit section (exposures 550–800); and red line: the fixed‐pattern correction for the 1050–1300 orbital segment. The arbitrarily shifted and scaled reference spectra of ring (black), NO2 (green), and H2O (blue) are shown for guidance.
Figure A10.
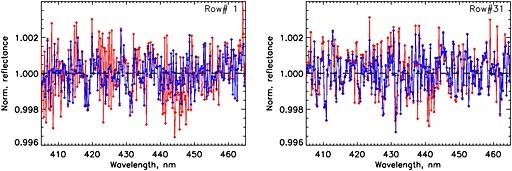
The fitting residuals before (red) and after (blue) fixed‐pattern correction shown for the exposure #800 (midorbit, taken mostly over the Pacific ocean), for the row #01 (an extreme off‐nadir FOV) and row #31 (close to nadir), orbit #03610.
Figure A11.
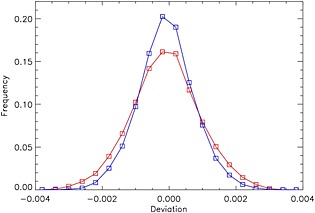
Histograms of the fitting residuals without the (red) and with (blue) fixed‐pattern correction for the exposure #800, orbit #03610.
The impact of the corrections on the retrieved SCDs is rather limited for NO2 (∼1.5–2.5% SCD changes in the average values, to be compared with the typical ∼10% SCD error) and even smaller (∼1–2%) for SCD(H2O). However, the sensitivity to the fixed‐pattern correction is heightened by the extreme weakness of the CHOCHO signal, where the differences typically exceed 10% and may occasionally reach 25%.
We realize that in the case of the extremely weak absorbers, i.e., the ones routinely producing max‐min spectral modulation falling below the expected S/N ratio in a typical orbital exposure, the imposed fixed‐pattern corrections might introduce unwarranted biases. This comes from the inability to cleanly remove the weak, poorly assessed (very high errors, typically at the 50% level) signal from the individual spectra. Hence, part of the weak‐absorber signal may uncontrollably propagate into the fixed‐pattern estimates. Upon detailed comparison of the CHOCHO retrievals, we found that sometimes the second‐pass (i.e., calculated after the fixed‐residual correction) SCDs may carry a negative bias. Hence, we decided to stop the CHOCHO calculations at the first‐pass estimates.
A6. Comparison With the Bremen Retrievals
At our request A. Richter (private communication, 2013) applied the Bremen algorithm [Richter and Burrows, 2002; Hilboll et al., 2013b] to OMI data in the 405–465 nm spectral range and kindly shared the preliminary results. Figure A12 compares the SCD(NO2) retrievals for Bremen and Goddard. On average, the Bremen fit provides ∼ higher SCD(NO2), i.e., the differences fall within the uncertainties of the individual SCD retrievals. We regard such systematic deviations as inevitable due to the substantial differences in our approaches.
Figure A12.
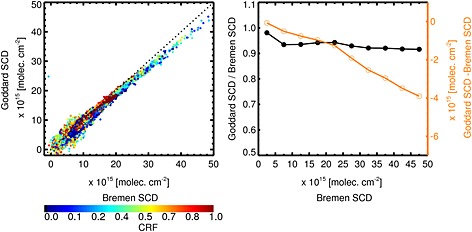
(left) Bremen and Goddard SCD(NO2) retrievals for different cloud conditions: OMI orbit #03610 from 20 March 2005. (right) The (Goddard/Bremen) ratios (black line) and (Goddard−Bremen) differences (orange line).
In Figure A13 we compare the fitting residuals for the exposure #1131 from the orbit #03610. This particular orbital exposure goes over the highly contaminated Beijing area, where the NO2 retrieval, despite the strong NO2 signal, proves to be challenging due to interference from other trace gases. The relatively less contaminated (offshore, open water) row #60 is shown, along with the progressively more NO2‐contaminated row #30 (around nadir), row #01 (Beijing suburbs), and row #10 (Beijing).
Figure A13.
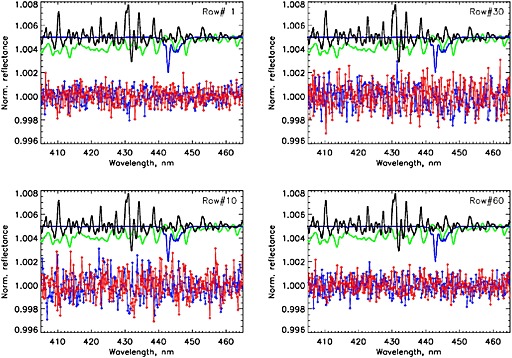
The Bremen (red) and Goddard (blue) fitting residuals for the orbital exposure #1131 from the test orbit #03610 for four different lines of sight (rows). For general guidance, the arbitrarily scaled and shifted reference spectra are shown above the residuals: ring (black), NO2 (green), and H2O (blue).
Figure A14 shows the corresponding histograms of the residuals. The Bremen and Goddard algorithms end up with comparable fitting residuals. Both distributions are quite symmetric, with negligible, ≲10−4, shifts from 0 of the mean values of distributions, thus pointing to an accurate estimate of the spectral baseline. As expected in the case of random, uncorrelated errors dominated by instrumental noise, both histograms closely follow normal distributions, with the Bremen algorithm producing a slightly larger dispersion of the residuals. Both approaches show the expected spread of the residuals for reflectances with an assumed average S/N ∼ 103.
Figure A14.
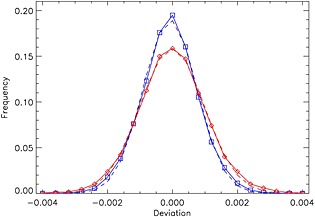
Histograms of the fitting residuals for the orbital exposure #1131, orbit #03610. Full lines (red for Bremen and blue for Goddard) show the fitting residual distributions, while the dashed lines show the corresponding Gaussian function fits.
Marchenko, S. , Krotkov N. A., Lamsal L. N., Celarier E. A., Swartz W. H., and Bucsela E. J. (2015), Revising the slant column density retrieval of nitrogen dioxide observed by the Ozone Monitoring Instrument. J. Geophys. Res. Atmos., 120, 5670–5692. doi: 10.1002/2014JD022913.
References
- Acarreta, J. R. , de Haan J. F., and Stammes P. (2004), Cloud pressure retrieval using the O2‐O2 absorption band at 477 nm, J. Geophys. Res., 109, D05204, doi:10.1029/2003JD003915. [Google Scholar]
- Adams, C. , et al. (2013), The spring 2011 final stratospheric warming above Eureka: Anomalous dynamics and chemistry, Atmos. Chem. Phys., 13, 611–624. [Google Scholar]
- Anand, S. , Monks P. S., and Leigh R. J. (2015), An improved retrieval of tropospheric NO2 from space over polluted regions using an Earth radiance reference, Atmos. Meas. Tech., 8, 1519–1535, doi:10.5194/amt-8-1519-2015. [Google Scholar]
- Belmonte Rivas, M. , Veefkind P., Boersma F., Levelt P., Eskes H., and Gille J. (2014), Intercomparison of daytime stratospheric NO2 satellite retrievals and model simulations, Atmos. Meas. Tech., 7, 2203–2225, doi:10.5194/amt-7-2203-2014. [Google Scholar]
- Beirle, S. , Boersma K. F., Platt U., Lawrence M. G., and Wagner T. (2011), Megacity emissions and lifetimes of nitrogen oxides probed from space, Science, 333(6050), 1737–1739, doi:10.1126/science.1207824. [DOI] [PubMed] [Google Scholar]
- Bey, I. , Jacob D. J., Yantosca R. M., Logan J. A., Field B. D., Fiore A. M., Li Q., Liu H. Y., Mickley L. J., and Schultz M. G. (2001), Global modeling of tropospheric chemistry with assimilated meteorology: Model description and evaluation, J. Geophys. Res., 106, 23,073–23,095. [Google Scholar]
- Boersma, K. F. , Bucsela E. J., Brinksma E. J., and Gleason J. F. (2002), NO2, in OMI Algorithm Theoretical Basis Document, OMI Trace Gas Algorithms, ATB‐OMI‐04, Version 2.0, 20 August, 2002, vol. 4, edited by Chance K., pp. 13–36, NASA Distrib. Active Archive Cent, Greenbelt, Md. [Google Scholar]
- Boersma, K. F. , et al. (2007), Near‐real time retrieval of tropospheric NO2 from OMI, Atmos. Chem. Phys., 7, 2103–2118. [Google Scholar]
- Boersma, K. F. , Jacob D. J., Eskes H. J., Pinder R. W., Wang J., and van der A R. J. (2008), Intercomparison of SCIAMACHY and OMI tropospheric NO2 columns: Observing the diurnal evolution of chemistry and emissions from space, J. Geophys. Res., 113, D16S26, doi:10.1029/2007JD008816. [Google Scholar]
- Boersma, K. F. , et al. (2011), An improved tropospheric NO2 column retrieval algorithm for the Ozone Monitoring Instrument, Atmos. Meas. Tech., 4, 1905–1928. [Google Scholar]
- Bovensmann, H. , Burrows J. P., Buchwitz M., Frerick J., Noël S., Rozanov V. V., Chance K. V., and Goede A. P. H. (1999), SCIAMACHY: Mission objectives and measurement modes, J. Atmos. Sci., 56, 127–150. [Google Scholar]
- Bracher, A. , Sinnhuber M., Rozanov A., and Burrows J. P. (2005), Using a photochemical model for the validation of NO2 satellite measurements at different solar zenith angles, Atmos. Chem. Phys., 5, 393–408. [Google Scholar]
- Bucsela, E. J. , et al. (2008), Comparison of NO2 in situ aircraft measurements with data from the ozone monitoring instrument, J. Geophys. Res., 113, D16S31, doi:10.1029/2007JD008838. [Google Scholar]
- Bucsela, E. J. , Krotkov N. A., Celarier E. A., Lamsal L. N., Swartz W. H., Bhartia P. K., Boersma K. F., Veefkind J. P., Gleason J. F., and Pickering K. E. (2013), A new stratospheric and tropospheric NO2 retrieval algorithm for nadir‐viewing satellite instruments: Applications to OMI, Atmos. Meas. Tech., 6, 2607–2626, doi:10.5194/amt-6-2607-2013. [Google Scholar]
- Burrows, J. P. , et al. (1999), The Global Ozone Monitoring Experiment (GOME): Mission concept and first scientific results, J. Atmos. Sci., 56, 151–175. [Google Scholar]
- Callies, J. , Corpaccioli E., Eisinger M., Hahne A., and Lefebvre A. (2000), GOME‐2‐Metop's second‐generation sensor for operational ozone monitoring, ESA Bull., 102, 28–36. [Google Scholar]
- Cebula, R. P. , Joiner J., Bhartia P. K., Hilsenrath E., McPeters R. D., and Park H. (1995), Rotational Raman scattering (ring effect) in satellite backscatter ultraviolet measurements, Appl. Opt., 34(21), 4513–4525. [DOI] [PubMed] [Google Scholar]
- Chance, K. , and Kurucz R. L. (2011), An improved high‐resolution solar reference spectrum for Earth's atmosphere measurements in the ultraviolet, visible, and near infrared, J. Quant. Spectrosc. Radiat. Transfer, 111(9), 1289–1295. [Google Scholar]
- Chance, K. , Kurosu T. P., and Sioris K. E. (2005), Undersampling correction for array detector‐based satellite spectrometers, Appl. Opt., 44(7), 1296–1304. [DOI] [PubMed] [Google Scholar]
- de Wildt, M. R. , Eskes H., and Boersma K. F. (2012), The global economic cycle and satellite‐derived NO2 trends over shipping lanes, Geophys. Res. Lett., 39, L01802, doi:10.1029/2011GL049541. [Google Scholar]
- Dirksen, R. , Dobber M., Voors R., and Levelt P. (2006), Prelaunch characterization of the Ozone Monitoring Instrument transfer function in the spectral domain, Appl. Opt., 45(17), 3972–3981. [DOI] [PubMed] [Google Scholar]
- Dirksen, R. J. , Boersma K. F., Eskes H. J., Ionov D. V., Bucsela E. J., Levelt P. F., and Kelder H. M. (2011), Evaluation of stratospheric NO2 retrieved from the ozone monitoring instrument: Intercomparison, diurnal cycle, and trending, J. Geophys. Res., 116, D08305, doi:10.1029/2010JD014943. [Google Scholar]
- Dobber, M. R. , et al. (2006), Ozone monitoring instrument calibration, IEEE Trans. Geosci. Remote Sens., 44, 1209–1238. [Google Scholar]
- Dobber, M. R. , Kleipool Q., Dirksen R., Levelt P. F., Jaross G., Taylor S., Kelly T., Flynn L., Leppelmeier G., and Rozemeijer N. (2008a), Validation of ozone monitoring instrument level 1b data products, J. Geophys. Res., 113, D15S06, doi:10.1029/2007JD008665. [Google Scholar]
- Dobber, M. , Voors R., Dirksen R., Kleipool Q., and Levelt P. (2008b), The high‐resolution Solar reference spectrum between 250 and 550 nm and its application to measurements with the Ozone Monitoring Instrument, Sol. Phys., 249, 281–291. [Google Scholar]
- Douglass, A. R. , Stolarski R. S., Strahan S. E., and Connell P. S. (2004), Radicals and reservoirs in the GMI chemistry and transport model: Comparison to measurements, J. Geophys. Res., 109, D16302, doi:10.1029/2004JD004632. [Google Scholar]
- Duncan, B. N. , Strahan S. E., Yoshida Y., Steenrod S. D., and Livesey N. (2007), Model study of the cross‐tropopause transport of biomass burning pollution, Atmos. Chem. Phys., 7, 3713–3736. [Google Scholar]
- Duncan, B. N. , Yoshida Y, de Foy B., Lamsal L. N., Streets D., Lu Z., Pickering K. E., and Krotkov N. A. (2013), The observed response of the Ozone Monitoring Instrument (OMI) NO2 column to NOx emission controls on power plants in the United States: 2005–2011, Atmos. Env., 81, 102–111. [Google Scholar]
- Finlayson‐Pitts, B. J. , and Pitts J. N. Jr. (2000), Chemistry of the Upper and Lower Atmosphere: Theory, Experiments and Applications, Academic Press, San Diego, Calif. [Google Scholar]
- Ghude, S. D. , Kulkarni S. H., Jena C., Pfister G. G., Beig G., Fadnavis S., and van der A R. J. (2013), Application of satellite observations for identifying regions of dominant sources of nitrogen oxides over the Indian Subcontinent, J. Geophys. Res. Atmos., 118, 1075–1089, doi:10.1029/2012JD017811. [Google Scholar]
- Hendrick, F. , et al. (2012), Analysis of stratospheric NO2 trends above Jungfraujoch using ground‐based UV‐visible, FTIR, and satellite nadir observations, Atmos. Chem. Phys., 12, 8851–8864, doi:10.5194/acp-12-8851-2012. [Google Scholar]
- Hilboll, A. , Richter A., and Burrows J. P. (2013a), Long‐term changes of tropospheric NO2 over megacities derived from multiple satellite instruments, Atmos. Chem. Phys., 13, 4145–4169, doi:10.5194/acp-13-4145-2013. [Google Scholar]
- Hilboll, A. , Richter A., Rozanov A., Hodnebrog O., Heckel A., Solberg S., Stordal F., and Burrows J. P. (2013b), Improvements to the retrieval of tropospheric NO2 from satellite stratospheric correction using SCIAMACHY limb/nadir matching and comparison to Oslo CTM2 simulations, Atmos. Meas. Tech., 6, 565–584, doi:10.5194/amt-6-565-2013. [Google Scholar]
- Kim, S. W. , Heckel A., McKeen S. A., Frost G. J., Hsie E. Y., Trainer M. K., Richter A., Burrows J. P., Peckham S. E., and Grell G. A. (2006), Satellite‐observed U.S. power plant NOx emission reductions and their impact on air quality, Geophys. Res. Lett., 33, L22812, doi:10.1029/2006GL027749. [Google Scholar]
- Kleipool, Q. L. , Dobber M. R, de Haan J. F., and Levelt P. F. (2008), Earth surface reflectance climatology from 3 years of OMI data, J. Geophys. Res., 113, D18308, doi:10.1029/2008JD010290. [Google Scholar]
- Krotkov, N. A. , Bucsela E. J., Celarier E. A., Lamsal L. N., and Swartz W. H. (2012), Improved OMI NO2 Standard Product: Algorithm, evaluation, and results, paper presented at 2012 EOS Aura Science Team Meeting, Pasadena, Calif., 1–3 Oct.
- Lamsal, L. N. , Martin R. V., van Donkelaar A., Celarier E. A., Bucsela E. J., Boersma K. F., Dirksen R., Luo C., and Wang Y. (2010), Indirect validation of tropospheric nitrogen dioxide retrieved from the OMI satellite instrument: Insight into the seasonal variation of nitrogen oxides at northern midlatitudes, J. Geophys. Res., 115, D05302, doi:10.1029/2009JD013351. [Google Scholar]
- Lamsal, L. N. , Martin R. V., Parrish D. D., and Krotkov N. A. (2013), Scaling relationship for NO2 pollution and urban population size: A satellite perspective, Environ. Sci. Technol., 47, 7855–7861. [DOI] [PubMed] [Google Scholar]
- Lamsal, L. N. , et al. (2014), Evaluation of OMI operational standard NO2 column retrievals using in situ and surface‐based NO2 observations, Atmos. Chem. Phys. Discuss., 14, 14,519–14,573. [Google Scholar]
- Levelt, P. F. , van den Oord G. H. J., Dobber M. R., Malkki A., Visser H., de Vries J., Stammes P., Lundell J. O. V., and Saari H. (2006), The ozone monitoring instrument, IEEE Trans. Geosci. Remote Sens., 44, 1093–1101. [Google Scholar]
- Lichtenberg, G. , et al. (2010), SCIAMACHY offline level 1b‐2 processor ATBD. Institution: DLR, ENV‐ATB‐QWG‐SCIA‐0085, Issue 1A.
- Lin, J. T. , McElroy M. B., and Boersma K. F. (2010), Constraint of anthropogenic NOx emissions in China from different sectors: A new methodology using multiple satellite retrievals, Atmos. Chem. Phys., 10, 63–78. [Google Scholar]
- Martin, R. V. , Jacob D. J., Chance K., Kurosu T. P., Perner P. I., and Evans M. J. (2003), Global inventory of nitrogen oxide emission constrained by space‐based observations of NO2 columns, J. Geophys. Res., 108(D17), 4537, doi:10.1029/2003JD003453. [Google Scholar]
- Maasakkers, J. D. , et al. (2013), Vital improvements to the retrieval of tropospheric NO2 columns from the Ozone Monitoring Instrument. Abstracts EGU2013‐714 presented at 2013 EGU General Assembly Conference, Vienna, Austria, 7–12 April.
- Marchenko, S. , and DeLand M. T. (2014), Solar spectral irradiance changes during cycle 24, Astrophys. J., 789, 117. [Google Scholar]
- McLinden, C. A. , Fioletov V., Boersma K. F., Krotkov N., Sioris C. E., Veefkind J. P., and Yang K. (2012), Air quality over the Canadian oil sands: A first assessment using satellite observations, Geophys. Res. Lett., 39, L04804, doi:10.1029/2011GL050273. [Google Scholar]
- Mebust, A. K. , and Cohen R. C. (2013), Observations of a seasonal cycle in NOx emissions from fires in African woody savannas, Geophys. Res. Lett., 40, 1451–1455, doi:10.1002/grl.50343. [Google Scholar]
- Mebust, A. K. , Russell A. R., Hudman R. C., Valin L. C., and Cohen R. C. (2011), Characterization of wildfire NOx emissions using MODIS fire radiative power and OMI tropospheric NO2 columns, Atmos. Chem. Phys., 11, 5839–5851. [Google Scholar]
- Peters, E. , Wittrock F., Richter A., Alvarado L. M. A., Rozanov V. V., and Burrows J. P. (2014), Liquid water absorption and scattering effects in DOAS retrievals over oceans, Atmos. Meas. Tech. Discuss., 7, 5027–5073, doi:10.5194/amtd-7-5027-2014. [Google Scholar]
- Platt, U. , and Stutz J. (2006), Differential Optical Absorption Spectroscopy (DOAS), Principle and Applications, Springer. [Google Scholar]
- Press, W. H. , Teukolsky S. A., Vetterling W. T., and Flannery B. P. (1992), Numerical Recipies in Fortran 77. The Art of Scientific Computing, 2nd ed., Cambridge, Univ. Press, Cambridge, U. K. [Google Scholar]
- Richter, A. , and Burrows J. P. (2002), Tropospheric NO2 from GOME measurements, Adv. Space Res., 29, 1673–1683, doi:10.1016/S0273-1177(02)00100-X. [Google Scholar]
- Richter, A. , Burrows J. P., Nub H., Granier C., and Niemeier U. (2005), Increase in tropospheric nitrogen dioxide levels over China observed from space, Nature, 437, 129–132. [DOI] [PubMed] [Google Scholar]
- Rothman, L. S. , et al. (2009), The HITRAN 2008 molecular spectroscopic database, J. Quant. Spectrosc. Radiat. Transfer, 114, 533–572. [Google Scholar]
- Russell, A. R. , Valin L. C., Bucsela E. J., Wenig M. O., and Cohen R. C. (2010), Space‐based constraints on spatial and temporal patterns of NOx Emissions in California, 2005–2008, Environ. Sci. Technol., 44, 3608–3615. [DOI] [PubMed] [Google Scholar]
- Russell, A. R. , Valin L. C., and Cohen R. C. (2012), Trends in OMI NO2 observations over the United States: Effects of emission control technology and the economic recession, Atmos. Chem. Phys., 12, 12197–12209, doi:10.5194/acp-12-12197-2012. [Google Scholar]
- Schaub, D. , Brunner D., Boersma K. F., Keller J., Folini D., Buchmann B., Berresheim H., and Staehelin J. (2007), SCIAMACHY tropospheric NO2 over Switzerland: Estimates of NO2 lifetimes and impact of the complex Alpine topography on the retrieval, Atmos. Chem. Phys., 7, 5971–5987. [Google Scholar]
- Seinfeld, J. H. , and Pandis S. N. (2006), Atmospheric Chemistry and Physics: From Air Pollution to Climate Change, 2nd ed., Wiley, New York. [Google Scholar]
- Strahan, S. E. , Duncan B. N., and Hoor P. (2007), Observationally derived transport diagnostics for the lowermost stratosphere and their application to the GMI chemistry and transport model, Atmos. Chem. Phys., 7, 2435–2445. [Google Scholar]
- Streets, D. G. , et al. (2013), Emissions estimation from satellite retrievals: A review of current capability, Atmos. Environ., 77, 1011–1042. [Google Scholar]
- Toenges‐Schuller, N. , Stein O., Rohrer F., Wahner A., Richter A., Burrows J. P., Beirle S., Wagner T., Platt U., and Elvidge C. D. (2006), Global distribution pattern of anthropogenic nitrogen oxide emissions: Correlation analysis of satellite measurements and model calculations, J. Geophys. Res., 111, D05312, doi:10.1029/2005JD006068. [Google Scholar]
- van der A, R. J. , Eskes H. J., Boersma K. F., van Noije T. P. C., Van Roozendael M., De Smedt I., Peters D. H. M. U., and Meijer E. W. (2008), Identification of NO2 sources and their trends from space using seasonal variability analyses, J. Geophys. Res., 113, D04302, doi:10.1029/2007JD009021. [Google Scholar]
- van Geffen, J. H. G. M. , Boersma K. F., Van Roozendael M., Hendrick F., Mahieu E., De Smedt I., Sneep M., and Veefkind J. P. (2014), Improved spectral fitting of nitrogen dioxide from OMI in the 405–465 nm window, Atmos. Meas. Tech. Discuss., 7, 10619–10671. [Google Scholar]
- Vandaele, A. C. , Hermans C., Simon P. C., Carleer M., Colin R., Fally S., Mérienne M. F., Jenouvrier A., and Coquart B. (1998), Measurements of the NO2 absorption cross‐section from 42,000 cm−1 to 10,000 cm−1 (238‐1000 nm) at 220 K and 294 K, J. Quant. Spectrosc. Radiat. Transfer, 59, 171–184. [Google Scholar]
- Vasilkov, A. , Joiner J., Gleason J., and Bhartia P. K. (2002), Ocean Raman scattering in satellite backscatter UV measurements, Geophys. Res. Lett., 29(17), 1837, doi:10.1029/2002GL014955. [Google Scholar]
- Vinken, G. C. M. , Boersma K. F., van Donkelaar A., and Zhang L. (2014), Constraints on ship NOx emissions in Europe using GEOS‐Chem and OMI satellite NO2 observations, Atmos. Chem. Phys., 14, 1353–1369, doi:10.5194/acp-14-1353-2014. [Google Scholar]
- Volkamer, R. , Spietz P., Burrows J., and Platt U. (2005), High‐resolution absorption cross‐section of Glyoxal in the UV/VIS and IR spectral ranges, J. Photochem. Photobiol., 172, 35–46, doi:10.1016/j.jphotochem.2004.11.011. [Google Scholar]
- Voors, R. , Dobber M., Dirksen R., and Levelt P. (2006), Method of calibration to correct for cloud‐induced wavelength shifts in the Aura satellite's Ozone Monitoring Instrument, Appl. Opt., 45, 3652–3658, doi:10.1364/AO.45.003652. [DOI] [PubMed] [Google Scholar]
- Zhang, Q. , et al. (2007), NOx emission trends for China, 1995‐2004: The view from the ground and the view from space, J. Geophys. Res., 112, D22306, doi:10.1029/2007JD008684. [Google Scholar]


