Abstract
Release of reactive oxygen species (ROS) accompanied with acute inflammation and infection often results in cell death and tissue injury. Several ROS-reactive bioluminescent probes have been investigated in recent years to detect ROS activity in vivo. Unfortunately, these probes cannot be used to quantify the degree of ROS activity and inflammatory responses due to the fact that the extent of the bioluminescent signals is also probe-concentration dependent. To address this challenge, we fabricated a ratiometric ROS probe in which both ROS-sensitive chemiluminescent agents and ROS-insensitive fluorescent reference dye were conjugated to particle carriers. The bioluminescence/reference fluorescence intensity ratios was calculated to reflect the extent of localized ROS activities while circumventing the variations in bioluminescent intensities associated with the ROS probe concentrations. The physical and chemical properties of the ratiometric probes were characterized. Furthermore, we assessed the accuracy and reproducibility of the probe in detecting ROS in vitro. The ability of the ratiometric probes to detect ROS production in inflamed/infected tissues was also examined using animal models of inflammation and infection. The overall results imply that ratiometric ROS probes can rapidly and non-invasively detect and quantify the extent of inflammatory responses and bacterial infection on wounds in real time.
Keywords: Reactive oxygen species, optical imaging probe, inflammation, wound infection, diagnosis
1. Introduction
Tissue inflammation arises from a variety of injuries and diseases ranging from cancer to gunshot wounds. Traditionally, histological evaluation of tissue biopsies has been used to provide direct measurements of inflammatory responses. However, a tissue biopsy is a relatively invasive and unreliable method of assessing the overall extent of inflammatory cell recruitment. Although analyzing white blood cell counts and inflammatory cytokine concentrations in blood may provide some indications of systemic immune reactions, the results from such analyses may not accurately reflect the extent of localized inflammatory responses. Therefore, there is a need for the development of new methods to assess the extent of these responses in vivo.
Inflamed tissues are typically filled with a variety of immune cells, including macrophages/monocytes, polymorphonuclear neutrophils (PMNs), mast cells, lymphocytes, and dendritic cells that participate in the pathogenesis of inflammatory diseases.1 Among all immune cells, PMNs are the most abundant type, arriving in large numbers at the injured tissue site within minutes of injury or infection.2, 3 Therefore, histological evaluations of PMN accumulation in the tissue are often carried out to estimate the extent of acute inflammatory response at the inflamed site.4, 5 Activated PMNs may undergo respiratory bursts, releasing a variety of reactive oxygen species (ROS), including hydrogen peroxide, hypochlorous acid, hydroxyl radical, and singlet oxygen.6, 7 Release of ROS may result in oxidative damage to foreign microorganisms, injured cells, and even healthy cells. The extent of ROS production in tissue is well-established as an indicator that reflects the degree of inflammatory reactions.8
The release of ROS by inflammatory cells can be quantified by many methods which include spectrophotometric measurements, electron spin resonance spectroscopy, chemiluminescence, etc.9 These methods are well established and have been used extensively to study the extent of ROS production by PMN in vitro. However, most of these methods cannot be used to measure PMN-associated ROS responses in vivo. In recent times, several imaging modalities have been developed to monitor ROS production in vivo, including electron paramagnetic resonance (EPR), PET, fluorescence, and chemiluminescence detection.8, 10–15 Both EPR and PET have very low sensitivity, making them poor candidates for the direct detection of highly-reactive free radicals in vivo.16 ROS-sensitive fluorescent probes have a low signal-to-noise ratio due to the autofluorescence generated by tissues and organs and are photo-bleached very easily.17 On the other hand, chemiluminescence has many advantages, including high sensitivity and specificity, easy quantitative analysis, a wide dynamic range, and localization and quantification of light emission at the single-photon level. Without the requirement of excitation light as in fluorescence, chemiluminescent agents can emit detectable light upon reaction with ROS generated in a biological system with minimal to no background signal.18, 19
Recent advances in optical imaging instrumentation have made it feasible to detect even weak chemiluminescence signals in whole animals. Several chemiluminescence probes have been developed for non-invasive real time imaging in vivo. For example, peroxalate nanoparticles and oxazine-conjugated nanoparticles have been fabricated and used as chemiluminescence probes to detect hydrogen peroxide in vivo and hypochlorous acid and peroxynitrite generation ex vivo in mouse hearts after myocardial infarction.15, 20 L-012 (8-amino-5-chloro-7-phenylpyrido[3,4–d]pyridazine-1,4(2H,3H)dione), a luminol-derivative chemiluminescence probe, has been used in studies to detect ROS production in vivo.8, 21 Although these chemiluminescence probes (peroxalate nanoparticles and L-012) have shown great promise for in vivo monitoring of ROS activities following severe and acute inflammatory responses, it is difficult to quantify ROS production as the imaging outcome is strongly affected by diffusion of these probes into and out of cells or inflamed tissues as well as probe concentrations.
To overcome the above limitations, several ratiometric fluorescence probes have been established for ROS detection in vitro and in vivo.22–24 These ratiometric fluorescence probes have some distinct advantages over conventional probes in that fluctuation of the excitation source and probe concentration do not affect the fluorescence intensity ratio between the indicator and reference dye. Ratiometric imaging measurements can be used to quantitatively analyze ROS production in vitro. Unfortunately, these probes’ resolution for in vivo ROS measurements is limited due to strong autofluorescence from tissues.
To overcome these drawbacks, we chose a near infrared fluorescence dye (NIR) as an internal reference due to its low autofluorescence from superfluous tissues and chemiluminescence dye (L-012) as a ROS indicator due to its lack of a background signal and excitation requirement. To combine the advantages of these dyes, we loaded both into nanoparticles that serve as a platform for the probe. Incorporation of both groups of dyes into a single particle ensures a constant ratio of L-012 and NIR dye in tissue. The physical, chemical and biological properties of the ratiometric ROS probes were then evaluated. First, the accuracy and reproducibility of the ratiometric probe in detecting ROS was examined in vitro. Second, using animal models of wound inflammation and infection, the probes were used to detect ROS production in inflamed/infected tissues in vivo. Finally, the relationship between ratiometric ROS imaging results and histological analyses was determined.
2. Materials and Methods
2.1. Materials
L-012 was purchased from Wako Chemicals USA, Inc. (Richmond, VA). 2-(2-Methoxyethoxy)ethyl methacrylate, methoxy PEG methacrylate (Mn 300), ethylene glycol dimethylacrylate, styrene, ammonium persulfate and sodium dodecyl sulfate and 1,1′,3,3,3′,3′-Hexamethylindotricarbocyanine (IR750) were purchased from Sigma-Aldrich (St Louis, MO). PMN neutralizing antibody (rabbit anti-mouse PMN) was bought from Accurate Chemical & Scientific Corp. (Westbury, NY, USA) PMN staining antibody (rat anti-mouse neutrophil antibody) was purchased from Abcam (Cambridge, MA, USA).
2.2. Methods
2.2.1. Preparation and characterization of ratiometric ROS nanoprobes
The nanoparticles (NPs) were first synthesized via emulsion polymerization following the referenced method with minor modification.25 Briefly, 2-(2-Methoxyethoxy) ethyl methacrylate (67µM), methoxy PEG methacrylate (Mn 300) (33 µM), ethylene glycol dimethylacrylate (33 µM), styrene (33 µM) and sodium dodecyl sulfate (4 µM) were mixed with 300 ml of DI water in a reactor. After the solution temperature was increased to 70°C under N2 purging, ammonium persulfate (2 µM) was introduced into the solution to initiate polymerization. Under nitrogen atmosphere, the reaction lasted 6 hours with stirring at 70°C. The as-prepared nanoparticles were purified with exhaustive dialysis against DI water. The nanoparticle concentration was adjusted to 10 mg/ml for further use. It is observed that the as-prepared nanoparticles do not aggregate over 2 years, indicating that the nanoparticles are colloidally stable. The morphology of the nanoparticles was characterized using a JEM-1200EX transmission electron microscope (JEOL, Japan) and a Nicolet 6700 FT-IR spectrometer (Thermo Nicolet Corp., Madison, WI). The loading of reference dye (IR750) into particles was conducted as described previously.26 In brief, 10 ml of IR750 THF solution (0.2 mg/ml) was incubated with 10 ml of the aqueous nanoparticle dispersion (5 mg/ml) overnight in the dark. THF solvent was removed under vacuum. The IR750-loaded nanoparticles underwent dialysis against DI water. For the loading of L-012, 100 mg of L-012 was dissolved in 10 ml of IR750-loaded nanoparticle dispersion (5mg/ml) and incubated in the dark for one day. The L-012 unloaded into the particles was removed using a centrifuge filter tube (Mw cutoff: 3500). The filtrate was collected and L-012 amount in the filtrate was determined by reading absorbance at 455 nm using a UV-vis spectrophotometer (Lambda 19 Spectrometer, PerkinElmer, MA). Loading efficiency of L012 was estimated following the equation: Loading efficiency = (Mtotal L012−Mfiltrate L012)/MNP ×100%, where Mtotal L012 is mass of the total added L012, Mfiltrate L012 is mass of the L012 in filtrate, and MNP is mass of the NPs.
2.2.2. In vitro detection of ROS using the ratiometric ROS nanoprobe
In vitro detection of ROS was carried out using a Tecan Infinite M 200 plate reader (San Jose, CA). Chemiluminescence intensity data was collected with a 20-second acquisition time, and fluorescence intensity was recorded with a 2-µs exposure at an emission of 830 nm and an excitation of 760 nm. To investigate effect of ROS concentration, in a 96 well plate, 10 µL of the ratiometric ROS nanoprobe (0.4 mg/ml) was mixed with 200 µL of H2O2 solution with various concentrations. To study effect of probe concentration, 200 µL of H2O2 solution (2.5 mM) was incubated with 10 µL of the ratiometric ROS nanoprobe with various concentrations. To test peroxide selectivity, 10 µL of the probe was combined with 200 µL of various ROS concentrations (2.5 mM). Hydrogen peroxide (H2O2) and hypochlorite anion (OCl−) were obtained by diluting hydrogen peroxide and sodium hypochlorite stock solution, respectively. Hydroxyl radicals (OH•), superoxide (O2−) and single oxygen (1O2) were prepared by reaction of Fe2+ (20 mM) with H2O2 (2.5 mM), KO2 (2.5 mM) and H2O2 (2.5 mM) with NaOCl (2.5 mM), respectively.
2.2.3. Cytotoxicity assay of the ratiometric ROS nanoprobe
Cytotoxicity of the ratiometric ROS nanoprobe to cells was determined by employing a standard MTT assay.26 Briefly, using Dulbecco's Modified Eagle Medium (DMEM) supplemented with 10% fetal bovine serum (FBS) + 1% antibiotics, mouse 3T3 fibroblasts (1.0 ×10⁴ cells/well) were seeded and cultured in a 96-well plate for 24 h with 5% CO2 at 37 °C. The culture medium in each well was then replaced with 150 µL of complete DMEM medium at the desired probe concentrations. After 24 h incubation, the medium was removed and cells were washed three times with phosphate buffered saline (PBS, pH 7.4). 150 µL of MTT working medium was added to each well and incubated for 4 h. Finally, the absorbance of MTT reaction was measured at 570 nm using a SpectraMax 340 Spectrophotometric plate reader (Molecular Devices, USA).
2.2.4. Effect of skin-phantom depth on signal intensity of the ratiometric ROS nanoprobe
Skin-phantom tissues with various thicknesses (0–5 mm) were prepared as reported previously.27 250 µl of solution containing H2O2 (6.0 mM) and IR750-NP-L012 probes (0.4mg/ml) were added into each well, and then these phantoms were placed between the solution and the emission light pathways during image collection. Using a Kodak In Vivo FX Pro System (Kodak, USA) (f/stop, 2.5; 4×4 binning), the chemiluminescence intensities were collected with an exposure time of 5 min, and the fluorescence intensities were recorded with an exposure time of 30 sec (excitation at 760 nm, emission at 830 nm).
2.2.5. Ratiometric ROS imaging of wound-associated inflammation and bacteria-associated wound infection in vivo
Wound-associated inflammation and bacteria-associated wound infection models were employed for in vivo animal studies. All studies were conducted in accordance with the animal protocols approved by University of Texas at Arlington. Balb/C mice (female, 20–25 gram body weight) were obtained from Taconic Farms, Inc. Germantown, NY) and employed throughout all animal studies. For the wound-associated inflammation model, 1-, 3- and 7-day topical wounds with a diameter of 8 mm were created on the dorsal area of mice (n = 4). 10µL of the IR750-NP-L012 nanoprobes (0.25mg/ml) was sprayed topically on the wounds. For the bacteria-associated wound infection model, Staphylococcus aureus was cultured at 37 °C and maintained in brain heart infusion broth for the duration of the study. After washing thrice with sterile PBS, the bacteria was diluted to 1×10⁴ – 1×10⁸ /ml with PBS prior to the experiment. Incision wounds were created on the back of mice (n = 4). After one day, the wound site was inoculated with different numbers of Staphylococcus aureus for 4 hours, then 10 µL of the IR750-NP-L012 nanoprobes (0.25mg/ml) was applied to the wounds. Using a Kodak In Vivo FX Pro System (Kodak, USA) (f/stop, 2.5; 4×4 binning), L-012 signal (chemiluminescence) was collected at an exposure time of 10 min, and IR750 signal (fluorescence) was recorded at an exposure time of 30 seconds with an excitation of 760 nm and an emission of 830 nm. The ratiometric images (L012/IR750) were evaluated after background subtraction. Polygonal regions of interest (ROI) were selected over the wound positions in the ratiometric imaging. The mean intensities for all pixels in the ROS ratiometric imaging were obtained using Carestream Molecular Imaging Software, Network Edition 4.5 (Carestream Health).
2.2.6. Histological analysis and neutrophil quantifications
Immediately after in vivo imaging, the mice were sacrificed and the wound surrounding tissues were isolated for histological analysis as described previously.28, 29 Hematoxylin and eosin staining (H&E) was performed in order to evaluate the overall inflammatory response. Furthermore, neutrophil staining was conducted with pan-neutrophil antibody (Santa Cruz Biotechnology, Santa Cruz, CA) and then with peroxidase-conjugated goat anti-rat secondary antibodies (Jackson ImmunoResearch Laboratories, West Grove, PA) to quantify the number of the neutrophils recruited to wound surrounding tissues. All histological imaging analyses were carried out on a Leica microscope (Leica Microsystems GmbH, Wetzlar, Germany) and processed using NIH ImageJ (National Institutes of Health, Bethesda, MD).
2.2.7. Statistical analysis
The statistical analysis between different treatment groups was carried out using Student’s t-test. Differences were considered statistically significant when p ≤ 0.05.
3. Results and Discussions
3.1. Fabrication and characterization of ratiometric ROS nanoprobes
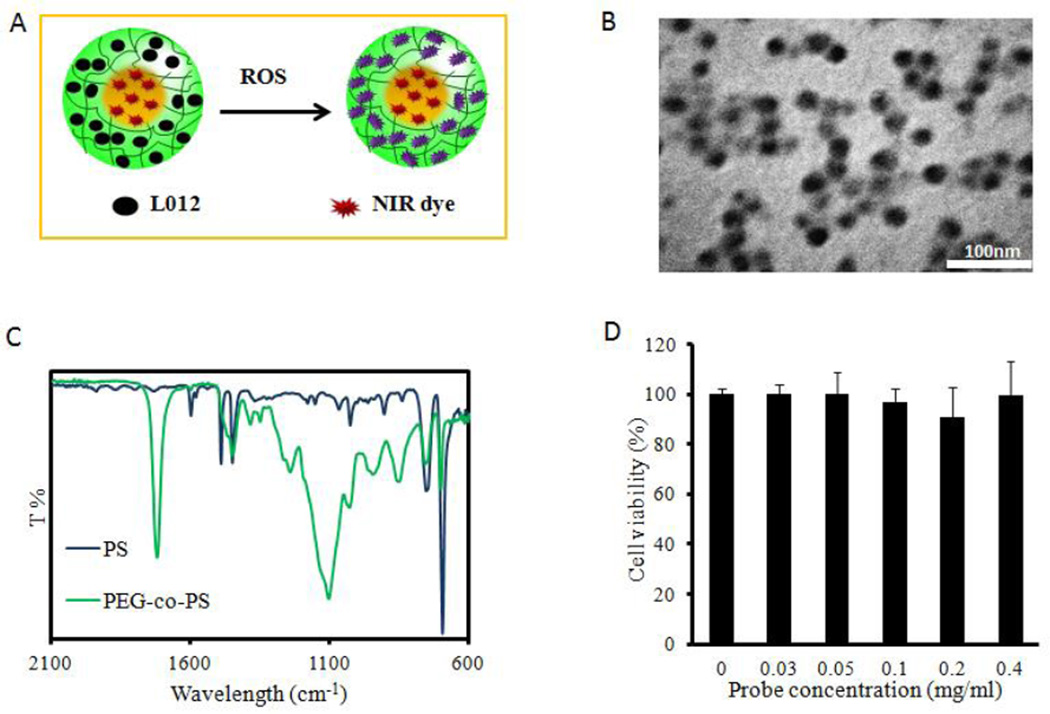
In this study, a novel ratiometric ROS nanoprobe was developed as illustrated in Figure 1A. First, nanoparticles as a platform for both the ROS indicator and reference dye were synthesized by emulsion polymerization. TEM imaging revealed that the nanoparticles were homogeneous and spherical in shape.
Figure 1.
ROS ratiometric probe design and characterization. (A) Upon exposure to ROS, L-012-and-NIR NPs display chemiluminescence. (B) Nanoparticles are uniformly spherical with an average diameter of 25 nm. (C) FTIR analysis displays bare nanoparticle makeup as a combination of hydrophilic PEG domains and hydrophobic polystyrene ones. (D) An MTT assay showed no significant cytotoxicity of dye-loaded NPs to 3T3 cells.
The average diameter of the nanoparticles was estimated to be around 25 nm (Figure 1B). Furthermore, using a Nicolet 6700 FT-IR spectrometer, characteristic peaks at 1723 cm−1 from C=O and 1106 cm−1 from C-O-C in poly(oligo-ethylene glycol), 1450 cm−1 from phenyl ring C-C, 750, and 697 cm−1 from phenyl ring C-H in poly(styrene) were found (Figure 1C), indicating that the prepared NPs were composed of hydrophilic networks (poly(oligo-ethylene glycol) and hydrophobic domains (polystyrene).30 Next, IR750 and L012 were physically loaded into the NPs sequentially. Given its hydrophobic nature, IR750 was preferably entrapped into the polystyrene domains by the hydrophobic association. The loading efficiency of IR750 was estimated to be ~1.2 wt%. After removal of unloaded IR750 from these NPs, water-soluble L-012 was further trapped into hydrophilic networks of the NPs. The loading efficiency of L-012 was evaluated to be 45 wt% according to the standard curve of L-012 (y = 1.918x + 0.111, R2 = 0.999). In order to assess the cytotoxicity of the ratiometric ROS probe to cells, the MTT assay was conducted on 3T3 fibroblast cells (Figure 1D). The results suggested that the ratiometric ROS probe elicited no statistically significant cytotoxicity over the studied concentration range (up to 0.4 mg/ml), indicating that the ratiometric ROS probes were compatible with cells for further in vivo testing.
3.2. In vitro detection of ROS using the ratiometric ROS probe
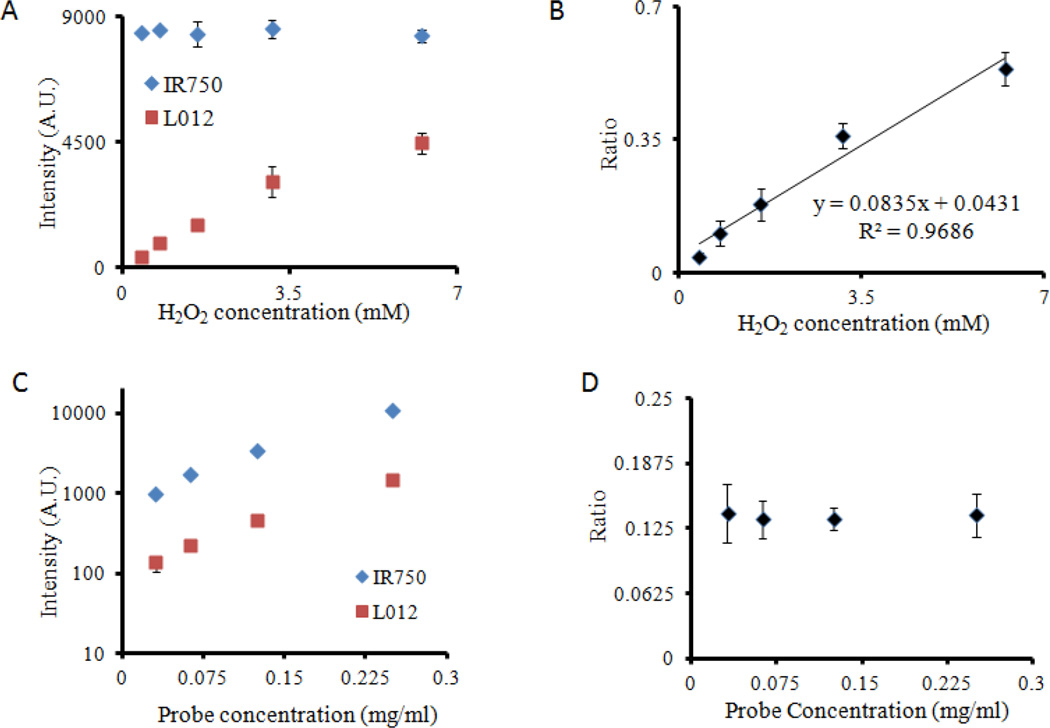
The ratiometric ROS probes were subsequently tested for ROS detection ability in vitro. First, constant-concentration probe was incubated with increasing concentrations of H2O2. We found that the increase in H2O2 concentrations intensified the production of chemiluminescent signals while exerting no influence on fluorescence intensity (Figure 2A). As expected, L-012 reacted with increasing concentrations of H2O2 to emit more luminescence. On the other hand, it has been shown that the hydrophobic microenvironment of polystyrenes is impermeable to water and oxidative agents26, 31, 32. Therefore, we believed that the presence of H2O2 would not be able to penetrate into the ROS probes’ polystyrene core and thus would have little or no influence of the fluorescence intensity of the physically-entrapped IR750. Most importantly, we found that the ratio of signal intensities between L-012 (chemiluminescence) and IR750 (fluorescence) had a linear relationship with H2O2 concentration ratio of 0.8347CH2O2 + 0.0431 and R2 = 0.97. (Figure 2B). This linear relationship allows quantitative measurement of H2O2 in an aqueous environment independent of probe concentrations.
Figure 2.
Functional characterization of ROS ratiometric probes in vitro. (A) After reacting with increasing concentration of [H2O2], the ROS probes emit increasing intensity of chemiluminescent signal, while the fluorescence intensities remain constant. (B) There is a linear relationship between chemiluminescence/fluorescence ratios and [H2O2] concentrations. (C) The increase in probe concentration intensifies both chemiluminescence and fluorescence intensities (D), while the chemiluminescence/fluorescence ratios stay unchanged.
Next, we investigated effect of probe concentrations on ratiometric measurements. It was observed that, with increasing probe concentrations (from 0.03 to 0.25 mg/ml), the intensities for L-012 (chemiluminescence) and IR750 (fluorescence) intensified (Figure 2C). However, the intensity ratios were nearly constant at ~0.14-fold, independent of the probe concentrations (Figure 2D). These results support our original design requirement that the H2O2 concentration measurements are not influenced by the amounts of ratiometric ROS probes.
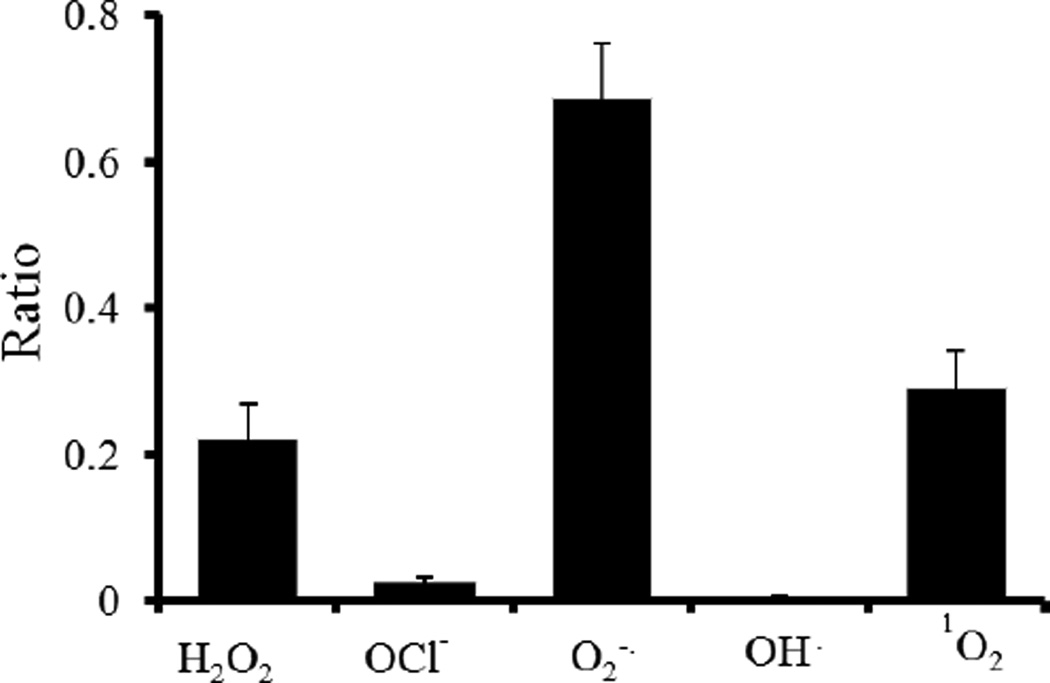
Finally, the sensitivity of the ratiometric ROS probe to different ROS species was investigated. Ratiometric ROS probes were exposed to various radical and non-radical ROS such as superoxide anion (O2•−), hydrogen peroxide (H2O2), singlet oxygen (1O2), and hypochlorite anion (OCl−). The reactions took place in PBS buffer using the same probe concentration, reaction volume, and reaction time. The intensity ratios between L-012 (chemiluminescence) and IR750 (fluorescence) were collected using a microplate reader. Our studies showed that the intensity ratios of ROS ratiometric probes to H2O2, OCl−, O2•−, OH·, and 1O2 radicals were 0.22, 0.03, 0.69, 0.005, 0.29, respectively. These results suggest that the ratiometric probe was sensitive to H2O2, O2•−, and 1O2 species and are in agreement with a previous study using L-012 alone.33
3.3. Effect of tissue depth on ratiometric imaging
It is well-established that tissue depth can affect optical measurements, including fluorescence and luminescence intensities.27 However, our studies have revealed that ratiometric imaging techniques can overcome the issue of depth-dependent imaging.27 To investigate whether the ratiometric probes can be used to measure ROS activity independent of tissue depth, we investigated whether the intensity ratio of L-012 (chemiluminescence) and IR750 (fluorescence) was affected by tissue depth in vitro. Skin phantoms with different thicknesses (0–5 mm) were prepared and placed in well bottoms of a 96-well plate according to the referenced method.34 Ratiometric ROS probes and H2O2 solution were placed on top of the phantoms, and fluorescence and chemiluminescence images were taken from underneath.
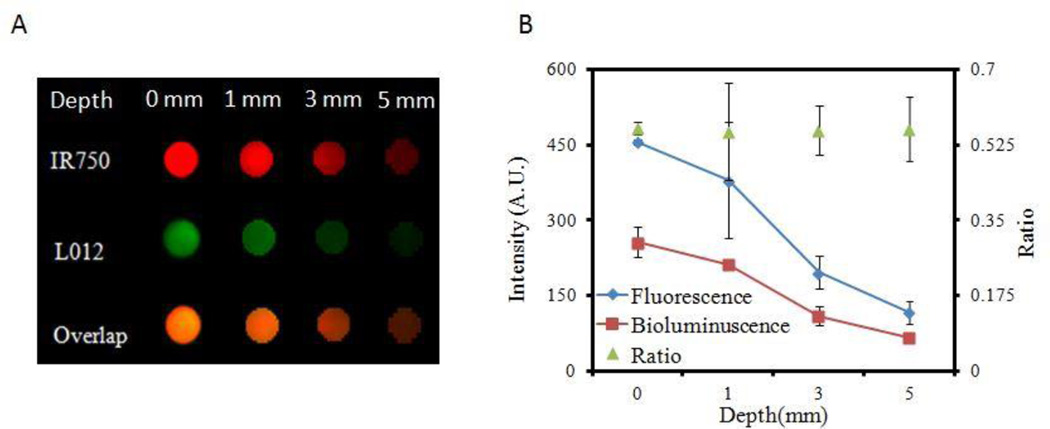
Using a Kodak In Vivo FX Pro System (Kodak, USA) (f/stop, 2.5; 4×4 binning), chemiluminescence images were taken with an exposure time of 5 min and fluorescent images were taken with an exposure time of 30 sec (excitation at 760 nm and emission at 830 nm) (Figure 4A). Mean chemiluminescence and fluorescence intensities for all pixels in the images were calculated using Carestream Molecular Imaging Software, Network Edition 4.5 (Carestream Health). As expected, both the chemiluminescence and fluorescence intensities decreased with increasing skin phantom thickness. Nevertheless, the intensity ratios between chemiluminescence and fluorescence intensities were nearly constant (~0.12) independent of skin-phantom thickness (Figure 4B). These results indicate that the probe may be used to detect and assess subcutaneous ROS activity in living animals in vivo.
Figure 4.
The effect of tissue thickness on ROS ratiometric probe measurements. (A) Image of fluorescence (IR750), chemiluminescence signals (L012), and overlap signals shows the decreasing signal intensities with increasing phantom tissue thicknesses. (B) Chemiluminescence/fluorescence ratios remain nearly constant at all tissue thicknesses.
3.4. In vivo imaging of ROS probe for the detection of subcutaneous inflammation/infection
The ability of the ratiometric ROS probe to detect subcutaneous ROS activities was investigated using two well-established animal models. First, to determine whether the ratiometric ROS probe can be used to detect wound-associated ROS activity in vivo, a murine incisional wound healing model was used based on an earlier work.35 Briefly, two topical incision wounds were created on the lower back. Uninjured skin (middle back section) was used as a control. After 24 hours, the ratiometric ROS probes were administered topically and fluorescent and luminescent images were captured using a Kodak In Vivo FX Pro System.
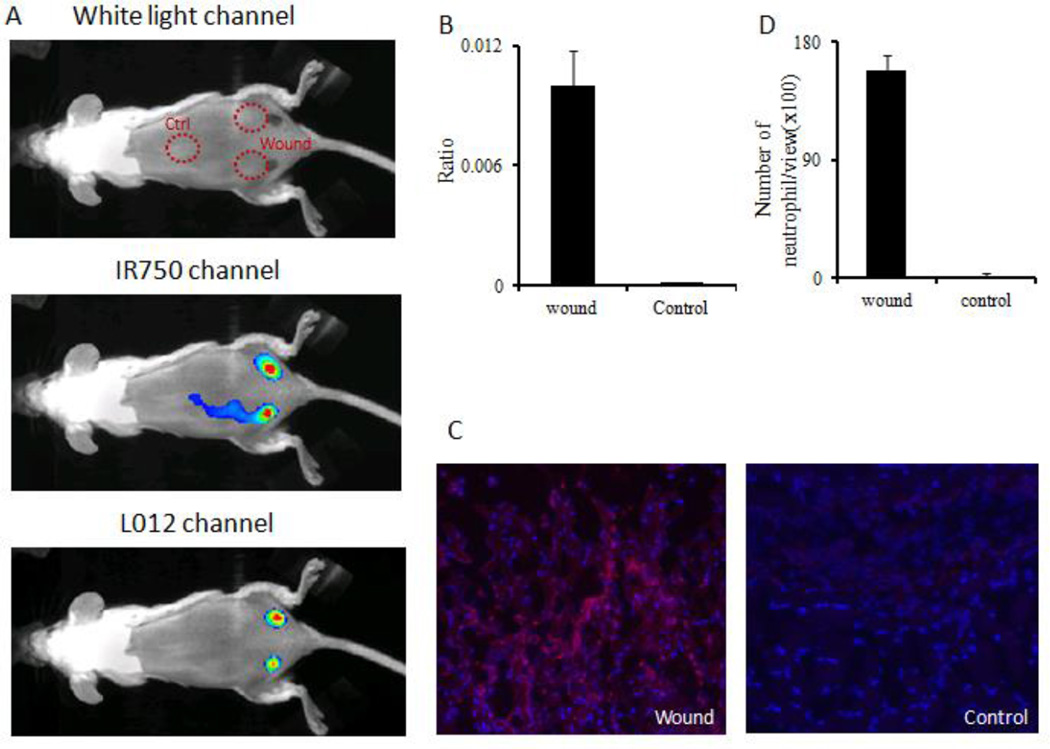
Our results showed strong fluorescent signal at the wound and control sites. However, negligible chemiluminescence was associated with the control (uninjured skin) while there were strong chemiluminescent signals at the wound site (Figure 5A). The intensity ratio (chemiluminescence/fluorescence) was found to be 75 times higher at the wound site compared to the control site (Figure 5B). To validate the results of ratiometric imaging, histological analyses of neutrophils in tissue were also carried out. As expected, the immunohistochemical analysis showed that many more neutrophils accumulated in wound sites than in the control sites (Figure 5C). Quantification of neutrophil numbers revealed that wound- associated inflammation triggered 90 times higher neutrophil accumulation than the control (Figure 5D). These results reveal that the ratiometric ROS probe can be used to non-invasively monitor real-time inflammation-induced ROS generation in vivo.
Figure 5.
ROS ratiometric probes were used to assess the extent of ROS activities on skin incision wounds. (A) White light/fluorescence/chemiluminescence images were taken from the animal 10 minutes after probe placement. (B) Quantification of chemiluminescence and fluorescence intensity ratios at the wound sites and control (uninjured) tissue. (C) Immunohistochemistry staining images taken on sections of wounded tissue and uninjured control tissue. (D) Quantification of neutrophil numbers in wound tissue and control tissue sections under microscope.
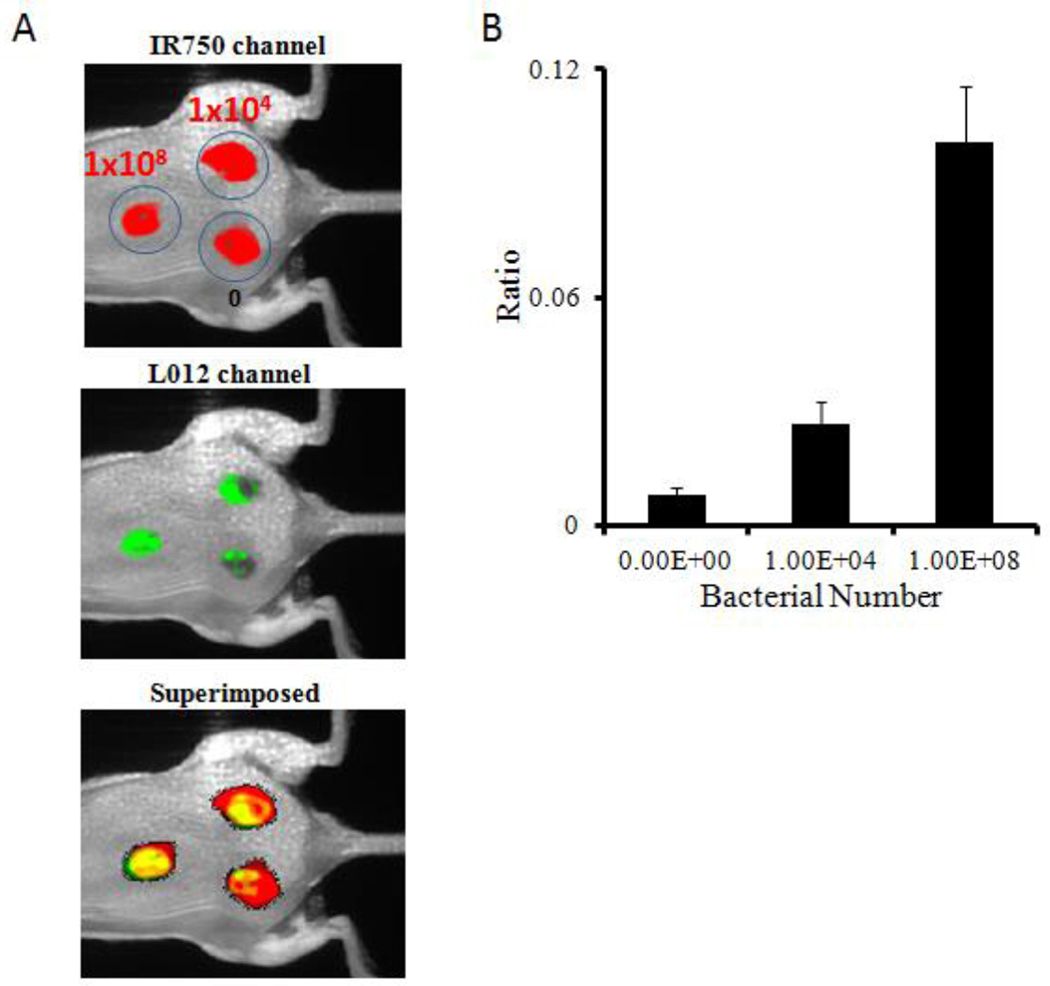
Next, an invasive skin infection model was employed to investigate the capability of the ratiometric ROS probe to assess ROS activities in infected wounds. To simulate infected wounds, different numbers (1 × 10⁴ –1 × 10⁸ /0.1 ml/ wound) of biofilm-forming strain RN6930 of Staphylococcus aureus (ATCC) were inoculated on top of 1-day wounds. After bacteria inoculation for 4 hours, ratiometric ROS probes were administered topically to the wound and surrounding tissues. Images were taken with a Kodak imaging system to determine the ROS response to the infected wounds. We observed drastic changes in ROS ratiometric imaging in vivo that strongly depended on the inoculated bacterial numbers. Ratios of ROS imaging were highest at sites with the largest numbers of inoculated bacteria, while the control site exhibited no significant ratiometric changes (Figure 6A). Quantitative analysis showed that for 1×10⁸ and 1×10⁴ cfu bacterial infectious wounds, intensity ratios increased 12 and 3 times higher than the control (Figure 6B). This data indicates that the extent of the wound infection can be successfully assessed by the ROS ratiometric imaging probe in real time in vivo. Areas with highest bacterial colonization also had the highest ROS activity levels.
Figure 6.
ROS ratiometric probes were evaluated on their ability to detect Staphylococcus aureus infected wounds. (A) Fluorescence (IR750 channel)/chemiluminescence (L-012 channel)/superimposed images were taken 10 minutes after probe placement. (B) Chemiluminescence and fluorescence intensity ratios at wound sites in the absence or presence of bacterial inoculation.
4. Conclusion
In summary, a ratiometric ROS probe has been developed as an optical nanoprobe to detect ROS activities in vitro and in vivo. In vitro studies demonstrated that the probe can be used to quantitatively measure ROS activities independent of probe concentration and tissue thicknesses. Using animal models of inflammatory and infected wounds, we found that the ROS probe could be used to assess the extent of neutrophil-mediated ROS activities and Staphylococcus aureus-induced wound infection in vivo. These observations taken together support that the ratiometric nanoprobes developed in this study can be used to identify inflammation resulting from the buildup of ROS produced by neutrophils at the site of disease or injury in vivo, in real time, and in a dose-independent manner. The results of this study strongly suggest that these probes have the potential to make the quantification of inflammation and infection in wounds easier, faster, and more manageable in a clinical setting, as well as to improve how infection management and chronic wound care and monitoring are handled by physicians. This technology has the potential to be incorporated into wound dressing for real time, fast, and noninvasive assessment of wound bed environment in patients with chronic and diabetic wounds.
Figure 3.
Intensity ratios of ROS probes reacted with different reactive oxygen species, such as H2O2, O2•−, and 1O2.
Acknowledgments
This work was supported by a National Institute of Health grant (AR064650) and a National Natural Science Foundation of China grant (NSFC 81328012).
References
- 1.Luster AD, Alon R, von Andrian UH. Immune cell migration in inflammation: present and future therapeutic targets. Nat. Immunol. 2005;6:1182–1190. doi: 10.1038/ni1275. [DOI] [PubMed] [Google Scholar]
- 2.Yager DR, Nwomeh BC. The proteolytic environment of chronic wounds. Wound Repair Regen. 1999;7:433–441. doi: 10.1046/j.1524-475x.1999.00433.x. [DOI] [PubMed] [Google Scholar]
- 3.Martin P, Leibovich SJ. Inflammatory cells during wound repair: the good, the bad and the ugly. Trends Cell Biol. 2005;15:599–607. doi: 10.1016/j.tcb.2005.09.002. [DOI] [PubMed] [Google Scholar]
- 4.Romson JL, Hook BG, Kunkel SL, Abrams GD, Schork MA, Lucchesi BR. Reduction of the extent of ischemic myocardial injury by neutrophil depletion in the dog. Circulation. 1983;67:1016–1023. doi: 10.1161/01.cir.67.5.1016. [DOI] [PubMed] [Google Scholar]
- 5.Camps M, Ruckle T, Ji H, Ardissone V, Rintelen F, Shaw J, Ferrandi C, Chabert C, Gillieron C, Francon B, Martin T, Gretener D, Perrin D, Leroy D, Vitte PA, Hirsch E, Wymann MP, Cirillo R, Schwarz MK, Rommel C. Blockade of PI3Kgamma suppresses joint inflammation and damage in mouse models of rheumatoid arthritis. Nat. Med. 2005;11:936–943. doi: 10.1038/nm1284. [DOI] [PubMed] [Google Scholar]
- 6.Clark RA. Activation of the neutrophil respiratory burst oxidase. J. Infect. Dis. 1999;179(Suppl. 2):S309–S317. doi: 10.1086/513849. [DOI] [PubMed] [Google Scholar]
- 7.Wright HL, Moots RJ, Bucknall RC, Edwards SW. Neutrophil function in inflammation and inflammatory diseases. Rheumatology. 2010;49:1618–1631. doi: 10.1093/rheumatology/keq045. [DOI] [PubMed] [Google Scholar]
- 8.Zhou J, Tsai YT, Weng H, Tang L. Noninvasive assessment of localized inflammatory responses. Free Radical Biol. Med. 2012;52:218–226. doi: 10.1016/j.freeradbiomed.2011.10.452. [DOI] [PMC free article] [PubMed] [Google Scholar]
- 9.Halliwell B, Whiteman M. Measuring reactive species and oxidative damage in vivo and in cell culture: how should you do it and what do the results mean? Br. J. Pharmacol. 2004;142:231–255. doi: 10.1038/sj.bjp.0705776. [DOI] [PMC free article] [PubMed] [Google Scholar]
- 10.Chu W, Chepetan A, Zhou D, Shoghi KI, Xu J, Dugan LL, Gropler RJ, Mintun MA, Mach RH. Development of a PET radiotracer for non-invasive imaging of the reactive oxygen species, superoxide, in vivo. Org. Biomol. Chem. 2014;12:4421–4431. doi: 10.1039/c3ob42379d. [DOI] [PMC free article] [PubMed] [Google Scholar]
- 11.Abe K, Takai N, Fukumoto K, Imamoto N, Tonomura M, Ito M, Kanegawa N, Sakai K, Morimoto K, Todoroki K, Inoue O. In vivo imaging of reactive oxygen species in mouse brain by using [H]Hydromethidine as a potential radical trapping radiotracer. J. Cereb. Blood Flow Metab. 2014;34:1907–1913. doi: 10.1038/jcbfm.2014.160. [DOI] [PMC free article] [PubMed] [Google Scholar]
- 12.Hyun H, Lee K, Min KH, Jeon P, Kim K, Jeong SY, Kwon IC, Park TG, Lee M. Ischemic brain imaging using fluorescent gold nanoprobes sensitive to reactive oxygen species. J. Control. Release. 2013;170:352–357. doi: 10.1016/j.jconrel.2013.06.002. [DOI] [PubMed] [Google Scholar]
- 13.Burks SR, Ni J, Muralidharan S, Coop A, Kao JP, Rosen GM. Optimization of labile esters for esterase-assisted accumulation of nitroxides into cells: a model for in vivo EPR imaging. Bioconjugate chem. 2008;19:2068–2071. doi: 10.1021/bc8001562. [DOI] [PMC free article] [PubMed] [Google Scholar]
- 14.Driever SM, Fryer MJ, Mullineaux PM, Baker NR. Imaging of reactive oxygen species in vivo. Methods Mol. Biol. 2009;479:109–116. doi: 10.1007/978-1-59745-289-2_7. [DOI] [PubMed] [Google Scholar]
- 15.Panizzi P, Nahrendorf M, Wildgruber M, Waterman P, Figueiredo JL, Aikawa E, McCarthy J, Weissleder R, Hilderbrand SA. Oxazine conjugated nanoparticle detects in vivo hypochlorous acid and peroxynitrite generation. J. Am. Chem. Soc. 2009;131:15739–15744. doi: 10.1021/ja903922u. [DOI] [PMC free article] [PubMed] [Google Scholar]
- 16.Shulaev V, Oliver DJ. Metabolic and proteomic markers for oxidative stress. New tools for reactive oxygen species research. Plant Physiol. 2006;141:367–372. doi: 10.1104/pp.106.077925. [DOI] [PMC free article] [PubMed] [Google Scholar]
- 17.Frangioni JV. In vivo near-infrared fluorescence imaging. Curr. Opin. Chem. Biol. 2003;7:626–634. doi: 10.1016/j.cbpa.2003.08.007. [DOI] [PubMed] [Google Scholar]
- 18.Roda A, Guardigli M, Pasini P, Mirasoli M, Michelini E, Musiani M. Bio- and chemiluminescence imaging in analytical chemistry. Anal. Chim. Acta. 2005;541:25–36. [Google Scholar]
- 19.de Chermont QL, Chaneac C, Seguin J, Pelle F, Maitrejean S, Jolivet JP, Gourier D, Bessodes M, Scherman D. Nanoprobes with near-infrared persistent luminescence for in vivo imaging. Proc. Natl. Acad. Sci. U. S. A. 2007;104:9266–9271. doi: 10.1073/pnas.0702427104. [DOI] [PMC free article] [PubMed] [Google Scholar]
- 20.Lee D, Khaja S, Velasquez-Castano JC, Dasari M, Sun C, Petros J, Taylor WR, Murthy N. In vivo imaging of hydrogen peroxide with chemiluminescent nanoparticles. Nat. Mater. 2007;6:765–769. doi: 10.1038/nmat1983. [DOI] [PubMed] [Google Scholar]
- 21.Kielland A, Blom T, Nandakumar KS, Holmdahl R, Blomhoff R, Carlsen H. In vivo imaging of reactive oxygen and nitrogen species in inflammation using the luminescent probe L-012. Free Radical Biol. Med. 2009;47:760–766. doi: 10.1016/j.freeradbiomed.2009.06.013. [DOI] [PubMed] [Google Scholar]
- 22.Ganea GM, Kolic PE, El-Zahab B, Warner IM. Ratiometric coumarin-neutral red (CONER) nanoprobe for detection of hydroxyl radicals. Anal. Chem. 2011;83:2576–2581. doi: 10.1021/ac102874x. [DOI] [PMC free article] [PubMed] [Google Scholar]
- 23.King M, Kopelman R. Development of a hydroxyl radical ratiometric nanoprobe. Sens. Actuators, B. 2003;90:76–81. [Google Scholar]
- 24.Wang SG, Li N, Pan W, Tang B. Advances in functional fluorescent and luminescent probes for imaging intracellular small-molecule reactive species, TrAC. Trends Anal. Chem. 2012;39:3–37. [Google Scholar]
- 25.Ji T, Muenker MC, Papineni RV, Harder JW, Vizard DL, McLaughlin WE. Increased sensitivity in antigen detection with fluorescent latex nanosphere-IgG antibody conjugates. Bioconjugate Chem. 2010;21:427–435. doi: 10.1021/bc900295v. [DOI] [PubMed] [Google Scholar]
- 26.Zhou J, Tsai YT, Weng H, Baker DW, Tang L. Real time monitoring of biomaterial-mediated inflammatory responses via macrophage-targeting NIR nanoprobes. Biomaterials. 2011;32:9383–9390. doi: 10.1016/j.biomaterials.2011.08.064. [DOI] [PMC free article] [PubMed] [Google Scholar]
- 27.Tsai YT, Zhou J, Weng H, Shen J, Tang L, Hu WJ. Real-time noninvasive monitoring of in vivo inflammatory responses using a pH ratiometric fluorescence imaging probe. Adv. Healthc. Mater. 2014;3:221–229. doi: 10.1002/adhm.201200365. [DOI] [PubMed] [Google Scholar]
- 28.Kim WS, Park BS, Sung JH, Yang JM, Park SB, Kwak SJ, Park JS. Wound healing effect of adipose-derived stem cells: a critical role of secretory factors on human dermal fibroblasts. J. Dermatol. Sci. 2007;48:15–24. doi: 10.1016/j.jdermsci.2007.05.018. [DOI] [PubMed] [Google Scholar]
- 29.Zhou J, Tsai YT, Weng H, Tang EN, Nair A, Dave DP, Tang L. Real-time detection of implant-associated neutrophil responses using a formyl peptide receptor-targeting NIR nanoprobe. Int. J. Nanomedicine. 2012;7:2057–2068. doi: 10.2147/IJN.S29961. [DOI] [PMC free article] [PubMed] [Google Scholar]
- 30.Abbasian M, Bonab SES, Shoaeifar P, Entezami AA. Synthesis and characterization of amphiphilic methoxypoly(ethylene glycol)-polystyrene diblock copolymer by ATRP and NMRP techniques. J. Elastom. Plast. 2012;44:205–220. [Google Scholar]
- 31.Zhang J, Chen H, Xu L, Gu Y. The targeted behavior of thermally responsive nanohydrogel evaluated by NIR system in mouse model. J. Control. Release. 2008;131:34–40. doi: 10.1016/j.jconrel.2008.07.019. [DOI] [PubMed] [Google Scholar]
- 32.Wu C, Szymanski C, McNeill J. Preparation and encapsulation of highly fluorescent conjugated polymer nanoparticles. Langmuir. 2006;22:2956–2960. doi: 10.1021/la060188l. [DOI] [PubMed] [Google Scholar]
- 33.Imada I, Sato EF, Miyamoto M, Ichimori Y, Minamiyama Y, Konaka R, Inoue M. Analysis of reactive oxygen species generated by neutrophils using a chemiluminescence probe L-012. Anal. Biochem. 1999;271:53–58. doi: 10.1006/abio.1999.4107. [DOI] [PubMed] [Google Scholar]
- 34.Genina EA, Bashkatov AN, Tuchin VV. Proc. SPIE 4609, Lasers in Surgery: Advanced Characterization, Therapeutics, and Systems Xii. San Jose, CA: 2002. Jan, In vitro study of Methylene Blue diffusion through the skin tissue. 29–36. [Google Scholar]
- 35.Ashcroft GS, Horan MA, Ferguson MWJ. Aging is associated with reduced deposition of specific extracellular matrix components, upregulation of angiogenesis, and an altered inflammatory response in a murine incisional wound healing model. J. Invest. Dermatol. 1997;108:430–437. doi: 10.1111/1523-1747.ep12289705. [DOI] [PubMed] [Google Scholar]


