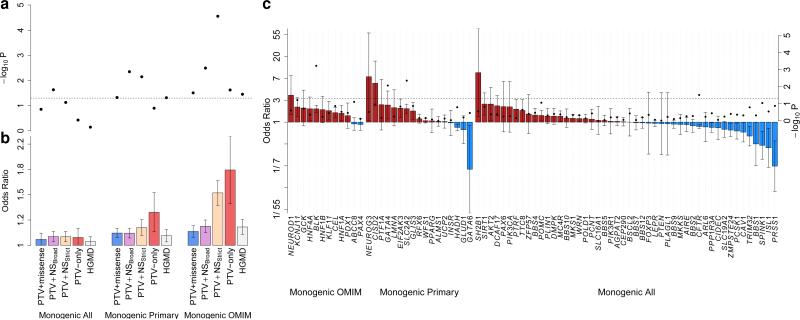
Figure 2. Association between T2D and variants in genes for Mendelian forms of diabetes.
a, p-values of aggregate association for variants from 6,504 T2D cases and 6,436 controls in three sets of Mendelian diabetes genes, for five variant “masks” (Methods). Dotted line: p=0.05. b, Estimated T2D odds ratio (OR) for carriers of variants in each gene-set and mask. Error bars: one standard error. c, Estimated ORs (bars, left axis) and p-values (dots, right axis) for carriers of variants in the PTV+NSstrict mask for each gene. Error bars: one standard error. Red: OR > 1; blue: OR < 1; dotted line: p=0.05.

