

Abstract
Suppressor of cytokine signaling-3 (SOCS3) expression is induced by the Janus kinase (JAK)-signal transducer and activator of transcription 3 (STAT3) signaling pathway. SOCS3 then acts as a feedback inhibitor of JAK-STAT signaling. Previous studies have shown that knocking down SOCS3 in spinal cord neurons with Lentiviral delivery of SOCS3-targeting shRNA (shSOCS3) increased spinal cord injury (SCI)-induced tyrosine phosphorylation of STAT3 (P-STAT3 Tyr), which in part contributed to decreased neuronal death and demyelination as well as enhanced dendritic regeneration and protection of neuronal morphology after SCI. However, the role of serine phosphorylation of STAT3 (P-STAT3 Ser) is in large part undetermined. Our purposes of this study were to evaluate the expression patterns of P-STAT3 Ser and to explore the possible role of SOCS3 in the regulation of P-STAT3 Ser expression. Immunoblot analyses demonstrated that Oncostatin M (OSM), a member of the interleukin-6 (IL-6) cytokine family, induced both P-STAT3 Tyr and P-STAT3 Ser in SH-SY5Y cells. Subcellular fractionation further revealed that P-STAT3 Ser was localized in mitochondria. Overexpression of SOCS3 with a Lentivirus-mediated approach in SH-SY5Y cells inhibited OSM-induced P-STAT3 Ser in both cytosol and mitochondria fractions. In contrast, OSM-induced P-STAT3 Ser was further upregulated in both cytosol and mitochondria when SOCS3 was knocked down by Lentivirus-delivered shSOCS3. Using a rat T8 spinal cord complete transection model, we found that SCI induced upregulation of P-STAT3 Ser in the mitochondria of macrophages/microglia and neurons both rostral and caudal to the injury site of spinal cord. Collectively, these results suggest that SOCS3 regulation of STAT3 signaling plays critical roles in stress conditions.
Keywords: Suppressors of Cytokine Signaling-3, short hairpin RNA, signal transducer and activator of transcription 3, plasticity, spinal cord injury
1. Introduction
Many axons fail to regenerate after central nervous system (CNS) injury, which leads to permanent neurologic deficits and eventually functional disability (Ferguson and Son, 2011). Failure of CNS neuronal regeneration is attributed to many inhibitory molecules found in the injured CNS (Luo and Park, 2012), such as suppressors of cytokine signaling (SOCS) (Baker et al., 2009). Of the different SOCS members, suppressor of cytokine signaling-3 (SOCS3) has attracted considerable recent attention due to its prominent role in limiting cytokine-mediated axon regeneration (Miao et al., 2006; Newbern et al., 2009). Overexpression of SOCS3 has been shown to block nuclear translocation of signal transducer and activator of transcription 3 (STAT3) and neurite outgrowth of dorsal root ganglia (DRG) neurons (Miao et al., 2006). STAT3 phosphorylated at Tyr 705 (P-STAT3 Tyr) acts as a transcriptional activator for many target genes. STAT3 can also be phosphorylated at Ser 727 (P-STAT3 Ser) (Wegrzyn et al., 2009; Zouein et al., 2015). P-STAT3 Ser is found in mitochondria when STAT3 is activated (Wegrzyn et al., 2009). Mitochondrial P-STAT3 Ser regulates metabolic functions in mitochondria to support growth of certain types of cancer cells (Gough et al., 2009). More recently, mitochondrial P-STAT3 Ser was shown to facilitate neurite outgrowth in response to nerve growth factor (NGF) (Zhou and Too, 2011).
Expression of SOCS3 in neurons plays a negative role in regulating cell survival and neurite outgrowth and is upregulated after SCI (Miao et al., 2006; Park et al., 2014; Park et al., 2015). Following axonal injury, SOCS3 is upregulated rapidly in injured neurons (Fischer et al., 2004; Park et al., 2009) by cytokines of the interleukin-6 (IL-6) family via STAT3 activation (Baker et al., 2009). The upregulated SOCS3 acts through a feedback mechanism to inhibit the Janus kinase (JAK)- STAT3 signaling in the cytosol (Miao et al., 2006; Newbern et al., 2009). In the visual system, deletion of SOCS3 alone in adult retinal ganglion cells (RGCs) promotes limited axon regeneration (Newbern et al., 2009; Park et al., 2008; Smith et al., 2009). These results coincided with our previous findings that T8 spinal cord complete transection induces both SOCS3 and P-STAT3 Tyr705 (P-STAT3 Tyr) in vivo. Knocking down SOCS3 reduced spinal cord injury (SCI)-induced neuronal death and demyelination (Park et al., 2014; Park et al., 2015). Furthermore, knocking down SOCS3 with Lentiviral-delivered short hairpin RNAs (shRNAs) (shSOCS3) protected neuronal morphological features and enhanced dendritic regeneration after SCI (Park et al., 2014; Park et al., 2015), which might be attributable to increased P-STAT3 Tyr.
Although a number of studies have reported that SOCS3 inhibits P-STAT3 Tyr as a negative regulator to terminate signaling (Miao et al., 2006; Newbern et al., 2009; Park et al., 2014; Park et al., 2015), regulation of P-STAT3 Ser by SOCS3 is poorly understood. The present study addressed these issues, using immunoblot analyses of P-STAT3 Ser levels in SH-SY5Y neuroblastoma cells after stimulation with Oncostatin M (OSM), a member of the IL-6 cytokine family. Subsequent experiments used an animal model of SCI and harvested spinal cord tissues to test whether the effects described in SH-SY5Y cells were similarly elicited in the CNS, particularly after SCI. Together, the results from these studies demonstrate that upregulated P-STAT3 Ser is located in mitochondria and is negatively regulated by SOCS3, a critical regulator for the development of secondary damage after SCI.
2. Materials and methods
2.1. SH-SY5Y cell cultures
The human neuroblastoma cell line SH-SY5Y (ATCC, Manassas, VA) (Lai et al, 2006; (Park et al., 2012) was grown in DMEM/F12 with 10% fetal bovine serum, 2 mM L-Glutamine, and 1% penicillin-streptomycin. For SH-SY5Y cell differentiation, cells were grown in fresh medium containing 10 μM all-trans retinoic acid for 5 days. Recombinant OSM (10 ng/ml; R&D Systems; Minneapolis, MN) was added to cells for the times indicated in the individual figure. Protein lysates were prepared and subjected to subcellular fractionation, followed by immunoblot analyses.
2.2. SOCS3 overexpression or knockdown by Lentiviral vector production and infection
To overexpress SOCS3, the human SOCS3 open reading frame was cloned into the Lentiviral vector pLVX-IRES-ZsGreen (pLVX; Invitrogen, Grand Island, NY) to generate SOCS3/pLVX-IRES-ZsGreen (SOCS3/pLVX) (Park et al., 2012). To knock down SOCS3 expression, a Lentiviral plasmid pGipz, encoding shRNA specific for SOCS3 (shSOCS3/pGipz), was purchased from Open Biosystems (Lafayette, CO). Lentiviral particles were generated by calcium phosphate-mediated co-transfection of HEK-293T cells with pLVX, SOCS3/pLVX, pGipz, or shSOCS3/pGipz, together with psPAX2 (packaging plasmid) and pMD2G (envelope plasmid). Virus was collected after 72 h and titers up to 3–4×10⁷ infectious units/ml were obtained (Park et al., 2014; Park et al., 2015). SH-SY5Y cells were infected with Lentivirus delivering pLVX, SOCS3/pLVX, pGipz, or shSOCS3/pGipz, sorted by FACS analysis using green fluorescence protein (GFP) expression, and stored at −80°C (Park et al., 2012).
2.3. Animals
Adult female Sprague–Dawley rats (220–250 g; Harlan Laboratories, Madison, WI) were divided randomly into two groups: (1) sham control group (CON; laminectomy only; n = 12) or (2) T8 spinal cord transection (Tx) group (n = 18). Rats were housed in standard laboratory cages with a 12:12 hour light/dark cycle with standard rodent chow and water available ad libitum. All experiments were performed during the light cycle. All animal procedures were approved by the Cleveland Clinic Institutional Animal Care and Use Committee (IACUC).
2.4. Spinal cord injury
All surgical procedures were conducted under aseptic conditions. Before surgery, all animals were anesthetized with 2% isoflurane gas mixed with oxygen. Rats were maintained on a heating pad and rectal temperature was monitored and maintained at 36.5±1.5°C during surgery. Animals in the CON group underwent a laminectomy only (T8 level). In the Tx group, a laminectomy was followed by complete transverse cuts of the spinal cord at the T8 level, resulting in a gap of ~2–3 mm. A surgical microscope was used to ensure the complete removal of neural tissue, including fiber bundles. Muscle and skin layers were closed with 2–0 sutures. The bladders of all spinal cord-transected rats were expressed manually twice per day throughout the experimental period (Park et al., 2014; Park et al., 2015).
2.5. Isolation of mitochondria and cytosol
Subcellular fractionation of mitochondria and cytosol from cultured SH-SY5Y cells was accomplished using a mitochondrial isolation kit (Thermo scientific, Waltham, MA) according to the manufacturer’s guidelines. Briefly, SH-SY5Y cells at the indicated time points after treatment were washed with ice-cold phosphate-buffered saline (PBS) and harvested. The cultured cells were centrifuged and mitochondria were extracted from the cell suspensions. The resulting supernatants and pellets were designated as the cytosolic and mitochondrial fractions, respectively. Equal amounts of protein (30 μg) were mixed with loading buffer (0.125 M Tris-HCl, pH 6.8, 20% glycerol, 4% SDS, 10% mercaptoethanol, and 0.002% bromophenol blue), boiled for 5 min, and separated by SDS-PAGE. For in vivo studies, spinal cord tissues were harvested from regions 5 mm rostral or caudal to the epicenter at the indicated time points after complete SCI and then subjected to subcellular fractionation of mitochondria and cytosol according to the manufacturer’s guidelines.
2.6. Immunoblotting
Cultures treated with OSM were lysed in buffer containing the following: 150 mM NaCl, 10 mM Na2HPO4 (pH 7.2), 0.5% sodium deoxycholate, 1% NP-40, and protease inhibitor mixture. Forty μg of total cell lysate was separated by electrophoresis on 8% SDS-polyacrylamide gels and blotted with antibodies against P-STAT3 Tyr, P-STAT3 Ser, total STAT3, β-actin (Cell Signaling Technology; Beverly, MA), GAPDH, and ATP5A (Abcam; Cambridge, MA) (Park et al., 2014; Park et al., 2015; Park et al., 2012). Immunoreactivity was assessed using Pierce ECL® or SuperSignal® West Dura substrate (Thermo Scientific, Rockford, IL). For quantitative analyses, the densities of bands on immunoblots were measured with ImageJ software. For in vivo studies, spinal cord tissues were obtained from areas 5 mm rostral or caudal to the injury at the designated time point after SCI. The tissues were homogenized in ice-cold lysis buffer and equal amounts of protein (40 μg) were separated by SDS-PAGE. The blots were then incubated with antibodies and developed as described previously (Park et al., 2014; Park et al., 2015).
2.7. Immunostaining of spinal cord tissue
Animals were anesthetized at time points indicated for individual experiments after SCI or sham procedures and then transcardially perfused with 0.9% saline followed by 4% paraformaldehyde. Spinal cords were removed, post-fixed overnight at 4°C in 4% paraformaldehyde, and stored at 4°C in 30% sucrose solution until sinking. The spinal cord segments 5 mm rostral or caudal to the injured site were then transversely sectioned on a cryostat (30 μm) and collected for immunohistochemistry (Park et al., 2014; Park et al., 2015). Briefly, free-floating serial sections were washed three times for 10 min with PBS and blocked with PBS containing 3% normal horse serum and 0.25% Triton X-100 for 1 h at room temperature. Sections were then incubated overnight with gentle agitation at room temperature with PBS containing 0.5% BSA in the following antibody combinations: (1) P-STAT3 Ser (1:1000) and neuronal-specific nuclear protein NeuN (1:5000; EMD Millipore, Billerica, MA) for neurons, (2) P-STAT3 Ser and ED1 (1:1000; Thermo Scientific, Rockford, IL) for macrophages/microglia, and (3) P-STAT3 Ser and glial fibrillary acidic protein (GFAP) for astrocytes (1:4000; Dako, Glostrup, Denmark). Sections were then washed with PBS and incubated for 1 h at room temperature with a secondary antibody conjugated by Alexa Flour 488 or 594 as appropriate (1:2,000; Life Technologies, Grand Island, NY). Tissues were then washed and mounted with Vectashield mounting medium (Vector Laboratory, Burlingame, CA). Sections were examined and all images were taken using a fluorescent microscope (DM6000; Leica Microsystems, Buffalo Grove, IL).
2.8. Statistical analysis
All experiments were performed utilizing three different passages of SH-SY5Y cells or tissues from individual animals, and repeated at least three times separately. All values are expressed as mean ± SEM. Statistical significance (p<0.05 for all analyses) was assessed by ANOVAs using GraphPad Prism 5.01 (GraphPad, San Diego, CA), followed by Student–Newman–Keuls analyses.
3. Results
3.1. OSM differentially induces P-STAT3 Tyr and P-STAT3 Ser in SH-SY5Y cells
SOCS3 expression is induced by cytokines from the IL-6 family via STAT3 activation (Baker et al., 2009). A number of studies have reported that SOCS3 inhibits P-STAT3 Tyr as a negative regulator to terminate JAK-STAT3 signaling. However, the detailed mechanisms underlying the effects of SOCS3 on STAT3 activation, in particular the expression of P-STAT3 Ser, remain to be elucidated. In order to investigate how SOCS3 regulates P-STAT3 Ser, which is an indicator of STAT3 activation, the expression of P-STAT3 Ser by SH-SY5Y cells after stimulation with OSM was first assessed by immunoblotting.
Immunoblotting analyses of SH-SY5Y cells demonstrated that OSM significantly induced P-STAT3 Tyr within 30 min, which was maintained up to 1 h and then quickly declined toward baseline levels (Figs. 1A and B). Basal levels of P-STAT3 Ser were observed in SH-SY5Y cells, which were significantly enhanced by OSM at 0.5 and 1 h and then gradually declined toward baseline levels (Figs. 1A and B). However, the levels of total STAT3 were only slightly altered in response to OSM stimulation, suggesting that activation of STAT3, as indicated by increased levels of both P-STAT3 Tyr and P-STAT3 Ser, was enhanced by OSM in SH-SY5Y cells.
Fig. 1.

OSM upregulates P-STAT3 Ser in mitochondria of SH-SY5Y cells. (A) SH-SY5Y cells were treated with OSM (10 ng/ml) for the times indicated. Total cell lysates were prepared and subjected to immunoblot analyses with antibodies against P-STAT3 Ser, P-STAT3 Tyr, total STAT3, and β-actin. (B) The densitometric ratios of P-STAT3 Ser or P-STAT3 Tyr versus STAT3 were calculated and are shown as fold increase. Graphs represent the mean ± SEM for triplicate cultures in three separate experiments. ***p<0.001, **p<0.01, and *p<0.05 compared to control, untreated cultures (CON). (C) STAT3 was localized in both cytosol and mitochondria. Cell lysates from control cultures (CON) were separated into cytosol (Cyt)- and mitochondria (Mit)-enriched fractions. Fractionated lysates were analyzed by immunoblotting with P-STAT3 Ser, P-STAT3 Tyr, total STAT3, ATP5A, and GAPDH antibodies. The purity of isolated fractions was verified by ATP5A and GAPDH. (D) Mitochondrial fractions were extracted and analyzed by immunoblotting with antibodies against P-STAT3 Ser, P-STAT3 Tyr, total STAT3, and ATP5A. (E) The densitometric ratios of P-STAT3 Ser versus total STAT3 were calculated and shown as fold increase. ***p<0.001 compared to control cultures (CON).
Recent studies reported that P-STAT3 Ser is localized in mitochondria in neurons, which is independent of transcriptional regulation (Wegrzyn et al., 2009; Zouein et al., 2015). For this reason, we investigated whether OSM-induced P-STAT3 Ser is localized in mitochondria in SH-SY5Y cells. Cultured cells harvested at different time points after OSM treatment were separated into mitochondrial and cytosolic fractions and examined by immunoblotting. To confirm the isolated mitochondria were not contaminated with cytosol, ATP 5A and GAPDH were used as markers for the mitochondrial and cytosolic fractions, respectively. The results showed that control SH-SY5Y cells without stimulation with OSM had total STAT3 in both the mitochondrial and cytosolic fractions (Fig. 1C). Interestingly, P-STAT3 Ser was also detectable in both mitochondrial and cytosolic fractions in control cells without OSM stimulation, whereas P-STAT3 Tyr was not detectable in control cells in either fraction (Fig. 1C). Immunoblot analyses further showed that mitochondrial P-STAT3 Ser was significantly increased 30 min after OSM treatment, and then declined toward basal levels (Figs. 1D and E), while OSM-induced P-STAT3 Tyr was not found in mitochondria (Fig. 1D).
3.2. SOCS3 negatively regulated OSM-induced P- STAT3 Ser in mitochondria
Basal expression levels of SOCS3 mRNA are very low in untreated control SH-SY5Y cells; however, both SOCS3 mRNA and protein expression are induced between 1–8 h in SH-SY5Y cells upon OSM treatment (data not shown). In addition, our previous results have demonstrated that decreasing SOCS3 expression with Lentiviral delivery of shRNA (shSOCS3) enhanced IL-6-induced P-STAT3 Tyr and promoted neurite outgrowth in vitro (Park et al., 2015). These data indicate that suppression of SOCS3, which is both a target gene and a negative regulator of STAT3, is frequently associated with sustained activation of the IL-6/STAT3 pathway (Yuan et al., 2016). We therefore tested whether SOCS3 expression influences P- STAT3 Ser, a STAT3 activation state that is not related to P-STAT3 Tyr or its transcriptional functions. To overexpress SOCS3, SH-SY5Y cells were infected with Lentivirus carrying SOCS3/pLVX (SOCS3/pLVX) or pLVX (as a control) and then treated with OSM. As shown in Figure 2A, overexpression of SOCS3 decreased basal levels of P-STAT3 Ser in SH-SY5Y cells (Figs. 2A and B). Such negative regulatory effects of Lentivirus-mediated SOCS3 overexpression on P- STAT3 Ser were even more significant when SH-SY5Y cells were treated with OSM for 0.5 h (Figs. 2A and B). These results indicate that levels of P-STAT3 Ser were decreased when SOCS3 was overexpressed. In SOCS3 knockdown experiments, SH-SY5Y cells infected with Lentivirus delivering shRNA to target SOCS3 (shSOCS3/pGipz) or control Lentivirus (pGipz) were treated with OSM for either 0.5 or 1 h. qRT-PCR analysis showed that shSOCS3/pGipz led to significant inhibition of OSM-induced SOCS3 mRNA expression (data not shown). Infection of Lentivirus with shSOCS3/pGipz significantly increased OSM induced- P-STAT3 Ser (Figs. 2C and D) compared to cells infected with control Lentivirus carrying pGipz (Figs. 2C and D). Similarly, SOCS3 knockdown effects were also observed in untreated cells, as basal levels of P-STAT3 Ser were increased (Figs. 2C and D). Results from Lentivirus-mediated modulation of SOCS3 levels demonstrated that STAT3 activation, in particular of P-STAT3 Ser levels, was negatively regulated by expression of SOCS3.
Fig. 2.

SOCS3 inhibits OSM-upregulated P-STAT3 Ser in SH-SY5Y Cells. (A) SH-SY5Y cells were infected with Lentivirus without (−) or with (+) SOCS3/pLVX to overexpress SOCS3. After infection, SH-SY5Y cells were treated without (CON) or with OSM (OSM) for 0.5 h and total cell lysates were subjected to immunoblot analyses with antibodies against P-STAT3 Ser, total STAT3, and GAPDH. (B) The densitometric ratios of P-STAT3 Ser versus total STAT3 were calculated and are shown as fold increase. Graph represents the mean ± SEM of triplicate cultures in four separate experiments. *p<0.05, and ***p<0.001 compared to individual groups without OSM treatment (CON). (C) SH-SY5Y cells were infected with Lentivirus carrying shSOCS3/pGipz (shSOCS3/pGipz) to knock down SOCS3 or pGipz (pGipz) as a control, and then treated with OSM for 0.5 or 1 h. Total cell lysates were immunoblotted as described above. (D) The densitometric ratios of P-STAT3 Ser versus total STAT3 were calculated and are shown as fold increase. Graph represents the mean ± SEM of triplicate cultures in four separate experiments. *p<0.05, and ***p<0.001 compared to individual groups without OSM treatment (CON).
Thus far, we have shown that both STAT3 and P-STAT3 Ser were found in both cytosolic and mitochondrial fractions (Fig. 1). Furthermore, mitochondrial P-STAT3 Ser was significantly increased by OSM stimulation in SH-SY5Y cells (Fig. 1). In addition, results from Lentiviral infection of SH-SY5Y cells to manipulate SOCS3 expression showed that SOCS3 negatively regulates the levels of P-STAT3 Ser in total cell lysates (Fig. 2). We therefore hypothesized that SOCS3 could regulate levels of P-STAT3 Ser in mitochondria. To test this, SH-SY5Y cells infected with Lentivirus delivering SOCS3 (SOCS3/pLVX) or pLVX only (as a control) were treated with OSM for 0.5 h. Total cell lysates were further separated into mitochondrial fractions by subcellular fractionation. OSM treatment increased P-STAT3 Ser in mitochondria of cells infected with control Lentivirus (pLVX) (Figs. 3A and B). However, both endogenous and OSM-induced mitochondrial P-STAT3 Ser were significantly inhibited when SOCS3 was overexpressed through infection of SH-SY5Y cells with Lentivirus carrying SOCS3/pLVX (Figs. 3A and B).
Fig. 3.

OSM upregulation of mitochondrial P-STAT3 Ser is inhibited by SOCS3. (A) After infection with Lentivirus delivering pLVX (pLVX) as a control or SOCS3/pLVX (SOCS3/pLVX) to overexpress SOCS3, SH-SY5Y cells were treated without (CON) or with OSM (OSM) for 0.5 h and then mitochondrial fractions were isolated. Mitochondrial lysates were analyzed for P-STAT3 Ser, total STAT3, and ATP5A. (B) The densitometric ratios of P-STAT3 Ser versus total STAT3 were calculated and are shown as fold increase. ***p<0.001 compared to OSM-treated and pLVX-infected cells. (C) SH-SY5Y cells were infected with Lentivirus carrying pGipz (pGipz) as a control or shSOCS3/pGipz (shSOCS3/pGipz) to knock down SOCS3, and then treated with OSM for 0.5 h. Mitochondrial fractions were isolated and immunoblotted as described above. (D) The densitometric ratios of P-STAT3 Ser versus total STAT3 were calculated and are shown as fold increase. Graph represents the mean ± SEM of triplicate cultures in five separate experiments. *p<0.05 and **p<0.01 as compared to individual groups without knocking down SOCS3, respectively.
In parallel, SH-SY5Y cells were infected with Lentivirus delivering shSOCS3/pGipz or pGipz to knock down SOCS3 or as a control, respectively, prior to treatment with OSM. Immunoblot analyses showed that infection with Lentivirus carrying shSOCS3/pGipz significantly increased both endogenous and OSM-induced P-STAT3 Ser in mitochondria when compared to cells infected with control Lentivirus delivering pGipz (Figs. 3C and D). These data further verified that SOCS3 negatively regulates levels of P-STAT3 Ser in mitochondria.
3.3. SCI upregulates mitochondrial P-STAT3 Ser
Our previous results have demonstrated that knocking down SOCS3 increased neuronal protection and dendritic sprouting after SCI, which may be attributed to negative regulation of P-STAT3 Tyr after SCI by SOCS3 (Park et al., 2014). As P-STAT3 Ser was upregulated by the cytokine OSM in both cytosolic and mitochondrial fractions of SH-SH5Y cells, we further investigated whether similar findings could be observed in spinal cord after complete SCI, an injury that results in upregulation of the IL-6 family of cytokines. Subcellular fractionation was used to examine the subcellular localization of STAT3 and P-STAT3 Ser after SCI by immunoblotting. The results showed that STAT3 was present in both the mitochondrial and cytosolic fractions of control spinal cords (Fig. 4A). However, the basal levels of both P-STAT3 Tyr and P-STAT3 Ser were too low to detect (Fig. 4A). Next, we tested whether complete SCI induced P-STAT3 Ser in rat spinal cord. Immunoblotting experiments demonstrated that total STAT3 expression was not significantly altered after T8 complete SCI (Fig. 4B). However, expression of P-STAT3 Ser was upregulated by SCI as early as 2 days, which peaked at 4 days in areas both rostral and caudal to the injury site and then gradually declined toward baseline levels (Figs. 4B and C). We further determined whether SCI-induced P-STAT3 Ser was localized in mitochondria of spinal cord. Four days post-SCI was the time point selected for the subcellular fractionation, as the expression of P-STAT3 Ser peaked at 4 days after complete SCI (Figs. 4B and C). Spinal cords were separated into mitochondrial and cytosol fractions and processed for immunoblotting. As expected, P-STAT3 Tyr was not found in the mitochondrial fraction (Fig. 4D). Total STAT3 was not significantly altered in areas both rostral and caudal to injury site, as compared to controls (Fig. 4D). However, P-STAT3 Ser was significantly increased in mitochondria in the areas both rostral and caudal to the injury site (Figs. 4D and E).
Fig. 4.

Mitochondrial P-STAT3 Ser is upregulated after T8 complete SCI. (A) STAT3 was localized in both cytosol (Cyt)- and mitochondria (Mit)-enriched fractions. Tissue lysates from intact spinal cord were fractionated to cytosol and mitochondria and analyzed by immunoblot analyses with P-STAT3 Ser, P-STAT3 Tyr, total STAT3, ATP5A and GAPDH antibodies. (B) Immunoblot analyses showed that P-STAT3 Ser was gradually induced by SCI. Tissue lysates were prepared from spinal cords both rostral (R) and caudal (C) to the injured site at the indicated times after SCI and subjected to immunoblot analyses of P-STAT3 Ser and total STAT3. Control samples (CON) were obtained from sham-operated animals. (C) The densitometric ratios of P-STAT3 Ser versus total STAT3 were calculated and are shown as fold increase. *p < 0.05, and **p < 0.01 compared to sham-operated animals (CON) (ANOVA and Student–Newman–Keuls analyses). (D) SCI-induced P-STAT3 Ser was found in mitochondria. Mitochondrial lysates from spinal cord segments both rostral (R) and caudal (C) to the injured site at 4 days post-SCI were subcellularly fractionated and analyzed by immunoblotting of P-STAT3 Ser, P-STAT3 Tyr, total STAT3, and ATP5A. (E) Levels of P-STAT3 Ser versus total STAT3 in mitochondria were determined by densitometric scanning of immunoblots and are shown as fold increase. Graph represents the mean ± SEM of triplicate cultures in four separate experiments. **p<0.01 compared to sham-operated animals (CON) (ANOVA and Student-Newman-Keuls analyses).
3.4. SCI-induced P-STAT3 Ser is expressed by neurons and macrophages/microglia
Our previous results showed that T8 complete SCI increases SOCS3 in most, but not all, cells in a given field (Park et al., 2014), thereby suggesting cell type-specific differences in response to SCI. To test responses by neurons and astroglia, spinal cords were harvested 4 days after SCI and processed for double labeling with antibodies against neuronal (NeuN), astrocytes (GFAP), or macrophages/microglia (ED1). As shown for a representative field of cells in Figure 5, P-STAT3 Ser was expressed in NeuN-positive neurons (perikarya and neurites) and in ED1-positive macrophages/microglia, but not in GFAP-positive astrocytes. These results coincide with our previous findings (Park et al., 2014) that SOCS3 is up-regulated in neurons (NeuN+) and microglia (OX-42+), but not astrocytes (GFAP+) after complete SCI.
Fig. 5.
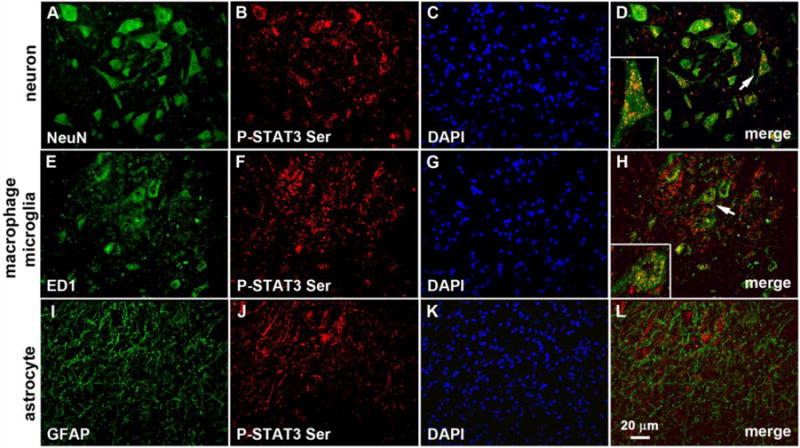
SCI increases P-STAT3 Ser in neurons and macrophages/microglia. Double labeling immunocytochemistry was used to identify cells with SCI-induced increases in P-STAT3 Ser. As shown, P-STAT3 Ser (red, B, F, J) was expressed by both neurons (NeuN+; A–D) and macrophages/microglia (ED1+; E–H), but not by GFAP+ astrocytes (I–L) 4 days after complete transection of T8 spinal cord. Scale bar, 20 μm. The boxed area shows higher magnification of co-localized cells (arrow).
4. Discussion
In the present study, we demonstrate that P-STAT3 Ser is significantly but transiently upregulated by OSM treatment in mitochondria in SH-SY5Y cells. The expression levels of P-STAT3 Ser in SH-SY5Y cells with or without OSM treatment can be negatively regulated, depending upon the levels of SOCS3. Furthermore, P-STAT3 Ser was significantly induced in the injured spinal cord within two days following SCI by neurons, macrophages, and microglia.
STAT3, a cytosolic transcription factor activated by diverse cytokines and growth factors, has been shown to exhibit an additional, non-transcriptional function in mitochondria (Garama et al., 2015). Specifically, when phosphorylated at tyrosine 705 (Tyr705), P-STAT3 Tyr functions as a nuclear transcription factor that can contribute to oncogenesis (Yu et al., 2015). STAT3 phosphorylated at serine 727 (Ser727) localizes in mitochondria (Yu et al., 2015). Mitochondrial P-STAT3 Ser is required for optimal electron transport chain (ETC) activity and protects against stress-induced mitochondrial dysfunction (Wegrzyn et al., 2009), such as increasing levels of reactive oxygen species (ROS) (Han et al., 2014). These findings indicate that STAT3 could have diverse roles, from conveying signals to the (1) nuclei by P-STAT3 Tyr to facilitate transcription of target genes such as SOCS3, and (2) mitochondria by P-STAT3 Ser to foster mitochondrial function. We have previously uncovered critical roles of P-STAT3 Tyr in neuroprotection against SCI. Furthermore, our data have shown that levels of P-STAT3 Tyr are negatively regulated by SOCS3 expression, which is upregulated by SCI. While the direct contribution of non-transcriptional, mitochondria-localized STAT3 to protection during SCI remains to be established, STAT3 mediates cardioprotection not only via canonical action as a transcription factor, but also as a modulator of ETC activity directly in the mitochondria (Szczepanek et al., 2015; Wegrzyn et al., 2009). It is possible that SOCS3 plays a critical role in the neuropathological changes of SCI through regulation of not only P-STAT3 Tyr, but also P-STAT3 Ser. To test this, we first examined the effects of OSM on SH-SY5Y cells. OSM is a member of the IL-6 cytokine family that has been shown to induce both P-STAT3 Tyr and P-STAT3 Ser in primary cortical neurons and SH-SY5Y cells. Furthermore, SOCS3 expression is regulated upon OSM treatment in neurons (Park et al., 2012). As shown in Figure 1, both P-STAT3 Tyr and P-STAT3 Ser were significantly but transiently induced by OSM at 0.5 and 1 h, and then declined by 2 h. However, SOCS3 expression was significantly induced by OSM at the time after STAT3 activation, i.e. between 1 to 8 h. The overexpressed SOCS3, upregulated by STAT3 activation, then negatively regulates activation of STAT3, which in turn decreases levels of both P-STAT3 Tyr in the cytosol and P-STAT3 Ser in mitochondria (Fig. 6). Such negative feedback regulation was further verified by Lentivirus-mediated modulation of the expression of SOCS3. The OSM-induced P-STAT3 Ser was either decreased or increased by experimental strategies to overexpress SOCS3 or knockdown SOCS3 expression, respectively, suggesting that SOCS3 functions as a negative regulator of P-STAT3 Ser in mitochondria. Since P-STAT3 Ser is critical for the maintenance of mitochondrial function, it is important in the future to study whether knocking down SOCS3 decreases mitochondrial enzyme activity and/or increases antioxidant capacity.
Fig. 6.

Illustration of proposed STAT3 regulation by SOCS3. Stimulation with stress conditions, such as exogenous OSM or SCI, lead to translocation of STAT3 to nuclei and mitochondria, where STAT3 is phosphorylated at Tyr 705 (P-STAT3 Tyr) and Ser 727 (P-STAT3 Ser) residues, respectively. Increased nuclear P-STAT3 Tyr then enhances SOCS3 expression, and then upregulated SOCS3 negatively regulates activation of STAT3 in both mitochondria and nuclei (nail-shape line). Such negative regulation of STAT3 can be blocked by manipulation of SOCS3 levels using shSOCS3 (cross line).
Our data from a T8 complete SCI animal model showed that P-STAT3 Ser was significantly induced in spinal cord two days after SCI and then gradually declined to baseline levels after one week. SCI thus induced not only P-STAT3 Tyr as found previously (Park et al., 2014), but also P-STAT3 Ser in mitochondria in a similar expression pattern, though P-STAT3 Tyr was not found in mitochondria. These data combined with in vitro results suggest that after SCI, inflammatory cytokines including the IL-6 family are upregulated, which leads to activation of STAT3 in both nuclei and mitochondria (Fig. 6). The findings from our lab and others suggest that STAT3 is important for mitochondrial function and cell viability by ensuring mitochondrial integrity and the expression of pro-survival genes (Park et al., 2014; Wegrzyn et al., 2009; Zouein et al., 2014).
SCI causes axonal degeneration, which is strongly associated with mitochondrial dysfunction and neuronal damage. Axonal mitochondria are an important convergence point as regulators of bioenergetic metabolism, ROS, Ca2+ homeostasis, and protease activation (Court and Coleman, 2012). Permanent mitochondrial damage after SCI thus depends on calcium influx and mitochondrial permeability. Indeed, inflammation and demyelination have been shown to be strongly associated with mitochondrial dysfunction and neuronal damage in multiple sclerosis (Campbell et al., 2014; van Horssen et al., 2012). This highlights the need to understand the pathophysiology of axonal mitochondria and the contribution of mitochondrial P-STAT3 Ser to degenerative mechanisms after SCI for novel therapeutic strategies. A number of anti-oxidant and anti-apoptotic genes are upregulated by STAT3 via nuclear P-STAT3 Tyr and mitochondrial P-STAT3 Ser to promote cell survival and reduce ROS production (Poli and Camporeale, 2015; Zouein et al., 2015). Unfortunately, the relatively short period of upregulation of both P-STAT3 Tyr and P-STAT3 Ser may not be sufficient to protect spinal cord against SCI-induced pathological progression. Manipulating SCI-increased SOCS3 expression is therefore important to enhance and/or sustain the beneficial effects of STAT3 signaling, affecting in turn oxidative metabolism, inflammation, cell survival, and nerve regeneration. These are consistent with our previous data (Park et al., 2015) that suppressing SCI-induced SOCS3 overexpression by Lentiviral delivery of shRNA protects against SCI-induced cell death and demyelination, by which dendritic outgrowth is enhanced. Together, our findings indicate that SOCS3 could have diverse roles in the progression of SCI through regulation of (1) P-STAT3 Tyr to modulate transcription of target genes, and (2) P-STAT3 Ser to modulate mitochondrial functions.
Highlight.
OSM differentially induces P-STAT3 Tyr and P-STAT3 Ser in SH-SY5Y cells
SOCS3 negatively regulated OSM-induced P- STAT3 Ser in mitochondria
SCI upregulates mitochondrial P-STAT3 Ser
SCI-induced P-STAT3 Ser is expressed by neurons and macrophages/microglia
Acknowledgments
This project was supported by National Institutes of Health (NIH) grants NS069765 to Y-S.L. and NS57563 to E.N.B., as well as a grant from the Craig Neilsen Foundation (#297064) to Y-S.L. We thank Kevin Li (Cleveland Clinic) for drawing assistance on illustration and Dr. Christopher Nelson (Cleveland Clinic) for editorial assistance and critical reading of the manuscript.
Footnotes
Publisher's Disclaimer: This is a PDF file of an unedited manuscript that has been accepted for publication. As a service to our customers we are providing this early version of the manuscript. The manuscript will undergo copyediting, typesetting, and review of the resulting proof before it is published in its final citable form. Please note that during the production process errors may be discovered which could affect the content, and all legal disclaimers that apply to the journal pertain.
References
- Baker BJ, Akhtar LN, Benveniste EN. SOCS1 and SOCS3 in the control of CNS immunity. Trends Immunol. 2009;30:392–400. doi: 10.1016/j.it.2009.07.001. [DOI] [PMC free article] [PubMed] [Google Scholar]
- Campbell GR, Worrall JT, Mahad DJ. The central role of mitochondria in axonal degeneration in multiple sclerosis. Mult Scler. 2014;20:1806–1813. doi: 10.1177/1352458514544537. [DOI] [PubMed] [Google Scholar]
- Court FA, Coleman MP. Mitochondria as a central sensor for axonal degenerative stimuli. Trends Neurosci. 2012;35:364–372. doi: 10.1016/j.tins.2012.04.001. [DOI] [PubMed] [Google Scholar]
- Ferguson TA, Son YJ. Extrinsic and intrinsic determinants of nerve regeneration. Journal of tissue engineering. 2011;2 doi: 10.1177/2041731411418392. 2041731411418392. [DOI] [PMC free article] [PubMed] [Google Scholar]
- Fischer D, Petkova V, Thanos S, Benowitz LI. Switching mature retinal ganglion cells to a robust growth state in vivo: gene expression and synergy with RhoA inactivation. J Neurosci. 2004;24:8726–8740. doi: 10.1523/JNEUROSCI.2774-04.2004. [DOI] [PMC free article] [PubMed] [Google Scholar]
- Garama DJ, Harris TJ, White CL, Rossello FJ, Abdul-Hay M, Gough DJ, Levy DE. A Synthetic Lethal Interaction between Glutathione Synthesis and Mitochondrial Reactive Oxygen Species Provides a Tumor-Specific Vulnerability Dependent on STAT3. Mol Cell Biol. 2015;35:3646–3656. doi: 10.1128/MCB.00541-15. [DOI] [PMC free article] [PubMed] [Google Scholar]
- Gough DJ, Corlett A, Schlessinger K, Wegrzyn J, Larner AC, Levy DE. Mitochondrial STAT3 supports Ras-dependent oncogenic transformation. Science. 2009;324:1713–1716. doi: 10.1126/science.1171721. [DOI] [PMC free article] [PubMed] [Google Scholar]
- Han J, Yu C, Souza RF, Theiss AL. Prohibitin 1 modulates mitochondrial function of Stat3. Cell Signal. 2014;26:2086–2095. doi: 10.1016/j.cellsig.2014.06.006. [DOI] [PMC free article] [PubMed] [Google Scholar]
- Luo X, Park KK. Neuron-intrinsic inhibitors of axon regeneration: PTEN and SOCS3. Int Rev Neurobiol. 2012;105:141–173. doi: 10.1016/B978-0-12-398309-1.00008-1. [DOI] [PubMed] [Google Scholar]
- Miao T, Wu D, Zhang Y, Bo X, Subang MC, Wang P, Richardson PM. Suppressor of cytokine signaling-3 suppresses the ability of activated signal transducer and activator of transcription-3 to stimulate neurite growth in rat primary sensory neurons. J Neurosci. 2006;26:9512–9519. doi: 10.1523/JNEUROSCI.2160-06.2006. [DOI] [PMC free article] [PubMed] [Google Scholar]
- Newbern JM, Shoemaker SE, Snider WD. Taking off the SOCS: cytokine signaling spurs regeneration. Neuron. 2009;64:591–592. doi: 10.1016/j.neuron.2009.11.027. [DOI] [PubMed] [Google Scholar]
- Park KK, Hu Y, Muhling J, Pollett MA, Dallimore EJ, Turnley AM, Cui Q, Harvey AR. Cytokine-induced SOCS expression is inhibited by cAMP analogue: impact on regeneration in injured retina. Mol Cell Neurosci. 2009;41:313–324. doi: 10.1016/j.mcn.2009.04.002. [DOI] [PubMed] [Google Scholar]
- Park KK, Liu K, Hu Y, Smith PD, Wang C, Cai B, Xu B, Connolly L, Kramvis I, Sahin M, He Z. Promoting axon regeneration in the adult CNS by modulation of the PTEN/mTOR pathway. Science. 2008;322:963–966. doi: 10.1126/science.1161566. [DOI] [PMC free article] [PubMed] [Google Scholar]
- Park KW, Lin CY, Lee YS. Expression of suppressor of cytokine signaling-3 (SOCS3) and its role in neuronal death after complete spinal cord injury. Exp Neurol. 2014;261:65–75. doi: 10.1016/j.expneurol.2014.06.013. [DOI] [PMC free article] [PubMed] [Google Scholar]
- Park KW, Lin CY, Li K, Lee YS. Effects of Reducing Suppressors of Cytokine Signaling-3 (SOCS3) Expression on Dendritic Outgrowth and Demyelination after Spinal Cord Injury. PLoS One. 2015;10:e0138301. doi: 10.1371/journal.pone.0138301. [DOI] [PMC free article] [PubMed] [Google Scholar]
- Park KW, Nozell SE, Benveniste EN. Protective role of STAT3 in NMDA and glutamate-induced neuronal death: negative regulatory effect of SOCS3. PLoS One. 2012;7:e50874. doi: 10.1371/journal.pone.0050874. [DOI] [PMC free article] [PubMed] [Google Scholar]
- Poli V, Camporeale A. STAT3-Mediated Metabolic Reprograming in Cellular Transformation and Implications for Drug Resistance. Frontiers in oncology. 2015;5:121. doi: 10.3389/fonc.2015.00121. [DOI] [PMC free article] [PubMed] [Google Scholar]
- Smith PD, Sun F, Park KK, Cai B, Wang C, Kuwako K, Martinez-Carrasco I, Connolly L, He Z. SOCS3 deletion promotes optic nerve regeneration in vivo. Neuron. 2009;64:617–623. doi: 10.1016/j.neuron.2009.11.021. [DOI] [PMC free article] [PubMed] [Google Scholar]
- Szczepanek K, Xu A, Hu Y, Thompson J, He J, Larner AC, Salloum FN, Chen Q, Lesnefsky EJ. Cardioprotective function of mitochondrial-targeted and transcriptionally inactive STAT3 against ischemia and reperfusion injury. Basic research in cardiology. 2015;110:53. doi: 10.1007/s00395-015-0509-2. [DOI] [PubMed] [Google Scholar]
- van Horssen J, Witte ME, Ciccarelli O. The role of mitochondria in axonal degeneration and tissue repair in MS. Mult Scler. 2012;18:1058–1067. doi: 10.1177/1352458512452924. [DOI] [PubMed] [Google Scholar]
- Wegrzyn J, Potla R, Chwae YJ, Sepuri NB, Zhang Q, Koeck T, Derecka M, Szczepanek K, Szelag M, Gornicka A, Moh A, Moghaddas S, Chen Q, Bobbili S, Cichy J, Dulak J, Baker DP, Wolfman A, Stuehr D, Hassan MO, Fu XY, Avadhani N, Drake JI, Fawcett P, Lesnefsky EJ, Larner AC. Function of mitochondrial Stat3 in cellular respiration. Science. 2009;323:793–797. doi: 10.1126/science.1164551. [DOI] [PMC free article] [PubMed] [Google Scholar]
- Yu C, Huo X, Agoston AT, Zhang X, Theiss AL, Cheng E, Zhang Q, Zaika A, Pham TH, Wang DH, Lobie PE, Odze RD, Spechler SJ, Souza RF. Mitochondrial STAT3 contributes to transformation of Barrett’s epithelial cells that express oncogenic Ras in a p53-independent fashion. American journal of physiology Gastrointestinal and liver physiology. 2015;309:G146–161. doi: 10.1152/ajpgi.00462.2014. [DOI] [PMC free article] [PubMed] [Google Scholar]
- Yuan K, Lei Y, Chen HN, Chen Y, Zhang T, Li K, Xie N, Wang K, Feng X, Pu Q, Yang W, Wu M, Xiang R, Nice EC, Wei Y, Huang C. HBV-induced ROS accumulation promotes hepatocarcinogenesis through Snail-mediated epigenetic silencing of SOCS3. Cell Death Differ. 2016;23:616–627. doi: 10.1038/cdd.2015.129. [DOI] [PMC free article] [PubMed] [Google Scholar]
- Zhou L, Too HP. Mitochondrial localized STAT3 is involved in NGF induced neurite outgrowth. PLoS One. 2011;6:e21680. doi: 10.1371/journal.pone.0021680. [DOI] [PMC free article] [PubMed] [Google Scholar]
- Zouein FA, Altara R, Chen Q, Lesnefsky EJ, Kurdi M, Booz GW. Pivotal Importance of STAT3 in Protecting the Heart from Acute and Chronic Stress: New Advancement and Unresolved Issues. Frontiers in cardiovascular medicine. 2015;2:36. doi: 10.3389/fcvm.2015.00036. [DOI] [PMC free article] [PubMed] [Google Scholar]
- Zouein FA, Duhe RJ, Arany I, Shirey K, Hosler JP, Liu H, Saad I, Kurdi M, Booz GW. Loss of STAT3 in mouse embryonic fibroblasts reveals its Janus-like actions on mitochondrial function and cell viability. Cytokine. 2014;66:7–16. doi: 10.1016/j.cyto.2013.12.006. [DOI] [PMC free article] [PubMed] [Google Scholar]