Abstract
Blood vessels define local microenvironments in the skeletal system, play crucial roles in osteogenesis and provide niches for haematopoietic stem cells1–6. The properties of niche-forming vessels and their changes in the ageing organism remain incompletely understood. Here, we show that Notch signalling in endothelial cells leads to the expansion of haematopoietic stem cell niches in bone, which involves increases in CD31-positive capillaries and PDGFRβ-positive perivascular cells, arteriole formation, and elevation of cellular stem cell factor levels. While endothelial hypoxia-inducible factor signalling promotes some of these aspects, it fails to enhance vascular niche function because of lacking arterialization and expansion of PDGFRβ-positive cells. In ageing mice, niche-forming vessels in the skeletal system are strongly reduced but can be restored by activation of endothelial Notch signalling. These findings argue that vascular niches for haematopoietic stem cells are part of complex, age-dependent microenvironments involving multiple cell populations and vessel subtypes.
Keywords: Arteries, endothelial cells, Notch, Dll4, HIF, haematopoiesis, ageing
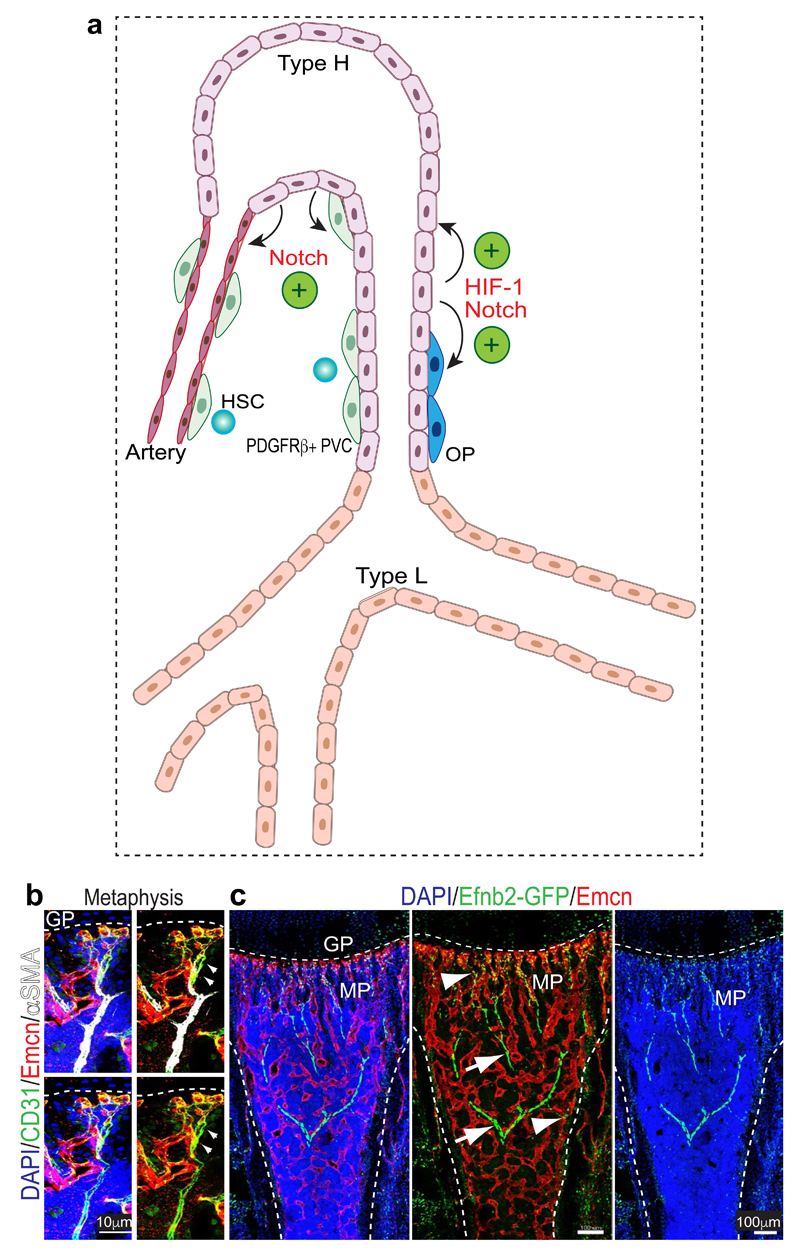
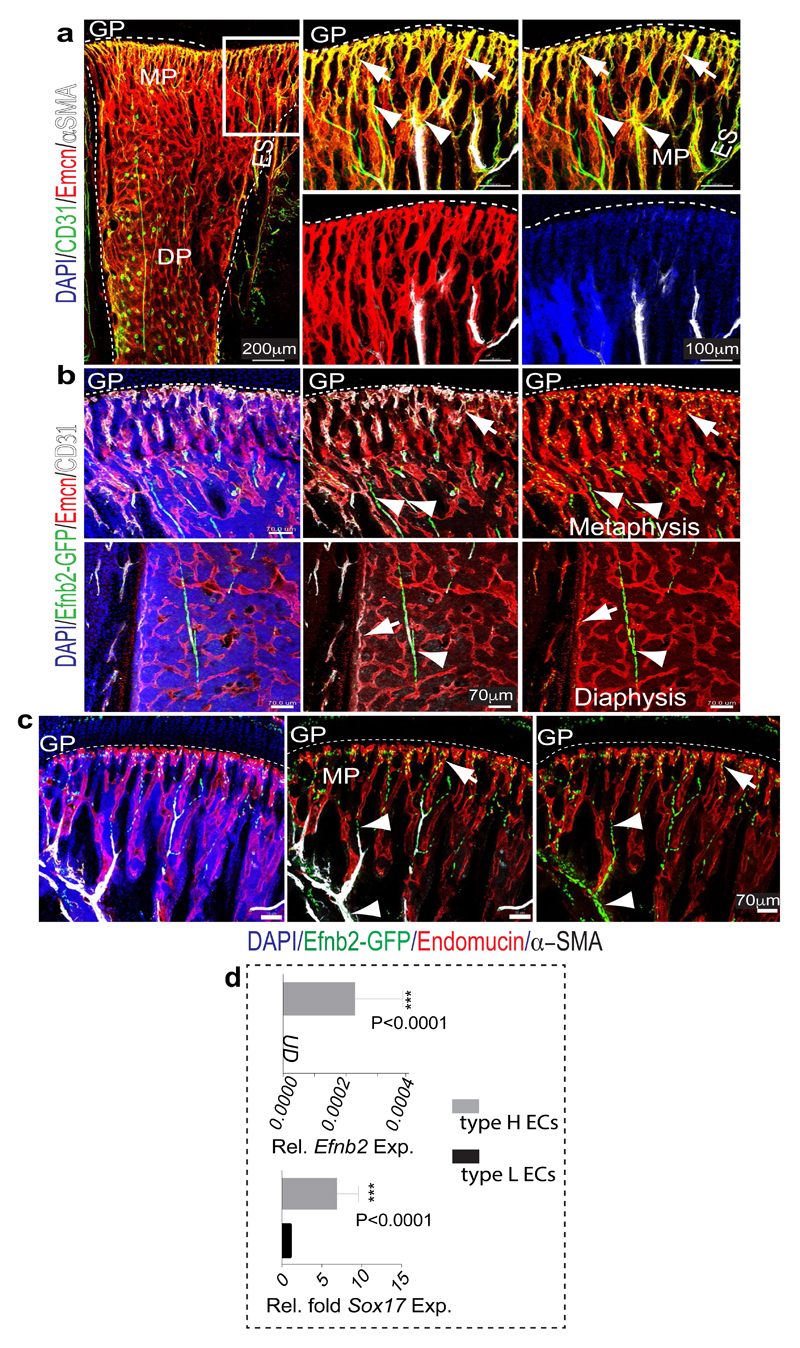
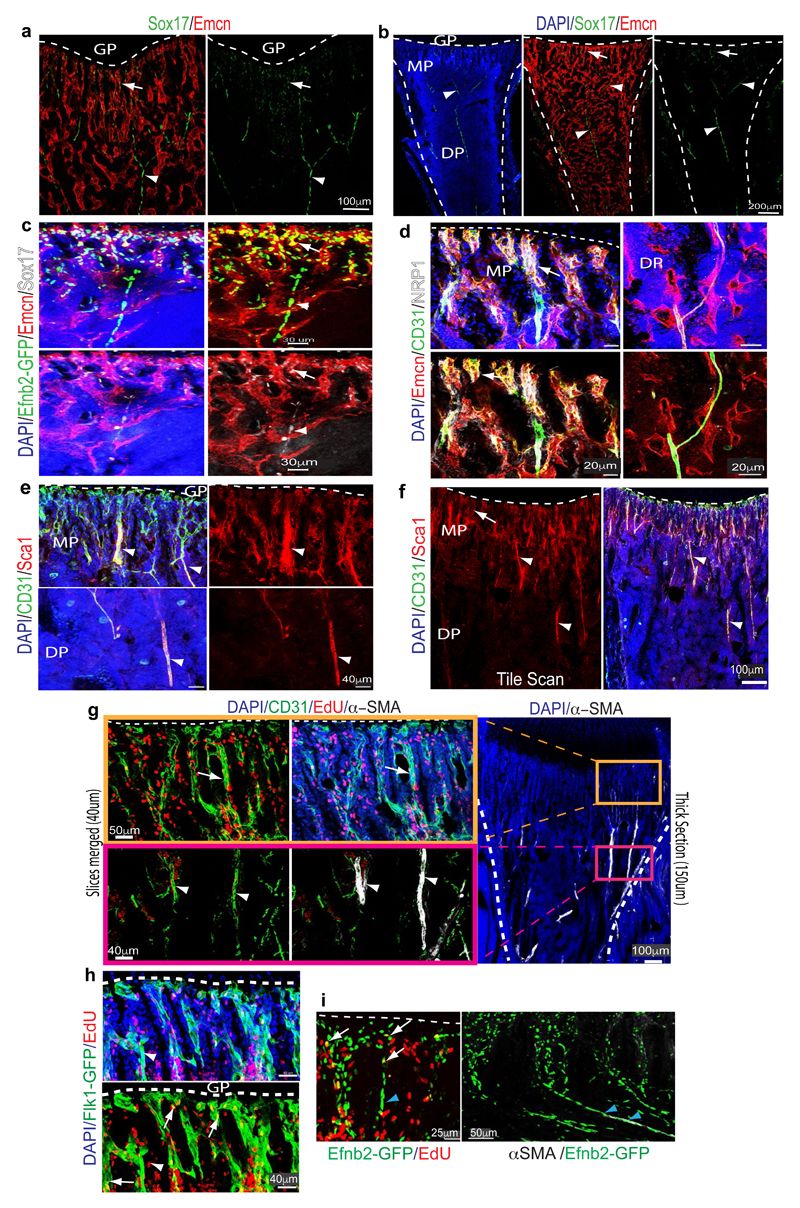
Different vessel subtypes have distinct roles in the skeletal system. Veins drain the bone marrow (BM) cavity, while arteries deliver oxygen-rich blood and are thought to provide niches for quiescent haematopoietic stem cells (HSCs)7. Type H capillaries, characterized by high expression of CD31 (CD31hi) and Endomucin (Emcnhi), connect to arterioles (Extended Data Fig. 1a, b), are surrounded by osteoprogenitors and release factors promoting osteogenesis4,6. By contrast, type L (CD31lo Emcnlo) vessels, which correspond to BM sinusoids, lack arteriolar connections and osteoprogenitor association4. For deeper characterization of vessel subpopulations, we analysed bones from Efnb2GFP/+ knock-in8 mice (Extended Data Fig. 1c), which express GFP under control of the gene encoding ephrin-B2, an arterial marker9. Efnb2GFP/+ signals labelled arteries and distal arterioles, both of which lack Emcn expression, and the adjacent Emcn+ type H endothelial cells (ECs) in metaphysis and endosteum (Extended Data Fig. 2a-c). qPCR analysis showed significantly higher expression of Efnb2 and Sox17, a transcription factor and regulator of arterial differentiation10, in sorted type H ECs relative to type L ECs (Extended Data Fig. 2d). Immunostaining confirmed expression of Sox17, ephrin-B2 and Neuropilin-1 (Nrp1), another marker of arterial ECs, in arteries and type H capillaries (Fig. 1b; Extended Data Fig. 3a-d). Consistent with previous reports2, bone arteries also showed Sca-1 (Ly-6A/E) immunostaining, which extended to type H endothelium (Extended Data Fig. 3e, f). Proliferation, a key feature of angiogenic vessel growth11,12, was prominent in type H ECs and distal arterioles, whereas EdU labelling was absent in α-SMA-covered arteries (Extended Data Fig. 3g-i). Thus, arterioles and type H vessels are found in direct proximity and share many features distinguishing them from BM sinusoidal (type L) capillaries.
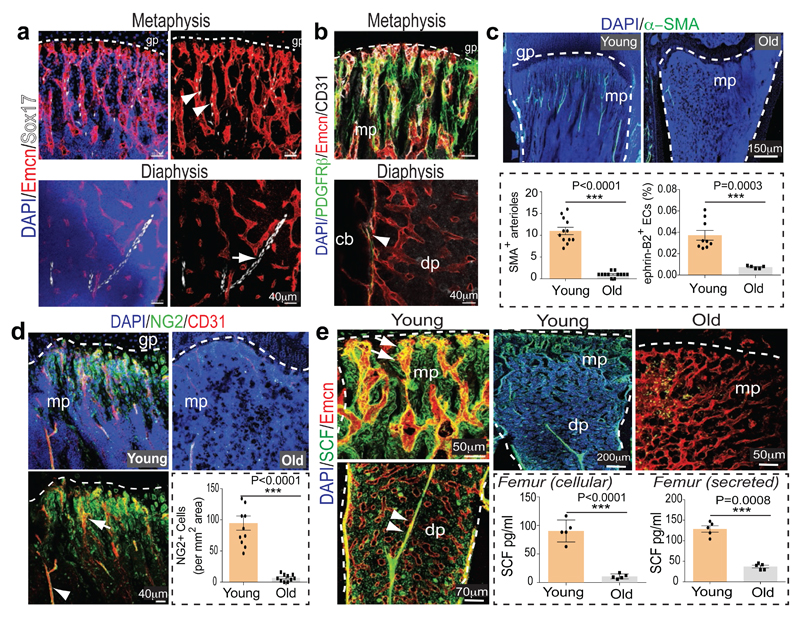
Figure 1. Bone vessel subtypes and properties.
a, Confocal images showing Emcn (red) and Sox17 (white) in tibial metaphysis or diaphysis. Nuclei, DAPI (blue). Arrowhead marks artery, arrow type H capillaries.
b, PDGFRβ+ cells (green) surround arteries and Emcn+ (red) CD31+ (white) vessels in metaphysis (mp) and endosteum (arrowhead) but not diaphyseal (dp) sinusoidal vessels in 4 week-old tibia.
c, α-SMA+ arterioles in 5 (young) and 65 week-old (old) tibial metaphysis. Nuclei, DAPI (blue). Dashed lines mark growth plate (gp) and compact bone. Graphs show quantitative analysis of α-SMA+ metaphyseal arteries (n=12, 2 independent experiments) and flow cytometric analysis of ephrin-B2+ ECs (n=9 young and 5 old mice). Data represent mean±s.e.m. P values, two-tailed unpaired t-test.
d, NG2+ (green) cells and CD31+ (red) vessels in sections from 5 (Young, left) and 65 week-old (Old) tibial metaphysis. Graph shows quantitation of NG2+ mesenchymal cells excluding NG2+ bone cells. Data represents mean±s.e.m (2 tibias from 5 mice). P values, two-tailed unpaired t-test.
e, Confocal images showing SCF (green) staining in arteries (arrowheads) and Emcn+ (red) metaphyseal (mp) type H vessels (arrow) of young (3 week-old) but not old (65 week-old) tibiae. Quantitative analysis of cellular (lysate of washed total BM cells) and extracellular SCF (bone supernatant) in young/old long bone by ELISA. Data represents mean±s.d (n=5). P values, two-tailed unpaired t-test.
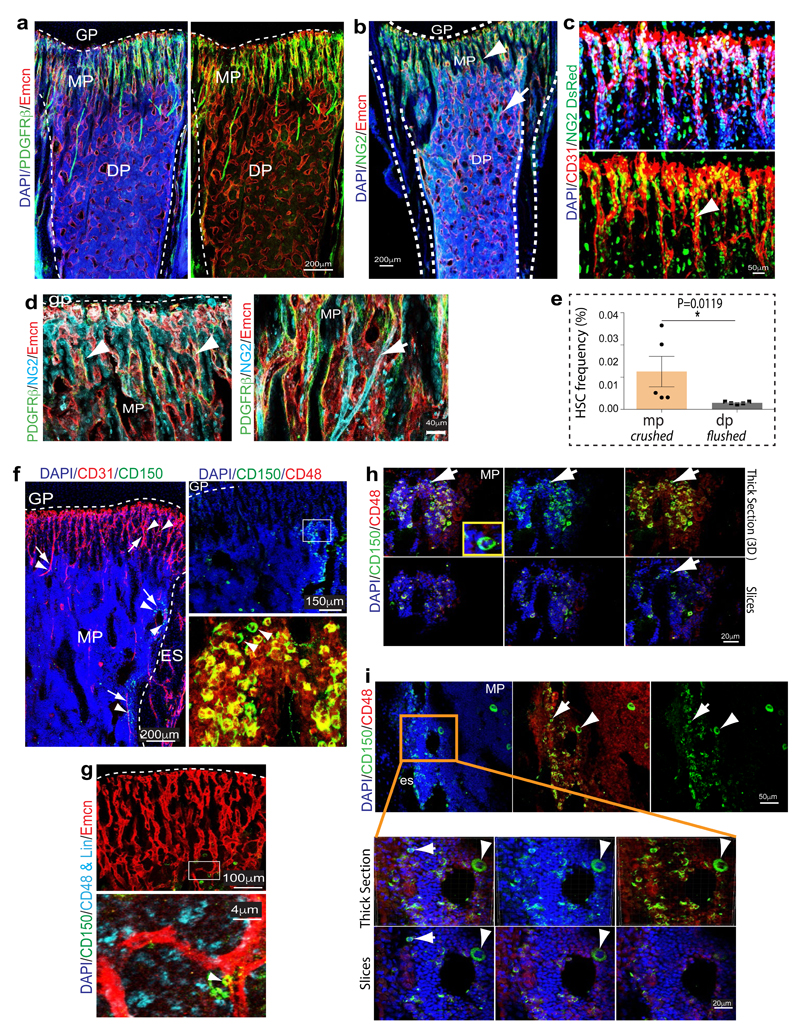
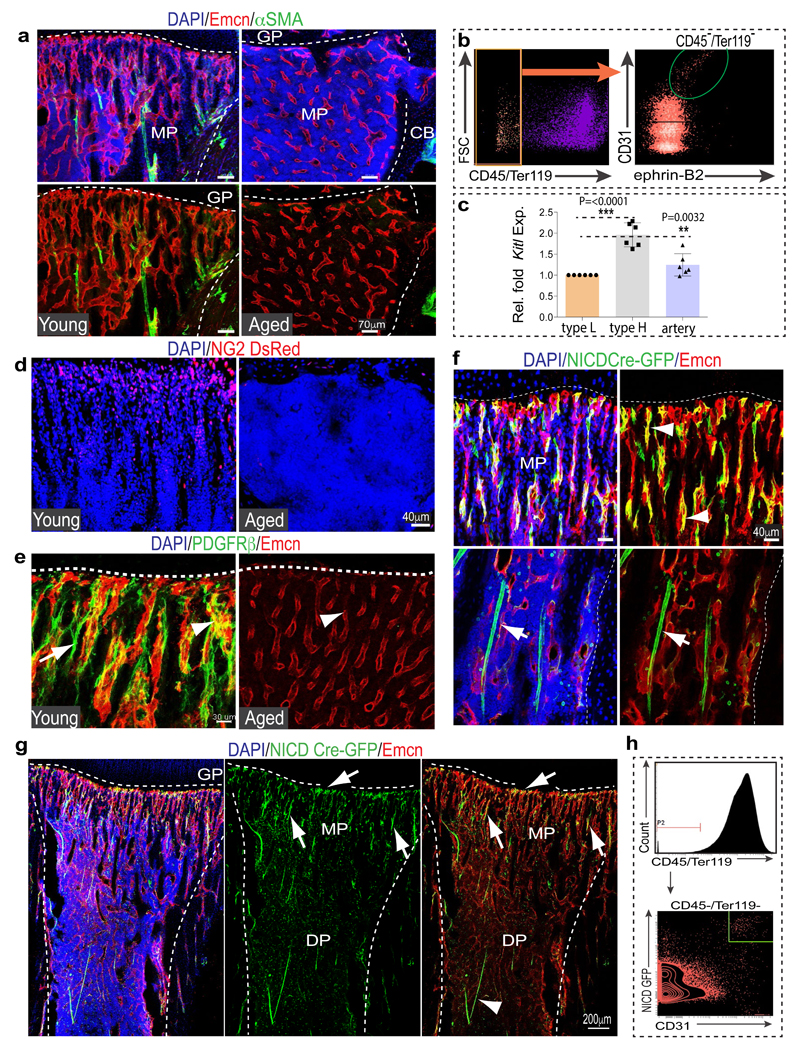
In addition to BM ECs, important roles in the regulation of HSCs have been attributed to the mesenchymal lineage and, in particular, Nestin+ mesenchymal stem cells (MSCs)13. Cells expressing PDGFRβ, the receptor for platelet-derived growth factor B (PDGF-B) and a marker of pericytes and other mesenchymal cell types14, were primarily located around type H capillaries and arteries but not type L vessels (Fig 1c; Extended Data Fig. 4a). Perivascular mesenchymal cells also expressed NG2 (Extended Data Fig. 4b-d). Similar to the localization of type H capillaries, distal arterioles and PDGFRβ+ NG2+ mesenchymal cells, CD150+ CD48− Lin− Sca1+ c-Kit+ HSCs were more abundant in the dissected metaphysis than in BM flushed out from the diaphysis (Extended Data Fig. 4e). In addition, CD150+ CD48- cells were found in proximity of type H vasculature in thick cryosections (100µm) of the metaphysis and endosteum (Extended Data Fig. 4f-i).
Ageing is associated with changes in HSC number and quality15,16, reduced skeletal blood flow17 and alterations in BM stroma18. We have previously shown that type H ECs and associated osteoprogenitors decline significantly in adult and aged mice4. As type H capillaries connect to arterioles6, we compared the abundance of arteries in young (4 week-old) and aged (65-70 week-old) bone. Strikingly, aged tibias contained fewer α-SMA-covered arteries and Efnb2+ ECs (Fig. 1c; Extended Data Fig. 5a, b). Likewise, the abundance of PDGFRβ+ or NG2+ perivascular cells was reduced in aged long bone (Fig. 1d; Extended Data Fig. 5d, e). Stem cell factor (SCF) is a cytokine with crucial roles in HSC homing and maintenance19,1. CD31hi Emcnhi ECs in the metaphysis and endosteum as well as vessel-associated cells covering type H capillaries and arteries were strongly positive for SCF, whereas expression in diaphyseal type L vasculature was weaker (Fig. 1e). Accordingly, expression of the Kitl gene encoding murine SCF was significantly higher in freshly isolated type H relative to type L ECs (Extended Data Fig. 5c). Consistent with the reduction of arterioles, type H capillaries and PDGFRβ+/NG2+ perivascular cells, SCF levels also declined in aged mice (Fig. 1e).
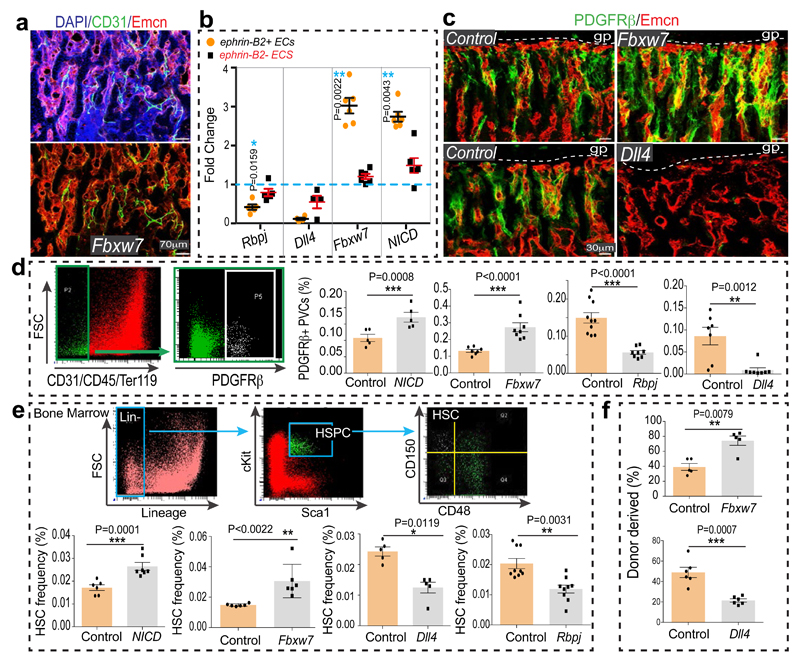
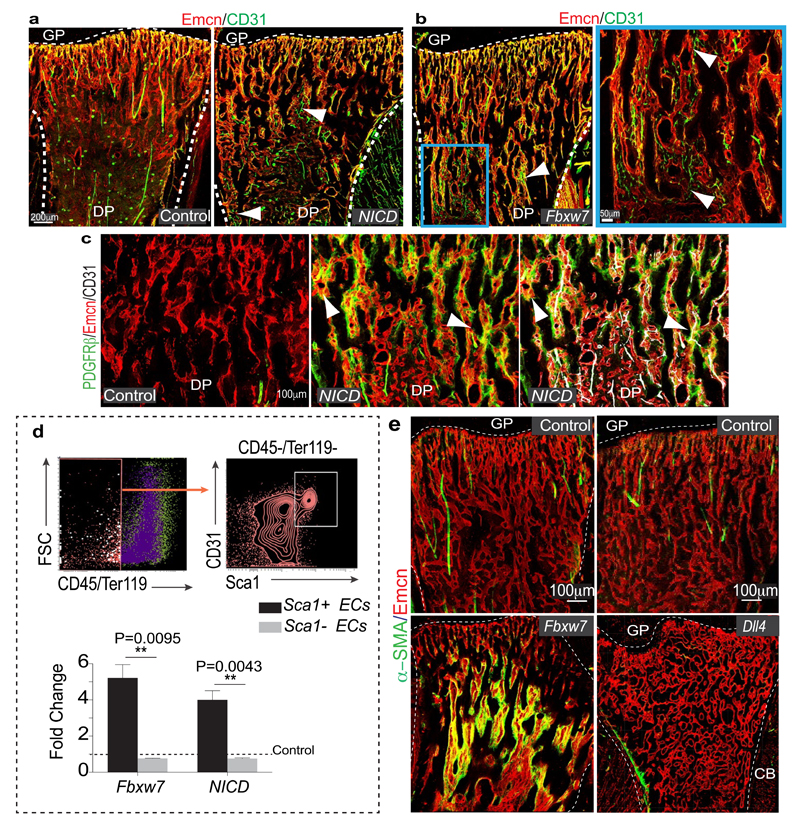
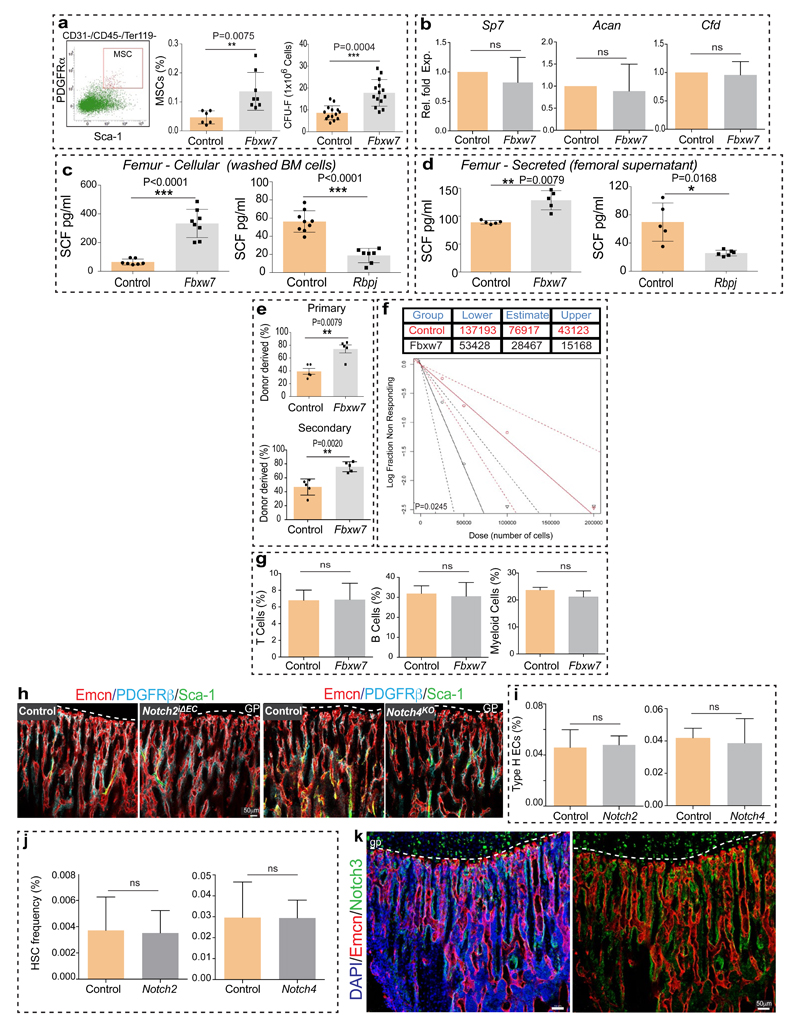
The Notch pathway promotes artery formation and the abundance of small calibre arterioles and type H ECs was strongly increased in EC-specific Notch gain-of-function mutant bone6. Analysis of Notch1 activity in bone with NICD-Cre knock-in mice20 in the Rosa26-mT/mG21 Cre reporter background showed recombination (GFP signal) in type H ECs, perivascular cells in metaphysis and endosteum, and in arteries (Extended Data Fig. 5f-h). EC-specific overexpression of the Notch1 intracellular domain (NICDiOE-EC) or inactivation of the gene encoding Fbxw7 (Fbxw7iΔEC), which mediates polyubiquitination and thereby proteasomal degradation of active Notch22, induced arteriole formation and expansion of Sca1+ ECs and ephrin-B2+ ECs (Fig. 2a, b; Extended Data Fig. 6a, b). This was accompanied by increases in α-SMA coverage, PDGFRβ+ perivascular cells, MSC frequency, SCF levels, and HSC frequency in Fbxw7iΔEC BM (Fig. 2c-e; Extended Data Fig. 6c-e and 7a-d). The increase in HSC frequency was confirmed by primary and secondary competitive reconstitution assays of irradiated mice transplanted with Fbxw7iΔEC or control BM cells (Fig. 2f; Extended Data Fig. 7e, f). The frequencies of different hematopoietic lineages remained unaltered in Fbxw7iΔEC BM (Extended Data Fig. 7g). These data establish that manipulation of the endothelium can enhance vascular niche function leading to increased HSC frequency.
Figure 2. Endothelial Notch regulates BM HSC numbers.
a, Formation of numerous CD31+ (green) Emcn- (red) arterioles in 4 week-old Fbxw7iΔEC tibial diaphysis. Nuclei, DAPI (blue).
b, Quantitative analysis of ephrin-B2+ and ephrin-B2- ECs in NICDiOE-EC (n=6 mutants and 5 controls), Fbxw7iΔEC (n=6 and 5), RbpjiΔEC (n=5) and Dll4iΔEC (n=4 and 5) long bone relative to Cre-negative controls (dotted line). Data represents mean±s.e.m. P values, two-tailed unpaired t-test. Total ECs were identified as CD45- Ter119- CD31+ cells.
c, Representative images of Fbxw7iΔEC, Dll4iΔEC or control tibial metaphysis showing PDGFRβ+ (green) cells around Emcn+ (red) capillaries.
d, Flow cytometric quantitation of CD31- CD45- Ter119- PDGFRβ+ cells, as shown in representative dot plots. Note increase of PDGFRβ+ cells in Notch gain-of-function bone (NICD n=5; Fbxw7 n=8 and 7) but decrease in RbpjiΔEC (n=8 and 10) and Dll4iΔEC (n=7) mutants. Data represent mean±s.e.m. P values, two-tailed unpaired t-test.
e, Flow cytometric quantitation (as shown in dot plots) of HSCs in NICDiOE-EC (n=7 and 6), Fbxw7iΔEC (n=7 and 6), RbpjiΔEC (n=8 and 10), and Dll4iΔEC (n=7) long bones relative to Cre- littermates. Data represents mean±s.e.m. P values, two-tailed unpaired t-test.
f, Analysis of LTR-HSC contribution of Fbxw7iΔEC and Dll4iΔEC donor-derived BM cells, as determined by flow cytometry at 7 months after competitive transplantation together with recipient-derived CD45.1 BM cells into lethally irradiated mice. Data represents mean±s.e.m. (n=5 donors for Fbxw7iΔEC and n=6 donors for Dll4iΔEC).
Notch signalling in the endothelium requires the Notch ligand Dll4 and the DNA-binding protein RBPJ, which controls gene expression downstream of activated Notch6. The abundance of arteries, the number of ephrin-B2+ ECs and PDGFRβ+ cells, SCF levels, and HSC frequency were all reduced in EC-specific RbpjiΔEC or Dll4iΔEC Notch loss-of-function long bone (Fig. 2b-e; Extended Data Fig. 7c, d). Dll4iΔEC BM cells also showed reduced long-term repopulation activity in competitive reconstitution assays (Fig. 2f). Notch1 is the main Notch receptor controlling EC behaviour23. Consistently, vascular organization, abundance of type H ECs and frequency of CD150+ CD48− Lin− Sca1+ c-Kit+ HSCs were not altered in EC-specific Notch2iΔEC or global Notch4 mutant bone (Extended Data Fig. 7h-j). Notch3 expression was not detectable in bone ECs (Extended Data Fig. 7k).
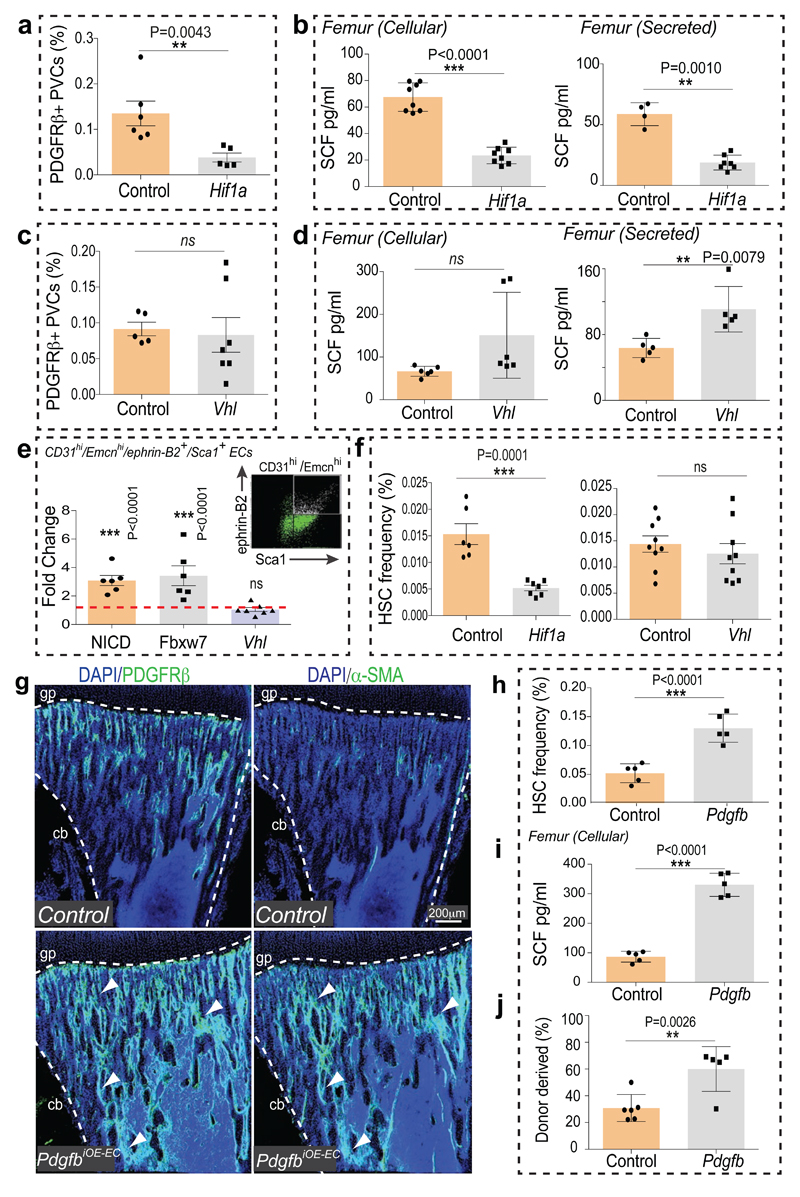
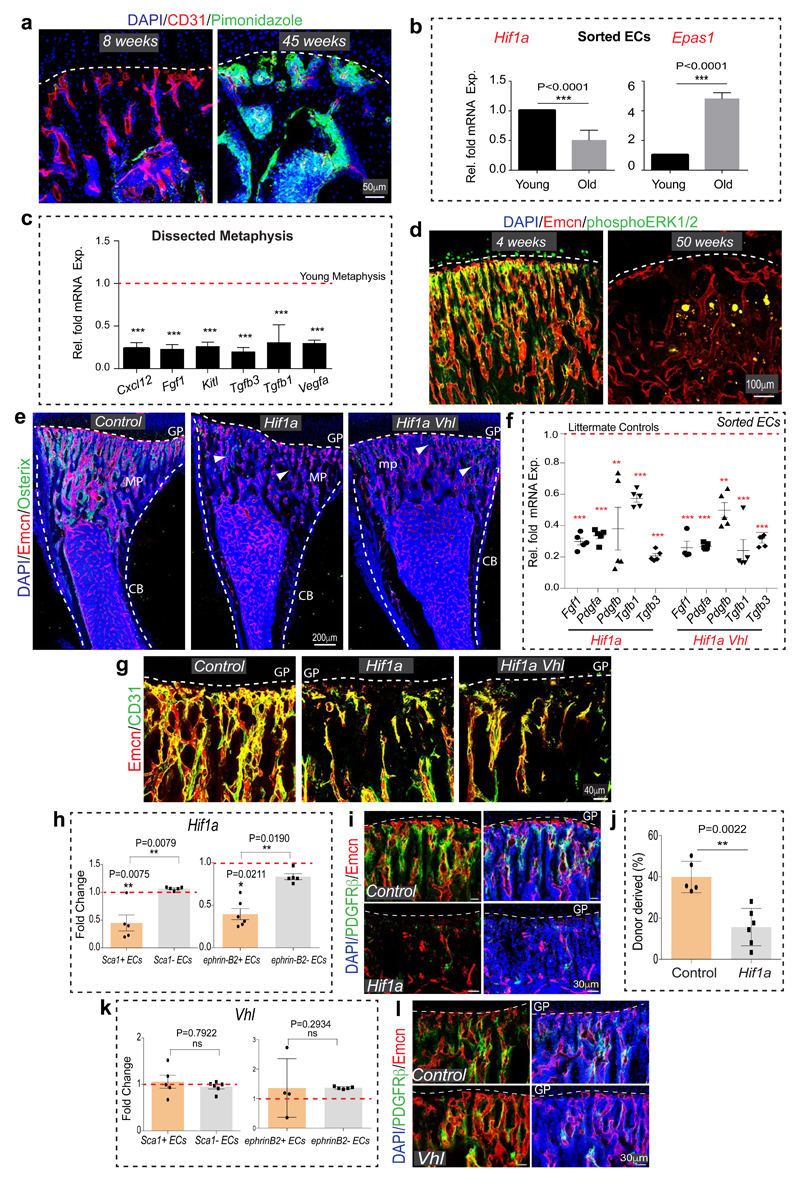
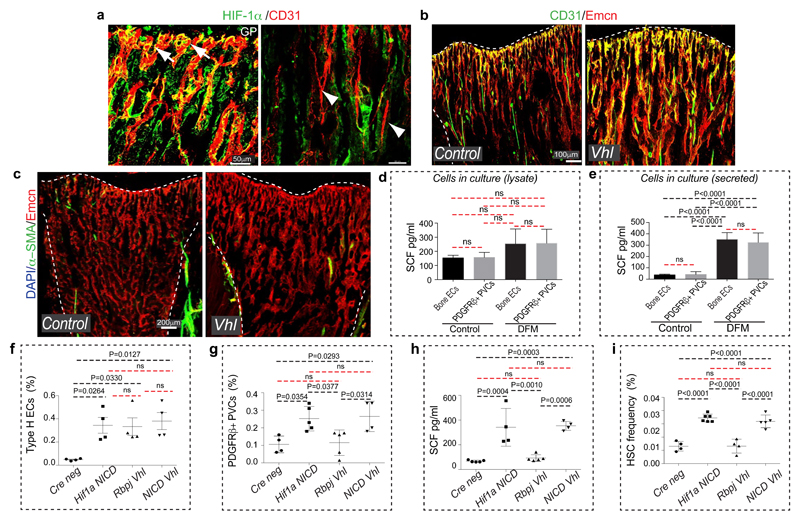
Similar to Notch, the hypoxia-inducible factor (HIF) pathway positively controls type H EC and osteoprogenitor abundance4. The metabolic environment, oxygenation (pimonidazole staining) and expression of Hif1a and Epas1 (Hif2a) in bone change during ageing (Extended Data Fig. 8a, b). In addition to its oxygen-dependent degradation, activity and expression of HIF-1α are promoted by growth factors and cytokines via activation of the phosphatidylinositol 3-kinase (PI3K) or mitogen-activated protein kinase (MAPK) pathways24. Expression of several growth factors and cytokines as well as levels of the phosphorylated MAPK ERK were reduced in aged metaphysis (Extended Data Fig. 8c, d), which might explain the age-dependent reduction of endothelial Hif1a. The von-Hippel-Lindau (VHL) protein is involved in the degradation of HIF, and EC-specific inactivation of the Vhl gene led to a striking expansion of type H vasculature and perivascular osteoprogenitors4. Highlighting the essential role of HIF-1α in these VHL-mediated effects, loss of type H ECs and reduced expression of EC-derived growth factors were not rescued in Hif1aiΔEC VhliΔEC double mutants (Extended Data Fig. 8e-g). In addition to decreased type H ECs, Hif1aiΔEC mutants exhibited significant reductions in Sca1+ ECs, ephrin-B2+ ECs, PDGFRβ+ perivascular cells, SCF levels, and HSC frequency (Fig. 3a-f; Extended Data Fig. 8h-j).
Figure 3. Endothelial HIF signalling and vascular niches.
a, Flow cytometric analysis of CD31- CD45- Ter119- PDGFRβ+ cells in Hif1aiΔEC and control long bone. Data represents mean±s.e.m (n=5 mutants and 6 controls). P values, two-tailed unpaired t-test.
b, ELISA analysis of cellular (n=8) and secreted (n=7 and 4) SCF levels in Hif1aiΔEC and control long bone. Data represents mean±s.d. P values, two-tailed unpaired t-test.
c, Flow cytometric quantitation of CD31- CD45- Ter119- PDGFRβ+ cells from VhliΔEC and control long bone. Data represents mean±s.e.m (n=7 and 5).
d, Graphs showing ELISA analysis of cellular (n=6) and secreted (n=5) SCF levels in VhliΔEC long bone relative to controls. Data represents mean±s.d. P values, two-tailed unpaired t-test.
e, Fold change in frequency of ephrin-B2+ Sca1+ ECs in NICDiOE-EC (n=6) and Fbxw7iΔEC (n=6) but not in VhliΔEC (n=7) long bone relative to littermate controls, as determined by flow cytometric analysis (see representative dot plot). Data represent mean±s.e.m. P values, two-tailed unpaired t-test.
f, Flow cytometric analysis of HSCs in Hif1aiΔEC (n=7 and 6) and VhliΔEC (n=9) long bone relative to Cre- littermates. Data represents mean±s.e.m. P values, two-tailed unpaired t-test.
g, Representative tile scan confocal images showing PDGFRβ (green, left panels) or α-SMA (green, right) in PdgfbiOE-EC and control tibia sections. Nuclei, DAPI (blue). Dashed lines mark growth plate (gp) or cortical bone (cb).
h, Flow cytometric quantitation of HSCs in PdgfbiOE-EC long bone relative to Cre- littermates (n=5). Data represents mean±s.e.m. P values, two-tailed unpaired t-test.
i, ELISA analysis of cellular SCF levels in PdgfbiOE-EC (n=5) long bone. Data represents mean±s.d. P values, two-tailed unpaired t-test.
j, Analysis of LTR-HSC contribution of PdgfbiOE-EC donor-derived BM cells, as determined by flow cytometry at 14 weeks after competitive transplantation together with recipient-derived CD45.1 BM cells into lethally irradiated mice. Data represents mean±s.e.m. (n=5 and 6 donors).
Arterial development frequently involves the incorporation of ECs from surrounding capillaries25,26. As larger arteries were devoid of HIF-1α signal (Extended Data Fig. 9a), Hif1aiΔEC arterial defects might be caused by alterations in adjacent type H capillaries. Indeed, despite of increased type H ECs in VhliΔEC mice, these mutants did not show significant increases in morphologically identifiable arterioles, Sca1+ ephrin-B2+ ECs and PDGFRβ+ perivascular cells (Fig. 3c, e, Extended Data Fig. 8k, l and 9c). Although secreted SCF levels were elevated, cellular SCF levels were not significantly altered and HSC frequency was not increased in VhliΔEC mutants (Fig. 3d, f). These results are consistent with previous studies demonstrating membrane-bound SCF as a more potent stimulator of c-Kit and effective driver of HSC adhesion in BM relative to secreted SCF27,28. In cultured primary bone ECs and PDGFRβ+ cells, HIF stabilization induced by deferoxamine mesylate (DFM) significantly increased secreted but not cellular/membrane-bound SCF (Extended Data Fig. 9d, e).
To further dissect differences and potential interplay between endothelial Notch vs. HIF signalling, we generated Hif1aiΔEC NICDiOE-EC, RbpjiΔEC VhliΔEC and NICDiOE-EC VhliΔEC double mutant mice. Notch activation in absence of HIF-1α (Hif1aiΔEC NICDiOE-EC) and stabilization of HIF-1 in absence of Notch signalling (RbpjiΔEC VhliΔEC) independently mediated the expansion of type H ECs (Extended Data Fig. 9f). Analysis of double mutants also corroborated that Notch signalling is essential for expansion of PDGFRβ+ perivascular cells, elevation of cellular SCF levels and enhancement of HSC numbers (Extended Data Fig. 9h-i). An important role of perivascular cells was further supported by findings in PdgfbiOE-EC mice overexpressing PDGF-B in ECs. PdgfbiOE-EC tibias contained more PDGFRβ+ and α-SMA+ cells, had higher levels of cellular SCF, and higher frequency of HSCs (Fig. 3g-j). Taken together, endothelial Notch but not HIF signalling can enhance the frequency of HSCs by improving key aspects of vascular niche function – namely arteries, type H ECs, perivascular cells, and cellular SCF production.
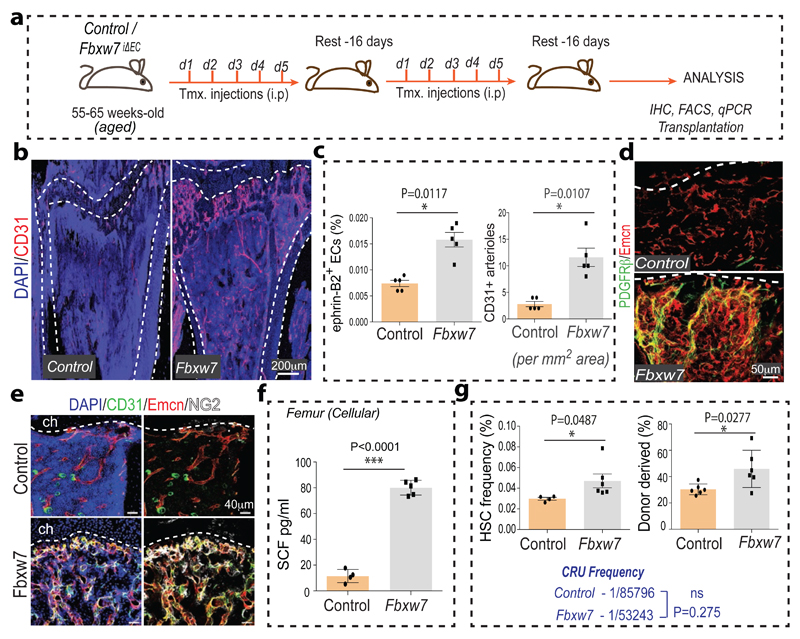
Given the decline of arteries, type H capillaries and SCF levels during ageing, we next addressed whether Notch activation in aged mice would improve the niche properties of bone endothelium (Fig. 4a). Remarkably, aged Fbxw7iΔEC bones showed profound expansion of CD31hi capillaries and CD31+ arterioles (Fig. 4b, c). The numbers of ephrin-B2+ ECs and of PDGFRβ+ or NG2+ perivascular cells, SCF levels and HSC frequency were significantly increased in mutants (Fig. 4c-g; Extended Data Fig. 10a) establishing that vascular niche function can be enhanced in aged mice.
Figure 4. Endothelial Notch reactivates HSC niches in aged mice.
a, Tamoxifen (Tmx) administration strategy for aged Fbxw7iΔEC mutants. Injection days (d1-d5) and rest periods are indicated.
b, Increase of CD31 (red) immunostained vessels in aged Fbxw7iΔEC tibia. Nuclei, DAPI (blue).
c, Quantitation of CD45- Ter119- CD31+ ephrin-B2+ ECs (by flow cytometry) and of CD31+ arterioles (by morphology) in Fbxw7iΔEC and control long bone. Data represents mean±s.e.m (n=5). P values, two-tailed unpaired t-test.
d, Increase of PDGFRβ+ (green) cells associated with Emcn+ (red) vessels in Fbwx7iΔEC tibia relative to control. Nuclei, DAPI (blue).
e, Increase in NG2+ (white) cells and abundance of CD31+ (green) and Emcn+ (red) vessels in Fbxw7iΔEC tibia. Dashed lines mark the chondrocyte zone (ch).
f, ELISA analysis of cellular SCF in Fbxw7iΔEC and control long bone. Data represent mean±s.d. (n=5 and 4), P values, two-tailed unpaired t-test.
g, Flow cytometric quantitation (left) of HSCs in aged Fbxw7iΔEC (n=6 and 4). Data represents mean±s.e.m. P values, two-tailed unpaired t-test.
Analysis of LTR-HSC contribution of BM cells from aged Fbxw7iΔEC and control donors, as determined by flow cytometry at 16 weeks after competitive transplantation with age-matched CD45.1 BM cells into lethally irradiated recipients. Data represents mean±s.e.m. (n=6).
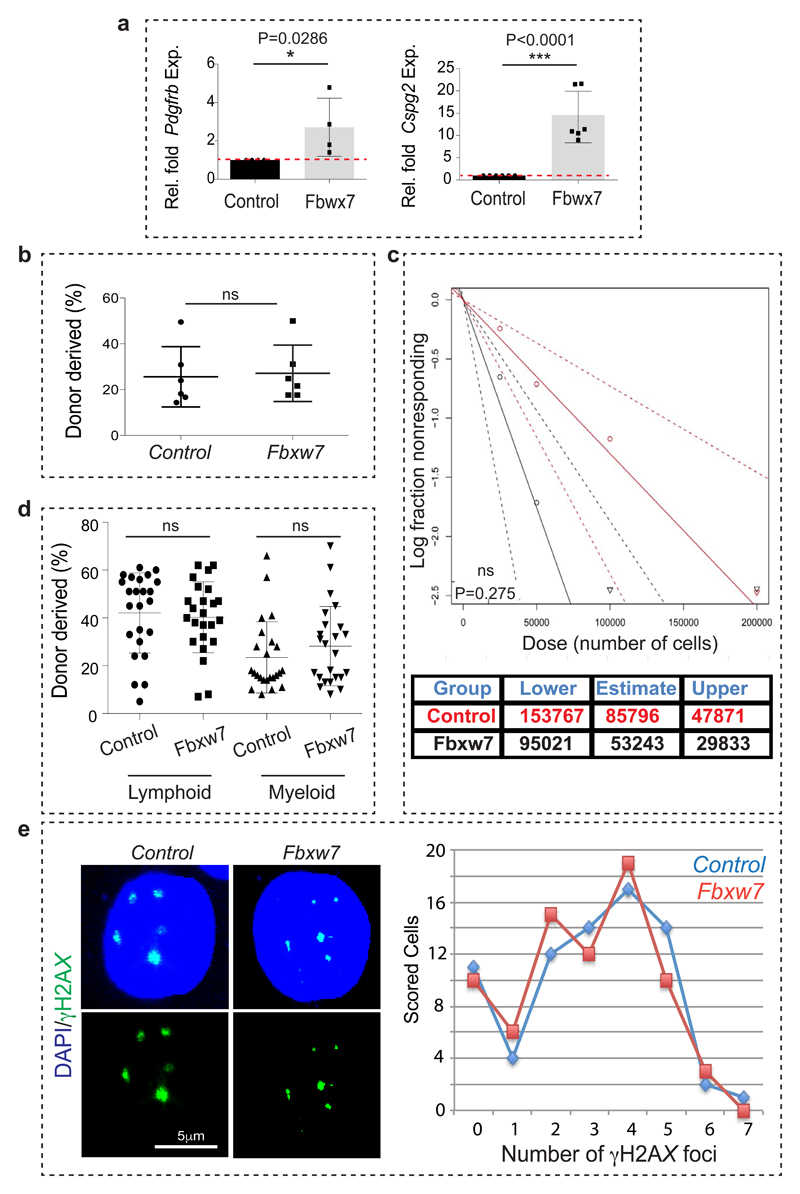
Ageing is associated with an accumulation of HSCs, which display cell intrinsic alterations such as DNA damage and reduced functionality15,30. Consistent with these studies, increase in the donor-derived chimerism could not be achieved upon transplantation of aged Fbxw7iΔEC BM cells along with young competitor BM (Extended Data Fig. 10b). Limiting dilution analysis, which allows the quantification of functional HSCs, indicated no statistically significant increase upon transplantation of aged Fbxw7iΔEC BM cells relative to control (Extended Data Fig. 10c, d). Analysis of DNA damage by γH2AX immunostaining also confirmed the persistence of age-related cell intrinsic impairments in Fbxw7iΔEC HSCs (Extended Data Fig. 10e). Thus, changes in the bone vasculature of old mice can boost the number of haematopoietic stem and progenitor cells but cannot revert the functionality of aged HSCs due to the persistence of cell-autonomous alterations.
Our results provide novel insight into the age-dependent changes occurring in the HSC niche. We propose that the enhancement of functional vascular niches in bone requires type H ECs, the formation of arterioles/arteries and the expansion of perivascular cells. Thus, vascular HSC niches are complex microenvironments involving multiple different cell populations and vessel subtypes. Our findings also establish that manipulation of the endothelium is sufficient for the improvement of vascular HSC niche function, which suggests the existence of molecular pathways coupling the behaviour of ECs and perivascular mesenchymal cells in bone.
Methods
Genetically modified and aged mice
C57BL/6J males were used for analysis of wild-type bone unless stated otherwise. Mice at the age of 2-5 weeks and 55-70 weeks were chosen for young and aged group sets, respectively. All EC-specific mutants were generated using Cdh5(PAC)-CreERT2 transgenic mice unless indicated otherwise. For gene inactivation in the postnatal endothelium, mice carrying loxP-flanked Rbpj (Rbpjlox/lox) alleles31 and Cdh5(PAC)-CreERT2 transgenics32 were interbred. To induce Cre activity and gene inactivation, offspring was injected with 500µg tamoxifen (Sigma, T5648) intraperitoneally every day from P10 to P14. The resulting RbpjiΔEC (CreERT2T/+ Rbpjlox/lox) mutants and Cre-negative littermate controls were sacrificed at P28, and femurs and tibiae were collected for analysis. Identical breeding and tamoxifen administration strategies were used to generate EC-specific mutants with Fbxw7lox/lox (ref. 33) or Dll4lox/lox mice34.
For EC-specific Hif1a deletions, Cdh5(PAC)-CreERT2 transgenic mice were interbred with conditional Hif1a (Hif1alox/lox) mutants35. To induce Cre activity and gene inactivation, pups were injected with 500µg tamoxifen (Sigma, T5648) intraperitoneally everyday from P10 to P14. Femurs and tibiae from Cdh5(PAC)-CreERT2T/+ Hif1alox/lox (Hif1aiΔEC) mutants and Cre-negative Hif1alox/lox (Controls) were collected on P20 after euthanasia. The same approach was used for experiments involving conditional Vhl mice36.
For Fbxw7 deletion in the vasculature of aged mice, we generated litters with Fbxw7 lox/lox Cdh5(PAC)-CreERT2 T/+ (Fbxw7 iΔEC) and Fbxw7 lox/lox (control) genotypes. To induce Cre activity and gene inactivation, 55 to 65 week-old mice were injected with 1000µg tamoxifen (Sigma, T5648) intraperitoneally everyday for 5 days. After a 16 days rest period, mice were subjected to a second round of tamoxifen injections with the same dosage and frequency as described above. After a further 16 days, mice were analyzed after euthanasia.
For overexpression of the Notch1 intracellular domain (NICD), Gt(ROSA)26Sortm1(Notch1)Dam/J mice37 and Cdh5(PAC)-CreERT2 transgenics were interbred. Tamoxifen administration (see above for injection schedule) was used to generate CreERT2-positive (NICDiOEC) mutants overexpressing NICD in ECs and corresponding controls. For EC-specific PDGFB overexpression, Rosa26-hPDGF-B mice38 were interbred with Cdh5(PAC)-CreERT2 or with Tie2 Cre39 transgenics. To study the interplay between Notch and HIF signalling in ECs, endothelial specific double mutant mice were generated using Cdh5(PAC)-CreERT2 transgenics. Cdh5(PAC)-CreERT2 mice were interbred with mice carrying the indicated combinations of Hif1alox/lox, Rbpjlox/lox, Vhllox/lox, and Gt(ROSA)26Sortm1(Notch1)Dam/J alleles.
For the detection of Notch cleavage and activity, Notch1tm3(cre)Rko/J (NICD-Cre) mice40, which carry a Cre recombinase fused to the C-terminus of the intracellular domain of Notch1, were mated with Rosa26-mG/mT reporter animals41. The resulting Notch1tm3(cre)Rko/JT/+ R26-mG/mTT/+ double heterozygotes were sacrificed and analysed at 3 weeks of age. Genetic labelling of cells expressing ephrin-B2 was performed using B6;129S4-Efnb2tm2Sor/J (Efnb2GFP/+) knock-in mice, which express H2B-GFP under control of the endogenous Efnb2 promoter8.
For labelling of proliferating cells, mice were intraperitoneally injected with 300µg of EdU (Invitrogen) 3 hr before euthanasia. Tibiae were immediately collected and processed. Bone marrow cells and bone sections were stained for EdU using Click-iT chemistry following the manufacturer’s instructions (Invitrogen).
For metabolic labelling with the hypoxia probe pimonidazole (Pimo, Hypoxyprobe Inc.), mutant and control mice were intraperitoneally injected with 60 mg/kg Pimo at 2 hr before euthanasia. Metabolized Pimo was detected by a rabbit antiserum against the non-oxidized, protein-conjugated form of pimonidazole (Hypoxyprobe Inc.).
All animals were genotyped by PCR. Protocols and primer sequences are provided upon request. Experiments involving animals were performed according to the institutional guidelines and laws, following protocols approved by local animal ethics committees.
Immunostaining of bone sections and cells
Freshly dissected bone tissues collected from wild-type mice or from mutants and their control littermates were immediately fixed in ice-cold 4% paraformaldehyde solution for 4 hr. Decalcification was carried out with 0.5M EDTA at 4°C with constant shaking and decalcified bones were immersed into 20% sucrose and 2% polyvinylpyrrolidone (PVP) solution for 24 hr. Finally, the tissues were embedded and frozen in 8% gelatin (porcine) in presence of 20% sucrose and 2% PVP. For immunofluorescent stainings and morphological analyses, sections were generated using low-profile blades on a Leica CM3050 cryostat.
For phenotypic analysis, mutant and littermate control samples were always processed, sectioned, stained, imaged, and analysed together at the same conditions and settings. For immunostaining, bone sections were air-dried, permeabilised for 10 min in 0.3% Triton X-100, blocked in 5% donkey serum at room temperature for 30 min, and probed with the primary antibodies diluted in 5% donkey serum in PBS for 2 hr at room temperature (RT) or overnight at 4°C.
After primary antibody incubation (Supplementary Table 1), sections were washed with PBS for three times and incubated with appropriate Alexa Fluor-coupled secondary antibodies (1:400, Molecular Probes) for 1 hr at RT. Nuclei were counterstained with DAPI. Sections were thoroughly washed with PBS before mounting them using FluoroMount-G (Southern Biotech). Finally, cover slips were sealed with nail polish.
Immunostaining of sorted haematopoietic stem and progenitor cells was performed as described previously42. Briefly, cells were pipetted onto poly-lysine coated slides, incubated for 10 min, fixed with 4% PFA for 10 min at room temperature, permeabilized in 0.15% Triton X-100 for 2 min at room temperature and blocked in 2% donkey serum overnight at 4 °C. Slides were then incubated for 2 h with the anti-phospho-H2AX, washed thrice and incubated with the appropriate secondary antibody.
Image acquisition and quantitative analysis
Immunofluorescent stainings were analysed at high resolution with a Zeiss laser scanning confocal microscope, LSM-780. Z-stacks of images were processed and 3D-reconstructed with Imaris software (version 7.00, Bitplane). Imaris, Photoshop and Illustrator (Adobe) software was used for image processing in compliance with Nature’s guide for digital images. All quantifications were done with ImageJ and Imaris software on high-resolution confocal images.
Quantitative RT-PCR
For the analysis of mRNA expression levels in type H or type L endothelium, CD31hi Emcnhi and CD31lo Emcnlo cells were sorted by FACS directly into the lysis buffer of the RNeasy Mini Kit (QIAGEN). Total RNA was isolated according to manufacturer’s protocol. A total of 100 ng RNA per reaction was used to generate cDNA with the iScript cDNA Synthesis System (Bio-Rad). Quantitative PCR (qPCR) was performed using TaqMan gene expression assays on ABI PRISM 7900HT Sequence Detection System. The FAM-conjugated TaqMan probes Efnb2 and Sox17 were used along with TaqMan Gene Expression Master Mix (Applied Biosystems). Gene expression assays were normalized to endogenous VIC-conjugated Actb probes as standard. For analysis of mRNA expression levels from whole bones, dissected femurs or dissected metaphysis (as described in the figure legends) were immediately crushed finely, digested with collagenase, centrifuged to obtain a pellet, which was then lysed into lysis buffer of RNeasy Mini Kit (QIAGEN). For cells in culture, culture medium was completely removed and cells were immediately lysed with lysis buffer. A total of 500 ng RNA per reaction was used to generate cDNA with the iScript cDNA Synthesis System (Bio-Rad), which was further processed as described above. FAM-conjugated TaqMan probes Sp7, Cspg4, Pdgfrb, Sp7, Acan, Cfd, Hif1a, Epas1, Cxcl12, Fgf1, Kitl, Tgfb3, Tgfb1 and Vegfa were used along with TaqMan Gene Expression Master Mix (Applied Biosystems) to perform qPCR.
Flow cytometry
For flow cytometric analysis and sorting of type H and type L ECs, tibiae and femurs were collected, cleaned thoroughly to remove the adherent muscles. The epiphysis was removed and only the metaphysis and diaphysis regions were processed. Tibias were then crushed in ice cold PBS with mortar and pestle. Whole bone marrow was digested with collagenase incubation at 37°C for 20 min. Equal number of cells were then subjected to immunostaining with Emcn antibody (Santa Cruz, sc-65495) for 45 min. After washing, cells were stained with APC-conjugated CD31 antibody (R&D Systems, FAB3628A) for 45 min and phycoerythrin conjugated secondary anti-rat antibody. After washing, cells were acquired on BD FACS Canto flow cytometer or BD FACSVerse and analysed using BD FACSDiva (Version 6.0, BD Bioscience) or BD FACSuite softwares. Cell sorting was performed with a BD FACS Aria II.
For demarcating and sorting CD31hi Emcnhi ECs, first standard quadrant gates were set. Subsequently, to differentiate CD31hi Emcnhi cells from the total double positive cells in quadrant 2, gates were arbitrarily set at >104 log Fl-4 (CD31-APC) fluorescence and >104 log Fl-2 (Endomucin-PE) fluorescence.
For the analysis of total ECs in bone, tibiae were processed as described above to obtain single cell suspensions, which were stained with biotin-coupled CD45 (BD, 553077) or Ter119 (BD, 559971) antibodies for 45min. After washing in PBS, cells were stained with Streptavidin PE-Cy5 (BD, 554062) and Alexa Fluor488-conjugated CD31 (R&D Systems, FAB3628G) antibodies for 45 min. After washing, cells were acquired on FACS Canto and FACS Verse flow cytometers and analysed using FACSDiva (Version 6.0, BD Bioscience) and FACS Suite softwares respectively. Total bone ECs were quantified as CD31+/CD45-/Ter119-. Endomucin was used to distinguish Emcn-negative arterial ECs from Emcn+ sinusoidal and venous cells.
For the analysis of HSC frequency in the bone marrow, BM cells were isolated by crushing the long bones with mortal and pestle in Ca2+ and Mg2+ free PBS 2% heat-inactivated bovine serum. The cells were drawn by passing through a 25G needle several times and filtered with a 70-µm filter. The following antibodies were used to stain HSCs biotin labelled lineage markers (CD5, CD11b, CD45R, Gr-1 and Ter119), cKit, Sca-1, CD48 and CD150 antibodies (Supplementary Table 1).
For the enrichment and sorting of hematopoetic stem and progenitor cells, bone marrow cells were isolated by crushing the long bones with mortal and pestle in Ca2+ and Mg2+ free PBS 2% heat-inactivated bovine serum. The cells were drawn by passing through a 25G needle several times and filtered with a 70-µm filter. The obtained single cell suspension obtained was subjected to lineage depletion (MACS, Miltenyi Biotech). Lineage depleted bone marrow cells were then stained with cKit and Sca1 antibodies (Supplementary Table 1). After washing, cell sorting was performed with a BD FACS Aria II.
For the analysis of perivascular cells, Sca1+ ECs, ephrin-B2+ ECs and HSC frequency, the above-described protocol was used to obtain the single cell suspension followed by the immunostaining with the appropriate antibodies (Supplementary Table 1).
BM transplantation experiments
Competitive repopulation assays were performed using the CD45.1/CD45.2 congenic system. Equivalent volumes of bone marrow cells collected from EC-specific mutant mice or littermate control mice (CD45.2) were transplanted into lethally irradiated (12Gy) CD45.1 recipients with 0.3x10⁶ competitor CD45.1 cells. CD45.1/CD45.2 chimerism of recipient blood was analyzed up to seven months after transplantation using flow cytometry analysis. For the secondary transplantation (performed for Fbxw7iΔEC mutant mice and littermate controls), 1x10⁶ BM cells from CD45.1 mice that had previously undergone transplantation at 1:1 ratio were isolated at 7 months post-transplantation and injected into lethally irradiated recipients. For calculation of competitive repopulating units (CRU), recipient mice were transplanted with limiting dilutions of donor derived BM cells (2.5x10⁴-2x10⁵) together with 2x10⁵ recipient derived BM cells. Mice were sacrificed after 18 weeks and multi-lineage myelo-lymphoid donor derived contribution in the peripheral blood was assessed using flow cytometry analysis. HSC-CRU frequency and statistical significance was determined using ELDA software (http://bioinf.wehi.edu.au/software/elda/)43,44.
Primary culture of ECs and PDGFRβ+ cells from bone
Tibiae and femurs from wild-type mice were collected in sterile Ca2+ and Mg2+ free PBS, crushed with mortar and pestle, subjected to collagenase digestion, filtered and washed thrice to obtain a single cell suspension. Endothelial cells were then sorted using Endomucin antibody (cat. no. SC-65495) and Dynabeads sheep anti-Rat IgG (Invitrogen). Sorted ECs were then plated on dishes coated with fibronectin and cultured in endothelial cell growth medium (EBM-2, Clonetics; Lonza) supplemented with EGM-2 SingleQuots (CC-4176, Clonetic; Lonza).
PDGFRβ+ cells were sorted from single cell suspensions using CD140b/PDGFB Receptor β antibody (eBioscience, cat. no. 14-1402-82) and Dynabeads sheep anti-Rat IgG (Invitrogen). Sorted PDGFRβ+ cells were cultured on tissue culture plates containing in alpha MEM (Gibco) and 10% fetal bovine serum (Gibco).
Cultures of ECs or PDGFRβ+ cells were maintained at 37°C with 5% CO2 in a humidified atmosphere. For DFM treatment and subsequent analysis, cultures between passage 1 and 2 were used. Cells were treated with DFM (6.25 mg/ml of culture medium) for the duration of 36 hrs and subsequently cell culture medium (directly) or cells after trypsinization, three washings and lysate preparation were used for Enzyme-Linked Immunosorbent Assay.
ELISA
SCF levels in the mice bone supernatant/extracellular fluid (secreted SCF) or cell culture medium (secreted/extracellular SCF) or cell lysate from cultured cells (cellular/membrane-bound SCF) or cell lysate (cellular/membrane-bound SCF) prepared from the single cell suspension of femurs (see primary culture section) were determined by Enzyme-Linked Immunosorbent Assay (ELISA) Kits (Sigma-Aldrich and USCN Business Co., Ltd.).
CFU-F and MSC differentiation assays
CFU-F assay was performed as described previously16. MSC differentiation in to osteogenic, chondrogenic and adipogenic lineages was performed using the MSC functional identification kit (R&D Systems) according to manufacturer’s instructions. 14 days post differentiation qPCR analysis was performed.
Statistical analysis
All data are presented as either mean ± s.e.m. or mean ± s.d. (as indicated in figure legends). The data presented in the figures reflect multiple independent experiments performed on different days using different mice. Unless otherwise mentioned most of the data presented in figure panels is based on three independent experiments. The significance of difference was determined using two-tailed Student's t test unless otherwise mentioned. P > 0.05 were considered not significant (ns); P <0.05 denoted as *; P <0.01 denoted as **; P <0.001 denoted as ***. Student's t test with Welch’s correction was performed when group sizes were not equal. For analysis of the statistical significance of differences between more than two groups, we performed repeated measures one-way analysis of variance (ANOVA) tests with Greenhouse–Geisser correction (variances between groups were not equal) and Tukey’s multiple comparison tests to assess statistical significance with a 95% confidence interval. In all the figures n refers to the number of mice. For data with unequal group sizes, the former numerical value for n refers to mutants and the latter refers to control mice. All statistical analyses were performed using Graphpad Prism software. No randomization or blinding was used and no animals were excluded from analysis. Sample sizes were selected on the basis of previous experiments. Unless otherwise indicated results are based on three independent experiments to guarantee reproducibility of findings.
Extended Data
Extended Data Figure 1. Summary of key findings and analysis of vessel subtypes.
a, Type H vessels express arterial markers and, unlike type L (sinusoidal) vessels, make direct connections to distal arterioles. PDGFRβ+ perivascular cells (PVC) are selectively abundant around type H vessels and endosteal arteries. In addition, HSCs are frequently detected near the type H endothelium and arterioles in the endosteal region. Endothelial Notch signalling drives artery formation, expansion of type H ECs and PDGFRβ+ PVCs, production of cell-bound SCF and thereby enhances vascular HSC niche function. By contrast, endothelial HIF signalling fails to induce artery formation and expansion of PDGFRβ+ PVCs, which does not result in more HSC niches despite of increases in type H ECs and Osterix+ osteoprogenitor (OP) cells.
b, Confocal images of 8 week-old tibial metaphysis showing the direct connection between a CD31hi (green) Endomucin- (Emcn, red) α-SMA+ artery (white) and CD31hi Emcnhi type H capillaries. Dashed line mark growth plate (gp).
c, Representative confocal tile scan of 2 week-old Efnb2GFP/+ (green) tibia stained with Emcn (red). Note GFP signal in arteries (arrows) and type H vessels in metaphysis and endosteum (arrowhead), while type L vessels lack Efnb2GFP/+ expression.
Extended Data Figure 2. Relationship between type H capillaries and arterioles.
a, Tile scan (left panel) and different representations (merged channels) of image data in inset. Shown is a 4 week-old tibial metaphysis (mp) immunostained for CD31 (green), Emcn (red) and α-SMA (white). CD31hi (green) Emcn- arteries with α-SMA+ coverage are directly connecting to type H ECs (arrowheads). Diaphysis (dp); endosteum (es); growth plate (gp).
b, Maximum intensity projections of 4 week-old Efnb2GFP/+ (GFP, green) tibial metaphysis and diaphysis immunostained for CD31 (white) and Emcn (red). Panels in centre and on the right different representations (merged channels) of image data. Only Emcn- arterial ECs (arrowheads) and Emcnhi type H ECs in metaphysis and endosteum (arrows) are positive for GFP, while diaphyseal type L ECs lack Efnb2GFP expression.
c, Confocal images of Efnb2GFP metaphysis showing GFP+ (green) Emcnhi (red) type H ECs (arrows) connecting to α-SMA+ (white) cell-covered, Emcn- artery (arrowheads).
Dashed lines mark growth plate (gp) or compact bone next to endosteum (es). mp, metaphysis; dp, diaphysis. Nuclei, DAPI (blue).
d, RT-qPCR analysis of Efnb2 and Sox17 expression (normalised to Actb) in sorted tibial CD31hi Emcnhi relative to CD31lo Emcnlo ECs. Data represent mean±s.d (n=6; three independent experiments). P values, two-tailed unpaired t-test. UD; undetectable.
Extended Data Figure 3. Characterization of bone vessel populations.
a, b, Confocal (a) and tile scan confocal (b) images showing Emcn (red) and Sox17 (green) expression in 4 week-old tibia. Dashed line marks growth plate (gp) in the metaphysis (mp). Sox17 is expressed by type H ECs (arrows) and arteries (arrowheads), whereas signal is absent in type L vessels of the diaphysis (dp).
c, Confocal images showing GFP (green), Emcn (red) and Sox17 (white) expression in the metaphysis region and diaphysis region of a Efnb2GFP/+ tibial section. Nuclei, DAPI (blue). Note Sox17 and GFP double positive cells in type H capillaries (arrow) connecting to Efnb2GFP+ Emcn- artery (arrowhead).
d, Representative confocal images from metaphysis (left panel) and diaphysis (right panel) regions of 4 week-old murine long bone showing Emcn (red), CD31 (green) and NRP1 (white) immunostaining. Nuclei, DAPI (blue). NRP1 marks type H capillaries (arrow) and adjacent artery (arrowhead), while type L vessels lack detectable NRP1 expression.
e, f, Representative confocal (e) and tile scan confocal (f) images showing Sca1 (red) and CD31 (green) immunostaining in metaphysis (mp) and diaphysis (dp) of 4 week-old tibia. Sca1 staining decorates CD31hi arteries (arrowheads) and type H ECs but not type L ECs. Dashed line marks border of the growth plate (gp).
g, Maximum intensity projections of EdU (red) labelled 3 week-old tibia immunostained for CD31 (green) and α-SMA (white). Nuclei, DAPI (blue). Proliferating (EdU+) CD31hi type H ECs (arrow) were found near the growth plate (dashed line), whereas distal α-SMA+ cell-covered arteries (arrowheads) lack EC proliferation.
h, Confocal images showing EdU labelling in 5 week-old Flk1-GFP long bone. Note EdU+ and GFP+ (arrows) in the endothelial columns close to the growth plate (gp). Straight, small calibre arterioles (arrowheads) lack proliferating ECs.
i, Confocal images of 3 week-old Efnb2GFP/+ (green) tibia sections with α-SMA immunostaining (white). Ephrin-B2+ arteriolar ECs exhibit elongated nuclei (blue arrowheads), which are not typical for type H ECs. Overlap of GFP and EdU signals in type H capillaries (arrows) but not in arteries (blue arrowheads).
Extended Data Figure 4. Distribution of perivascular cells and HSCs.
a, PDGFRβ (green) cell localization in 4 week-old tibia. PDGFRβ+ cells surround arteries and Emcn+ (red) CD31+ (white) type H vessels in metaphysis (mp) and endosteum (arrowhead), but not diaphyseal (dp) sinusoidal vessels. Growth plate (gp).
b, Representative tile scan images of 4 week-old long bone immunostained for Emcn (red) and NG2 (green). Nuclei, DAPI (blue). Dashed lines mark growth plate (gp) and compact bone. Note abundance of NG2 signals around type H vessel columns (arrowheads) in metaphysis (mp).
c, Confocal images of 4 week-old NG2-DsRed (DsRed shown as green) transgenic long bone after CD31 immunostaining (red). Nuclei, DAPI (blue). Note abundance of DsRed+ cells around CD31hi (type H) capillaries.
d, Sections of 3 week-old tibia immunostained for Emcn (red), NG2 (light blue) and PDGFRβ (green) as indicated. PDGFRβ+ cells were abundant around arteries (arrow) and type H vessels (arrowheads) in metaphysis (mp). Growth plate (gp).
e, Graph showing CD150+ CD48− Lin− Sca1+ c-Kit+ HSC frequency in single cell suspension. Metaphysis (mp) region from long bones was dissected and, subsequently, these bone fragments were crushed and subjected to collagenase digestion. Simultaneously, CD150+ CD48− Lin− Sca1+ c-Kit+ HSC frequency was also quantitated for BM flushed from diaphysis (dp). Data represent mean±s.e.m (n=5; three independent experiments). P values, two-tailed unpaired t-test.
f, Maximum intensity projections showing CD31+ (red) arteries (arrows) and type H vessels. CD150+ cells (green) in proximity of metaphyseal (mp) and endosteal (es) endothelium (arrows) as well as CD31+ arterioles (arrowheads). Top right panel shows distribution of CD150+ and CD48+ cells in 4 week-old tibial metaphysis. Arrowheads in higher magnification of inset (bottom) mark CD150+ and CD48- HSCs. Dashed line marks growth plate (gp).
g, Perivascular localization of CD150+ (green) CD48- Lineage- (blue) HSCs (arrowhead) near Emcn+ (red) endothelium.
h, Representative confocal image showing CD150+ cells (green) in the 4 week-old tibial metaphysis. Arrow marks rare CD150+ CD48- cell, which is also shown at high magnification in inset. Top panels show 3D reconstruction of a thick section, while optical slices (mimicking thin sections) are shown at the bottom. Note that CD150+ CD48- cell (arrow) is only captured in one optical section and would therefore appear more isolated in thin tissue sections.
i, Maximum intensity projections (top panels) showing CD150+ (green) cells in 4 week-old tibial metaphysis (mp). Arrow marks rare CD150+ CD48- cell, arrowhead indicates nearby CD150+ megakaryocyte. Higher magnifications of inset show 3D projection and thin optical slices, as indicated. General abundance of CD150+ cells appears strongly reduced in individual optical sections and the indicated CD150+ CD48- cell (arrow) is only captured in one slice. Endosteum (es). Notably, CD150+ cells were frequently found in clusters in thick cryosections (100µm), but appeared scattered in thin optical slices, which reflects the reported widespread distribution throughout the bone marrow.
Extended Data Figure 5. Age-associated changes in bone vasculature.
a, Representative confocal images from the metaphysis of young (3 week-old) long bone and the corresponding region in aged (70 week-old) long bone after α-SMA (green) and Emcn (red) immunostaining. Note decline in α-SMA+ cell-covered arteries in aged samples. Growth plate (gp) and compact bone (cb).
b, Dot plots showing ephrin-B2+ ECs sorted by flow cytometry from the single cell suspension isolated from long bone. Total ECs in the single cell suspension were identified as CD45-/Ter119-/CD31+ cells.
c, qPCR analysis of Kitl expression (normalised to Actb) by CD31hi Emcnhi type H ECs and arterial ECs relative to CD31lo Emcnlo ECs sorted from murine tibia. Arterial ECs were identified and sorted as Emcn- CD31+ ephrin-B2+ cells. Data represent mean±s.d (n=6; in three independent experiments). P values, two-tailed unpaired t-test. Note significantly higher Kitl expression in type H and arterial ECs relative to type L ECs.
d, Confocal images showing young (4 week-old) and aged (65 week-old) NG2-DsRed (red) long bone. Nuclei, DAPI (blue).
e, Maximum intensity projections of sectioned metaphyseal regions from young (3 week-old) and aged (70 week-old) long bone immunostained for PDGFRβ (green) and Emcn (red). Nuclei, DAPI (blue). Dashed lines indicated the border to growth plate (gp). Arrows indicate the growth plate (gp) type H capillaries and arrowhead shows the artery.
f, Representative confocal images showing NICD-Cre-induced GFP expression (green) in Emcn+ (red) type H capillaries (arrowheads) and Emcn- arteries (arrows) in 3 week-old tibia. Dashed lines mark growth plate (gp) or compact bone (cb).
g, Representative tile scan confocal images of 3 week-old tibia sections from NICD-Cre knock-in transgenic mice in the in the Rosa26-mT/mG reporter background. Vessels have been visualised by Emcn (red) immunostaining. Nuclei, DAPI (blue). Note high GFP expression in type H endothelium (arrows) and arteries (arrowheads). Dashed lines mark growth plate (gp) and endosteum; metaphysis (mp) and diaphysis (dp) are indicated.
h, Contour plot showing intensities of CD31 immunostaining and GFP in single cell suspension obtained from 3 week-old NICD-Cre Rosa26-mT/mG mice. ECs were demarcated as CD45- Ter119- CD31+. Note high GFP intensity in the CD31hi EC subset.
Extended Data Figure 6. Effect of endothelial Notch on the BM stroma.
a, b, Confocal images showing CD31 (green) and Emcn (red) immunostained tibia sections of NICDiO-EC (NICD) mutant and littermate control (a) or Fbxw7iΔEC mutant (b). Small, interconnected arterioles (arrowheads) were abundant in Notch gain-of-function mutants. Growth plate (gp), metaphysis (mp) and diaphysis (dp) are indicated.
c, Representative confocal images from NICDiO-EC mutant (NICD) and littermate control long bone after Emcn (red), CD31 (white) and PDGFRβ (green) immunostaining. Note strong accumulation of PDGFRβ+ cells in NICDiO-EC bone (arrowheads).
d, Quantitative analysis of Sca1+ ECs and Sca1- ECs in Fbxw7iΔEC or NICDiOE-EC long bone relative to Cre- littermate controls. Data represents mean±s.e.m (n=6). P values, two-tailed unpaired t-test. Total ECs were identified as CD45- Ter119- CD31+ cells, as represented in the FACS plots. Note significant increase of Sca1+ ECs in mutants, whereas Sca1- ECs remain comparable to control.
e, Confocal tile scans of 4 week-old Fbxw7iΔEC, Dll4iΔEC and littermate control tibiae immunostained with Emcn (red) and α-SMA (green). Growth plate (gp) and compact bone (cb). Unless otherwise mentioned data presented in figure panels is based on three independent experiments.
Extended Data Figure 7. Endothelial Notch improves HSC niche function.
a, Representative dot plot showing the gating strategy used for defining the CD31- CD45- Ter119- Sca-1+ and PDGFRα+ MSCs. Graph in middle panel illustrates the flow cytometric quantification of CD31- CD45- Ter119- Sca-1+ PDGFRα+ MSCs in Fbxw7iΔEC and littermate control femurs. Note increase of Sca-1+ and PDGFRα+ MSCs in Fbxw7iΔEC mutants (n=8). Graph on right shows quantification of fibroblast colony-forming units (CFU-F) from Fbxw7iΔEC and control femurs (n=7). Data represents mean±s.e.m. P values, two-tailed unpaired t-test. Flow cytometric quantification of CD31- CD45- Ter119- Sca+ PDGFRα+ mesenchymal stem cells (MSCs) and CFU-F assays confirms a significant increase in MSC frequency.
b, Transcripts associated with osteogenic (Sp7), chondrogenic (Acan) and adipogenic (Cfd) differentiation were quantified by qRT-PCR after 14 days of differentiation culture of mesenchymal stromal cells isolated from femur. Data represents mean±s.d (n=6). P values, two-tailed unpaired t-test. No significant differences were seen for Fbxw7iΔEC and control cells in vitro. The differentiation potential of Fbxw7iΔEC cultured MSCs ex vivo was not altered.
c, ELISA analysis of cellular SCF (lysate prepared from washed cells) in Fbxw7iΔEC (n=8 and 7) and RbpjiΔEC (n=7 and 9) long bone. Data represents mean±s.d. P values, two-tailed unpaired t-test.
d, Graphs showing ELISA analysis of extracellular SCF in Fbxw7iΔEC (n=5) and RbpjiΔEC (n=6 and 5) long bone. Data represents mean±s.d. P values, two-tailed unpaired t-test.
e, Increased chimerism of Fbxw7iΔEC mutant (also shown as Fig. 4e; upper panel) relative to littermate control BM is shown after primary and secondary transplantation (at 4 months post-transplantation). Donor-derived chimerism was analysed by transplanting BM cells harvested from Fbxw7iΔEC mutant mice or littermate controls together with recipient CD45.1 recipient-derived BM cells into lethally irradiated recipients. For the secondary transplantation, 1x10⁶ BM cells from CD45.1 mice that had previously undergone transplantation at 1:1 ratio at seven months post-transplantation were injected into lethally irradiated recipients. Data represents mean±s.e.m. (n=5 donors), P values, two-tailed unpaired t-test.
f, Levels of donor-derived multi-lineage contribution were determined for Fbwx7iΔEC and control BM cells at 18 weeks post transplantation by flow cytometry. HSC-CRU frequency and statistical significance was determined using ELDA software (n=3 mice per dilution). Note significant increase in the HSC frequency in the Fbxw7iΔEC mutant BM compared to littermate controls.
g, Flow cytometric quantification of hematopoietic lineages in the Fbxw7iΔEC and control BM. Data represents mean±s.e.m. (n=14), P values, two-tailed unpaired t-test. Frequency of cells belonging to different hematopoietic lineages was not significantly altered in Fbxw7iΔEC mutants.
h, Representative confocal images of EC-specific Notch2iΔEC or global Notch4 mutants (Notch4KO) and corresponding littermate control tibial bones after Emcn (red), PDGFRβ (blue) and Sca-1 (green) immunostaining.
i, Flow cytometric quantitation of type H ECs in Notch2iΔEC and Notch4 knockout bones relative to controls. Data represent mean±s.e.m. (n=5 in two independent experiments), P values, two-tailed unpaired t-test.
j. Flow cytometric quantitation of HSCs in Notch2iΔEC and Notch4 knockout BM relative to controls. Data represent mean±s.e.m. (n=5 in two independent experiments), P values, two-tailed unpaired t-test.
k. Representative confocal images of 4 week-old wild-type tibia showing Notch3 (green) and Emcn (red) immunostaining. Note absence of Notch3 expression in bone ECs. Nuclei, DAPI (blue). Unless otherwise mentioned data presented in figure panels is based on three independent experiments.
Extended Data Figure 8. HIF signaling in bone endothelium.
a. Maximum intensity projections of Pimonidazole (green) stained young 8-week old and aged 45-week old tibia sections. Nuclei, DAPI (blue); CD31 immunostaining is shown in red. Dashed lines indicate the border of the growth plate (gp). While pimonidazole staining was largely absent from 8 week-old metaphysis, hypoxic cells were readily detectable in the equivalent region in 45 week-old animals.
b. Quantifications of Hif1a and Epas1 transcripts in sorted ECs from young (4 week-old) and old (60 week-old) bone. Data represent mean±s.d. (n=11). P values, two-tailed unpaired t-test. Endothelial expression of Hif1a transcripts was strongly reduced in aged animals, whereas expression of the related Epas1 (Hif2a) gene was significantly increased.
c, Quantitative analysis of Cxcl12, Fgf1, Kitl, Tgfb3, Tgfb1 and Vegfa transcripts in dissected 60 week-old metaphysis relative to samples from young mice. Data represent mean±s.d. (n=5). P values, two-tailed unpaired t-test.
d, Phospho-MAPK (phosphoERK1/2; green) and Emcn (red) immunostaining in young 4 week-old and aged 50 week-old metaphysis. Nuclei, DAPI (blue). Dashed lines mark growth plate.
e, Representative tile scan confocal images obtained from control, Hif1aiΔEC and double mutant Hif1aiΔEC VhliΔEC tibial sections. Immunostaining for Emcn (red) and Osterix (green) is shown. Nuclei, DAPI (blue). The decline of type H ECs and Osterix+ cells in Hif1aiΔEC bone was not recovered in Hif1aiΔEC VhliΔEC double mutants.
f, Graph showing Fgf1, Pdgfa, Pdgfb, Tgfb1 and Tgfb3 transcript levels in sorted ECs from Hif1aiΔEC and Hif1aiΔEC VhliΔEC double mutant bones normalized to littermate control. Data represent mean±s.d.; (n=4-7). P values, two-tailed unpaired t-test.
g, Representative confocal images showing immunostaining for CD31 (green) and Emcn (red) in Hif1aiΔEC mutant, Hif1aiΔEC VhliΔEC double mutant and control bones.
h, Flow cytometric analysis of Sca1+/- (n=5) and Ephrin-B2+/- ECs (n=5 and 6) among total CD45- Ter119- CD31+ ECs in Hif1aiΔEC long bones relative to Cre- littermates. Data represent mean±s.e.m. P values, two-tailed unpaired t-test.
i, Representative confocal images of Hif1aiΔEC or control tibial metaphysis after Emcn (red) and PDGFRβ (green) immunostaining. Nuclei, DAPI (blue). Dashed lines mark the growth plate (gp). Note decline in Emcnhi ECs and PDGFRβ+ perivascular cells in Hif1aiΔEC mutant.
j, Analysis of donor derived cells indicating LTR-HSC contribution, as determined seven months after transplantation by flow cytometry. Bone marrow cells harvested from Hif1aiΔEC mutant mice or littermate controls were transplanted together with recipient CD45.1 recipient derived bone marrow cells into lethally irradiated recipient mice. Data represents mean±s.e.m. (n=6 donors). P values, two-tailed unpaired t-test.
k, Quantitative analysis of Sca1+/- ECs (n=6 and 5) and Ephrin-B2+/- ECs (n=5 and 4) among total CD45- Ter119- CD31+ ECs in VhliΔEC long bone relative to Cre-littermates. Data represent mean±s.e.m (n=4-6). P values, two-tailed unpaired t-test.
l, Representative confocal images of VhliΔEC and control tibial metaphysis with Emcn (red) and PDGFRβ (green) immunostaining. Nuclei, DAPI (blue). Dashed lines mark growth plate (gp). Unless otherwise mentioned data presented in figure panels is based on three independent experiments.
Extended Data Figure 9. Relation between Notch and HIF in bone ECs.
a, Metaphysis region of 2 week-old tibia after CD31 (red) and HIF-1α (green) immunostaining. Dashed line marks the growth plate; arrows indicate type H endothelium. Note absence of HIF-1α signal in CD31+ arteries (arrowheads in right panel).
b, Confocal images showing CD31 (green) and Emcn (red) immunostaining of VhliΔEC mutant and littermate control tibia sections. Dashed lines mark growth plate. Note increase in type H capillaries.
c, Tile scan confocal images showing α-SMA (green) and Emcn (red) immunostained tibia. Similar amounts of α-SMA+ cell-covered vessels (arteries) were visible in VhliΔEC and control samples.
d, e, ELISA analysis of cellular (cell lysates, d) and secreted SCF levels (cell culture supernatant, e) in cell lysates of cultured BM-derived ECs and PDGFRβ+ perivascular cells (PVCs; n=5 replicates) after treatment with vehicle control or DFM. Data represents mean±s.d. P values, one-way ANOVA with Tukey’s multiple comparison post-hoc test.
f, g, Frequency (%) of type H ECs (f, n=4) and PDGFRβ+ PVCs (g, n=5 mutants and 6 controls) among total BM cells in Hif1a iΔEC NICDiOEC, RbpjiΔEC VhliΔEC and NICDiOEC Vhl iΔEC double mutants relative to Cre- controls. Data represent mean±s.e.m. P values, one-way ANOVA with Tukey’s multiple comparison post-hoc test. The combination of enhanced Notch and HIF activity in NICDiOE-EC VhliΔEC double mutants, failed to induce a bigger expansion of type H ECs.
h, ELISA analysis of the cellular SCF levels in lysates of femur cells from Hif1a iΔEC NICDiOEC, Rbpj iΔEC Vhl iΔEC and NICDiOEC Vhl iΔEC double mutants relative to Cre- controls. Data represent mean±s.e.m. (n=4 or 5 mutants and 5 controls). P values, one-way ANOVA with Tukey’s multiple comparison post-hoc test.
i, HSC frequency (%) in Hif1a iΔEC NICDiOEC, Rbpj iΔEC Vhl iΔEC and NICDiOEC Vhl iΔEC double mutants relative to Cre- controls. Data represent mean±s.e.m. (n=4 or 5 mutants and 4 controls). P values, one-way ANOVA with Tukey’s multiple comparison post-hoc test. Unless otherwise mentioned data presented in figure panels is based on three independent experiments.
Extended Data Figure 10. Properties of vascular niches and HSCs in aged mice.
a, qPCR analysis of Pdgfrb and Cspg4 expression (normalised to Actb) in long bone of Fbxw7iΔEC mutants relative to littermate controls. Data represents mean±s.d (n=4 left panel; n=6 right panel). P values, two-tailed unpaired t-test.
b, Analysis of LTR-HSC contribution of BM cells from aged Fbxw7iΔEC and control donors, as determined by flow cytometry at 16 weeks after competitive transplantation together with young CD45.1 BM cells (from 12-14 week-old mice) into lethally irradiated recipients. Data represents mean±s.e.m. (n=6 donors).
c, Levels of donor derived multi-lineage contribution of aged Fbwx7iΔEC and age-matched control BM cells as determined 18 weeks post transplantation by flow cytometry analysis. HSC-CRU frequency and statistical significance was determined using ELDA software (n=3 mice per dilution).
d, Donor-derived lymphoid and myeloid contributions of aged Fbxw7iΔEC and control BM cells determined 18 weeks post-transplantation by flow cytometry analysis with B220 and CD11b antibodies. Data represents mean±s.d (n=24). P values, two-tailed unpaired t-test.
e, Representative images and quantification of γH2AX foci in Lineage-/cKit+/Sca-1+ HSPCs sorted from Fbwx7iΔEC mice and littermate controls (110 HSPCs were scored for each group). Note persistence of γH2AX foci in the aged Fbxw7iΔEC HSPCs. Unless otherwise mentioned data presented in figure panels is based on three independent experiments.
Supplementary Material
Supplementary Information is linked to the online version of the paper at www.nature.com/nature.
Acknowledgements
We thank M. Schiller for excellent technical assistance, A. Starsichova for help with bone sample processing, M. Stehling for FACS, S. Volkery for microscopy, M. Vanlandewijck and K. Nahar for help with PdgfbiOE-EC bones. Funding was provided by the Max Planck Society, the University of Münster, the DFG cluster of excellence ‘Cells in Motion’, and the European Research Council (AdG 339409 ‘AngioBone’). This research was partially supported by joint grant from the Ministry of Science, Technology & Space, Israel, DKFZ Germany, ERC AdG 294556 ‘BBBarrier’, Knut and Alice Wallenberg Foundation, and the Swedish Cancer Foundation.
Footnotes
Author Contributions. A.P.K., S.K.R. and R.H.A. designed experiments and interpreted results. A.P.K. and S.K.R. organised and conducted most experiments, including generation and characterization of mouse lines, imaging, flow cytometric analysis and transplantations. T.I. and T.L. designed and performed transplantation experiments. M.A.M. and C.B. generated and provided samples from PdgfbiOE-EC mice. A.P.K and U.H.L. analysed Efnb2 and NICD-Cre mice. A.P.K., S.K.R. and R.H.A. wrote the manuscript.
The authors do not declare competing financial interests.
References
- 1.Ding L, Saunders TL, Enikolopov G, Morrison SJ. Endothelial and perivascular cells maintain haematopoietic stem cells. Nature. 2012;481:457–462. doi: 10.1038/nature10783. [DOI] [PMC free article] [PubMed] [Google Scholar]
- 2.Hooper AT, et al. Engraftment and reconstitution of hematopoiesis is dependent on VEGFR2-mediated regeneration of sinusoidal endothelial cells. Cell Stem Cell. 2009;4:263–274. doi: 10.1016/j.stem.2009.01.006. [DOI] [PMC free article] [PubMed] [Google Scholar]
- 3.Kiel MJ, et al. SLAM family receptors distinguish hematopoietic stem and progenitor cells and reveal endothelial niches for stem cells. Cell. 2005;121:1109–1121. doi: 10.1016/j.cell.2005.05.026. [DOI] [PubMed] [Google Scholar]
- 4.Kusumbe AP, Ramasamy SK, Adams RH. Coupling of angiogenesis and osteogenesis by a specific vessel subtype in bone. Nature. 2014;507:323–328. doi: 10.1038/nature13145. [DOI] [PMC free article] [PubMed] [Google Scholar]
- 5.Acar M, et al. Deep imaging of bone marrow shows non-dividing stem cells are mainly perisinusoidal. Nature. 2015;526:126–130. doi: 10.1038/nature15250. [DOI] [PMC free article] [PubMed] [Google Scholar]
- 6.Ramasamy SK, Kusumbe AP, Wang L, Adams RH. Endothelial Notch activity promotes angiogenesis and osteogenesis in bone. Nature. 2014;507:376–380. doi: 10.1038/nature13146. [DOI] [PMC free article] [PubMed] [Google Scholar]
- 7.Kunisaki Y, et al. Arteriolar niches maintain haematopoietic stem cell quiescence. Nature. 2013;502:637–643. doi: 10.1038/nature12612. [DOI] [PMC free article] [PubMed] [Google Scholar]
- 8.Davy A, Bush JO, Soriano P. Inhibition of gap junction communication at ectopic Eph/ephrin boundaries underlies craniofrontonasal syndrome. PLoS Biol. 2006;4:e315. doi: 10.1371/journal.pbio.0040315. [DOI] [PMC free article] [PubMed] [Google Scholar]
- 9.Adams RH, et al. Roles of ephrinB ligands and EphB receptors in cardiovascular development: demarcation of arterial/venous domains, vascular morphogenesis, and sprouting angiogenesis. Genes Dev. 1999;13:295–306. doi: 10.1101/gad.13.3.295. [DOI] [PMC free article] [PubMed] [Google Scholar]
- 10.Corada M, et al. Sox17 is indispensable for acquisition and maintenance of arterial identity. Nat Commun. 2013;4:2609. doi: 10.1038/ncomms3609. [DOI] [PMC free article] [PubMed] [Google Scholar]
- 11.Adams RH, Alitalo K. Molecular regulation of angiogenesis and lymphangiogenesis. Nat Rev Mol Cell Biol. 2007;8:464–478. doi: 10.1038/nrm2183. [DOI] [PubMed] [Google Scholar]
- 12.Carmeliet P. Mechanisms of angiogenesis and arteriogenesis. Nat Med. 2000;6:389–395. doi: 10.1038/74651. [DOI] [PubMed] [Google Scholar]
- 13.Mendez-Ferrer S, et al. Mesenchymal and haematopoietic stem cells form a unique bone marrow niche. Nature. 2010;466:829–834. doi: 10.1038/nature09262. [DOI] [PMC free article] [PubMed] [Google Scholar]
- 14.Hellstrom M, Kalen M, Lindahl P, Abramsson A, Betsholtz C. Role of PDGF-B and PDGFR-beta in recruitment of vascular smooth muscle cells and pericytes during embryonic blood vessel formation in the mouse. Development. 1999;126:3047–3055. doi: 10.1242/dev.126.14.3047. [DOI] [PubMed] [Google Scholar]
- 15.Chambers SM, et al. Aging hematopoietic stem cells decline in function and exhibit epigenetic dysregulation. PLoS Biol. 2007;5:e201. doi: 10.1371/journal.pbio.0050201. [DOI] [PMC free article] [PubMed] [Google Scholar]
- 16.Morrison SJ, Wandycz AM, Akashi K, Globerson A, Weissman IL. The aging of hematopoietic stem cells. Nat Med. 1996;2:1011–1016. doi: 10.1038/nm0996-1011. [DOI] [PubMed] [Google Scholar]
- 17.Prisby RD, et al. Aging reduces skeletal blood flow, endothelium-dependent vasodilation, and NO bioavailability in rats. J Bone Miner Res. 2007;22:1280–1288. doi: 10.1359/jbmr.070415. [DOI] [PubMed] [Google Scholar]
- 18.Moerman EJ, Teng K, Lipschitz DA, Lecka-Czernik B. Aging activates adipogenic and suppresses osteogenic programs in mesenchymal marrow stroma/stem cells: the role of PPAR-gamma2 transcription factor and TGF-beta/BMP signaling pathways. Aging Cell. 2004;3:379–389. doi: 10.1111/j.1474-9728.2004.00127.x. [DOI] [PMC free article] [PubMed] [Google Scholar]
- 19.Zsebo KM, et al. Stem cell factor is encoded at the Sl locus of the mouse and is the ligand for the c-kit tyrosine kinase receptor. Cell. 1990;63:213–224. doi: 10.1016/0092-8674(90)90302-u. [DOI] [PubMed] [Google Scholar]
- 20.Vooijs M, et al. Mapping the consequence of Notch1 proteolysis in vivo with NIP-CRE. Development. 2007;134:535–544. doi: 10.1242/dev.02733. [DOI] [PMC free article] [PubMed] [Google Scholar]
- 21.Muzumdar MD, Tasic B, Miyamichi K, Li L, Luo L. A global double-fluorescent Cre reporter mouse. Genesis. 2007;45:593–605. doi: 10.1002/dvg.20335. [DOI] [PubMed] [Google Scholar]
- 22.Wu G, et al. SEL-10 is an inhibitor of notch signaling that targets notch for ubiquitin-mediated protein degradation. Mol Cell Biol. 2001;21:7403–7415. doi: 10.1128/MCB.21.21.7403-7415.2001. [DOI] [PMC free article] [PubMed] [Google Scholar]
- 23.Roca C, Adams RH. Regulation of vascular morphogenesis by Notch signaling. Genes Dev. 2007;21:2511–2524. doi: 10.1101/gad.1589207. [DOI] [PubMed] [Google Scholar]
- 24.Semenza GL. Targeting HIF-1 for cancer therapy. Nat Rev Cancer. 2003;3:721–732. doi: 10.1038/nrc1187. [DOI] [PubMed] [Google Scholar]
- 25.Red-Horse K, Ueno H, Weissman IL, Krasnow MA. Coronary arteries form by developmental reprogramming of venous cells. Nature. 2010;464:549–553. doi: 10.1038/nature08873. [DOI] [PMC free article] [PubMed] [Google Scholar]
- 26.Xu C, et al. Arteries are formed by vein-derived endothelial tip cells. Nat Commun. 2014;5:5758. doi: 10.1038/ncomms6758. [DOI] [PMC free article] [PubMed] [Google Scholar]
- 27.Kinashi T, Springer TA. Steel factor and c-kit regulate cell-matrix adhesion. Blood. 1994;83:1033–1038. [PubMed] [Google Scholar]
- 28.Miyazawa K, et al. Membrane-bound Steel factor induces more persistent tyrosine kinase activation and longer life span of c-kit gene-encoded protein than its soluble form. Blood. 1995;85:641–649. [PubMed] [Google Scholar]
- 29.Poulos MG, et al. Endothelial Jagged-1 is necessary for homeostatic and regenerative hematopoiesis. Cell Rep. 2013;4:1022–1034. doi: 10.1016/j.celrep.2013.07.048. [DOI] [PMC free article] [PubMed] [Google Scholar]
- 30.Dykstra B, Olthof S, Schreuder J, Ritsema M, de Haan G. Clonal analysis reveals multiple functional defects of aged murine hematopoietic stem cells. J Exp Med. 2011;208:2691–2703. doi: 10.1084/jem.20111490. [DOI] [PMC free article] [PubMed] [Google Scholar]
- 31.Han H, et al. Inducible gene knockout of transcription factor recombination signal binding protein-J reveals its essential role in T versus B lineage decision. Int Immunol. 2002;14:637–645. doi: 10.1093/intimm/dxf030. [DOI] [PubMed] [Google Scholar]
- 32.Wang Y, et al. Ephrin-B2 controls VEGF-induced angiogenesis and lymphangiogenesis. Nature. 2010;465:483–486. doi: 10.1038/nature09002. [DOI] [PubMed] [Google Scholar]
- 33.Hoeck JD, et al. Fbw7 controls neural stem cell differentiation and progenitor apoptosis via Notch and c-Jun. Nat Neurosci. 2010;13:1365–1372. doi: 10.1038/nn.2644. [DOI] [PubMed] [Google Scholar]
- 34.Koch U, et al. Delta-like 4 is the essential, nonredundant ligand for Notch1 during thymic T cell lineage commitment. J Exp Med. 2008;205:2515–2523. doi: 10.1084/jem.20080829. [DOI] [PMC free article] [PubMed] [Google Scholar]
- 35.Tang N, et al. Loss of HIF-1alpha in endothelial cells disrupts a hypoxia-driven VEGF autocrine loop necessary for tumorigenesis. Cancer Cell. 2004;6:485–495. doi: 10.1016/j.ccr.2004.09.026. [DOI] [PubMed] [Google Scholar]
- 36.Haase VH, Glickman JN, Socolovsky M, Jaenisch R. Vascular tumors in livers with targeted inactivation of the von Hippel-Lindau tumor suppressor. Proc Natl Acad Sci U S A. 2001;98:1583–1588. doi: 10.1073/pnas.98.4.1583. [DOI] [PMC free article] [PubMed] [Google Scholar]
- 37.Murtaugh LC, Stanger BZ, Kwan KM, Melton DA. Notch signaling controls multiple steps of pancreatic differentiation. Proc Natl Acad Sci U S A. 2003;100:14920–14925. doi: 10.1073/pnas.2436557100. [DOI] [PMC free article] [PubMed] [Google Scholar]
- 38.Armulik A, et al. Pericytes regulate the blood-brain barrier. Nature. 2010;468:557–561. doi: 10.1038/nature09522. [DOI] [PubMed] [Google Scholar]
- 39.Kisanuki YY, et al. Tie2-Cre transgenic mice: a new model for endothelial cell-lineage analysis in vivo. Dev Biol. 2001;230:230–242. doi: 10.1006/dbio.2000.0106. [DOI] [PubMed] [Google Scholar]
- 40.Vooijs M, et al. Mapping the consequence of Notch1 proteolysis in vivo with NIP-CRE. Development. 2007;134:535–544. doi: 10.1242/dev.02733. [DOI] [PMC free article] [PubMed] [Google Scholar]
- 41.Muzumdar MD, Tasic B, Miyamichi K, Li L, Luo L. A global double-fluorescent Cre reporter mouse. Genesis. 2007;45:593–605. doi: 10.1002/dvg.20335. [DOI] [PubMed] [Google Scholar]
- 42.Itkin T, et al. FGF-2 expands murine hematopoietic stem and progenitor cells via proliferation of stromal cells, c-Kit activation, and CXCL12 down-regulation. Blood. 2012;120(9):1843–55. doi: 10.1182/blood-2011-11-394692. [DOI] [PubMed] [Google Scholar]
- 43.Miller CL, Dykstra B, Eaves CJ. Characterization of mouse hematopoietic stem and progenitor cells. Curr Protoc Immunol. 2008;22:22B.2.1–22B.2.31. doi: 10.1002/0471142735.im22b02s80. [DOI] [PubMed] [Google Scholar]
- 44.Gomez RC. Age-dependent response of murine female bone marrow cells to hyperbaric oxygen. Biogerontology. 2012;13:287–297. doi: 10.1007/s10522-012-9373-8. [DOI] [PMC free article] [PubMed] [Google Scholar]
Associated Data
This section collects any data citations, data availability statements, or supplementary materials included in this article.


