

Abstract
The budding yeast Saccharomyces cerevisiae is a model system for investigating biological processes. Cellular processes are known to be dysregulated because of shifts in carbon sources. However, the comprehensive proteomic alterations thereof have not been fully investigated. Here we examined proteomic alterations in S. cerevisiae due to the adaptation of yeast from glucose to nine different carbon sources – maltose, trehalose, fructose, sucrose, glycerol, acetate, pyruvate, lactic acid, and oleate. Isobaric tag-based mass spectrometry techniques are at the forefront of global proteomic investigations. As such, we used a TMT10-plex strategy to study multiple growth conditions in a single experiment. The SPS-MS3 method on an Orbitrap Fusion Lumos mass spectrometer enabled the quantification of over 5000 yeast proteins across ten carbon sources at a 1% protein-level FDR. On average, the proteomes of yeast cultured in fructose and sucrose deviated the least from those cultured in glucose. As expected, gene ontology classification revealed the major alteration in protein abundances occurred in metabolic pathways and mitochondrial proteins. Our protocol lays the groundwork for further investigation of carbon source-induced protein alterations. Additionally, these data offer a hypothesis-generating resource for future studies aiming to investigate both characterized and uncharacterized genes.
Keywords: yeast, TMT, Orbitrap Fusion Lumos, carbon sources, metabolism, SPS-MS3
Graphical abstract
INTRODUCTION
The budding yeast, Saccharomyces cerevisiae, is an exceptional model system for investigating biological functions and pathways by proteomic strategies. Its compact genome and low number of intron containing genes allow systematic coverage with comparative ease [1]. However, S. cerevisiae’s value as a model is contingent on, and limited by, the number of uncharacterized ORFs (n=677, 11.6% (omitting dubious ORFs)), most of which exist as homologs in other species, including humans (n=388). As such, systematic characterization of these gene products and their co-expression profiles with known components is a valuable hypothesis-generating resource for the targeted characterization of gene function. However, uncharacterized ORFs are typically under-represented in systematic screens, many of which are assayed under standard metabolic conditions. Therefore, we aimed to measure protein abundance in highly diverse metabolic conditions to achieve an unprecedented depth of proteome coverage.
In industrial applications, S. cerevisiae has been used traditionally for brewing and baking, and more recently for the development of biofuels [2, 3]. A common mechanism of manipulating the metabolic processes governing S. cerevisiae is shifting carbon sources [4]. S. cerevisiae can survive on various carbon sources, both fermentable (e.g., glucose, maltose, fructose, sucrose, trehalose), and non-fermentable (e.g., pyruvate, acetate, lactate, oleate, glycerol) [5]. We expected that culturing yeast on a particular carbon source would result in pronounced proteomic changes associated with metabolic perturbation [6]. We investigate quantitatively the global proteomic alterations in wildtype S. cerevisiae following growth on minimal media supplemented with ten different carbon sources - glucose, maltose, oleate, fructose, sucrose, trehalose, lactate, acetate, pyruvate and glycerol - using a multiplexed tandem mass tag (TMT) strategy.
The carbon sources used for this experiment consisted of monosaccharides, disaccharides, fatty acids, or building blocks of fatty acids. Glucose (dextrose) is a six carbon monosaccharide preferred as an energy source by many organisms, including S. cerevisiae, and is a component of standard YPD (yeast extract-peptone-dextrose) yeast media. Maltose and trehalose are disaccharides composed of two glucose units, with the former having an α,α-1,1-glucoside bond and the latter an α(1→4) bond between the glucose molecules [7]. Like glucose, fructose is a simple ketonic monosaccharide produced by many plants, and is the most water-soluble of all the sugars investigated [8]. The association of the monosaccharides glucose and fructose via a glycosidic linkage forms the disaccharide sucrose. Sucrose is highly abundant and is often used for ethanol-based fuel production [9]. While the aforementioned carbon sources are fermentable, we also examined several non-fermentable carbon sources - specifically glycerol, acetate, pyruvate, lactate, and oleate [4, 10, 11]. The backbone of glycerol is essential to all triglycerides, which are esters of glycerol with long-chain carboxylic acids [12]. Likewise, acetate is a building block for fatty acids, as the linking of the two of its carbon atoms forms a growing fatty acid [13]. Pyruvate is an alpha-keto acid with both a ketone functional group and a carboxylic acid. Pyruvate can be derived from glucose through glycolysis, converted back to carbohydrates (such as glucose) via gluconeogenesis, or to fatty acids via the acetyl-CoA pathway [14]. Like pyruvate, lactate (lactic acid) is an organic compound which is often a downstream product of pyruvate and glucose metabolism [15]. In addition, oleate (oleic acid) is an unsaturated fatty acid that occurs naturally in various animal and vegetable fats and oils. The processing of oleate by β-oxidative catabolism occurring in peroxisomes results in the formation of acetyl-CoA which can enter the TCA cycle [16]. These carbon sources have all been used previously for culturing S. cerevisiae, yet hitherto the alterations in the associated global proteome with respect to growth in glucose have not been investigated.
Previous work, upon which this study builds, has shown promise in elucidating the comprehensive proteome of S. cerevisiae via mass spectrometry-based techniques [17–22]. We employed a TMT10-plex strategy to determine the relative protein abundance alterations resulting from a particular carbon source. The mass spectrometry measurements were performed on an Orbitrap Fusion Lumos mass spectrometer. This work represents the largest mass spectrometry-based analysis of the yeast S. cerevisiae to date. Our protocol can be used to direct future proteomic analyses, both global and targeted, to investigate the effects of altered carbon sources on the growth and metabolism of S. cerevisiae. Moreover, this dataset is a valuable resource, as it can be mined further to develop a better understanding of yeast metabolic pathways under different carbon sources and potentially manipulate these observed alterations for industrial applications.
MATERIALS AND METHODS
Materials
Tandem mass tag (TMT) isobaric reagents were from Thermo Fisher Scientific (Waltham, MA). Water and organic solvents were from J.T. Baker (Center Valley, PA). Unless otherwise noted, all other chemicals were from Sigma (St. Louis, MO).
Media and growth
The yeast strain was BY4742, derived from S288c. The yeast minimal media was comprised of yeast nitrogenous base with amino acids, ammonium sulfate, and the appropriate carbon source. A starter culture grown in glucose-containing minimal media overnight from individual colonies. The starter culture (with 2% glucose as the carbon source) was pelleted and the pellet washed with deionized water twice, and divided into ten different cultures - containing either 2% glucose, 2% maltose, 0.125% oleate, 2% fructose, 2% sucrose, 2% trehalose, 2% lactate, 2% acetate, 2% pyruvate and 2% glycerol as the carbon source- at OD600/mL of 0.05. Cultures were grown to reach an optical density (OD) of 0.6 and then harvested.
Cell lysis and protein digestion
Yeast cultures were harvested by centrifugation, washed twice with ice cold deionized water, and resuspended at 4°C in a buffer containing 50 mM EPPS pH 8.5, 8 M urea, and protease (complete mini, EDTA-free) inhibitors (Roche, Basel, Switzerland). Cells were lysed using the MiniBeadbeater (Biospec, Bartlesville, OK) in microcentrifuge tubes at maximum speed for three cycles of 60 s each, with 1 min pauses on ice between cycles to avoid overheating of the lysates. After centrifugation, cleared lysates were transferred to new tubes. We determined the protein concentration in the lysate using the bicinchoninic acid (BCA) protein assay (Thermo Fisher Scientific, Waltham, MA).
Proteins were subjected to disulfide reduction with 5 mM tris (2-carboxyethyl)phosphine (TCEP), (room temperature, 30 min) and alkylation with 10 mM iodoacetamide (room temperature, 30 min in the dark). Excess iodoacetamide was quenched with 10 mM dithiotreitol (room temperature, 15 min in the dark). Methanol-chloroform precipitation was performed prior to protease digestion. In brief, four parts neat methanol was added to each sample and vortexed, one-part chloroform was added to the sample and vortexed, and three parts water was added to the sample and vortexed. The sample was centrifuged at 20,000 RPM for 2 min at room temperature and after removing the aqueous and organic phases subsequently washed twice with 100% methanol, prior to air-drying.
Samples were resuspended in 8 M urea, 50 mM EPPS, pH 8.5. The protein extract was then diluted to 1 M urea with 50 mM EPPS pH 8.5 and digested at room temperature for 16 h with LysC protease at a 100:1 protein-to-protease ratio. Trypsin was then added at a 100:1 protein-to-protease ratio and the reaction was incubated 6 h at 37°C.
Tandem mass tag labeling
TMT reagents (0.8 mg) were dissolved in anhydrous acetonitrile (40 μL) of which 10 μL was added to the peptides (100 μg) along with 30 μL of acetonitrile to achieve a final acetonitrile concentration of approximately 30% (v/v). Following incubation at room temperature for 1 h, the reaction was quenched with hydroxylamine to a final concentration of 0.3% (v/v). The TMT-labeled samples were pooled at a 1:1:1:1:1:1:1:1:1:1 ratio. The sample was vacuum centrifuged to near dryness and subjected to C18 solid-phase extraction (SPE) (Sep-Pak, Waters).
Off-line basic pH reversed-phase (BPRP) fractionation
We fractionated the pooled TMT-labeled peptide sample using BPRP HPLC. We used an Agilent 1260 pump equipped with a degasser and a single wavelength detector (set at 220 nm). Peptides were subjected to a 50 min linear gradient from 8% to 40% acetonitrile in 10mM ammonium bicarbonate pH 8 at a flow rate of 0.6 mL/min over an Agilent 300Extend C18 column (3.5 μm particles, 4.6 mm ID and 250 mm in length). The peptide mixture was fractionated into a total of 96 fractions which were consolidated into 24 (Supplemental Figure 5). Samples were subsequently vacuum centrifuged to near dryness. Each fraction was acidified to 1% formic acid and desalted via StageTip, dried via vacuum centrifugation, and reconstituted in 5% acetonitrile, 5% formic acid for LC-MS/MS processing.
Liquid chromatography and tandem mass spectrometry
Our mass spectrometry data were collected using an Orbitrap Fusion Lumos mass spectrometer (Thermo Fisher Scientific, San Jose, CA) coupled to a Proxeon EASY-nLC 1000 liquid chromatography (LC) pump (Thermo Fisher Scientific). Peptides were separated on a 100 μm inner diameter microcapillary column packed with ~0.5 cm of Magic C4 resin (5 μm, 100 Å, Michrom Bioresources) followed by ~35 cm of GP-18 resin (1.8 μm, 200 Å, Sepax, Newark, DE). For each analysis, we loaded ~1 μg onto the column.
Peptides were separated in-line with the mass spectrometer using a 3-h gradient of 6 to 26% acetonitrile in 0.125% formic acid at a flow rate of ~350 nL/min. Each analysis used the MultiNotch MS3-based TMT method [23]. For analysis with the Orbitrap Fusion Lumos mass spectrometer, the scan sequence began with an MS1 spectrum (Orbitrap analysis; resolution 120,000; mass range 400–1400 m/z; automatic gain control (AGC) target 4 × 10⁵; maximum injection time 100 ms). Precursors for MS2/MS3 analysis were selected using a Top10 method. MS2 analysis consisted of collision-induced dissociation (CID); AGC 1.8 × 10⁴; normalized collision energy (NCE) 35; maximum injection time 120 ms; and isolation window of 0.4 Da. Following acquisition of each MS2 spectrum, we collected an MS3 spectrum using our recently described method in which multiple MS2 fragment ions were captured in the MS3 precursor population using isolation waveforms with multiple frequency notches [23]. MS3 precursors were fragmented by high energy collision-induced dissociation (HCD) and analyzed using the Orbitrap (NCE 55; AGC 1.2 × 10⁵; maximum injection time 150 ms, resolution was 60,000 at 400 Th).
A biological replicate was analyzed on a Orbitrap Fusion Classic mass spectrometer. The scan sequence began with an MS1 spectrum (Orbitrap analysis; resolution 120,000; mass range 400–1400 m/z; automatic gain control (AGC) target 5 × 10⁵; maximum injection time 100 ms). Precursors for MS2/MS3 analysis were selected using a Top10 method. MS2 analysis consisted of collision-induced dissociation (CID); AGC 8 × 10³; normalized collision energy (NCE) 35; maximum injection time 150 ms; and isolation window of 0.7 Da. Following acquisition of each MS2 spectrum, we collected an MS3 spectrum using our recently described method in which multiple MS2 fragment ions were captured in the MS3 precursor population using isolation waveforms with multiple frequency notches [23]. MS3 precursors were fragmented by high energy collision-induced dissociation (HCD) and analyzed using the Orbitrap (NCE 55; AGC 1.0 × 10⁵; maximum injection time 150 ms, resolution was 60,000 at 400 Th).
Data analysis
Mass spectra were processed using a SEQUEST-based in-house software pipeline [24]. Spectra were converted to mzXML using a modified version of ReAdW.exe. Database searching included all entries from the yeast SGD (Saccharomyces Genome Database) (March 20, 2015). This database was concatenated with one composed of all protein sequences in the reversed order. Searches were performed using a 50 ppm precursor ion tolerance for total protein level analysis. The product ion tolerance was set to 0.9 Da. These wide mass tolerance windows were chosen to maximize sensitivity in conjunction with Sequest searches and linear discriminant analysis [24, 25]. TMT tags on lysine residues and peptide N termini (+229.163 Da) and carbamidomethylation of cysteine residues (+57.021 Da) were set as static modifications, while oxidation of methionine residues (+15.995 Da) was set as a variable modification.
Peptide-spectrum matches (PSMs) were adjusted to a 1% false discovery rate (FDR) [26, 27]. PSM filtering was performed using a linear discriminant analysis, as described previously [24], while considering the following parameters: XCorr, ΔCn, missed cleavages, peptide length, charge state, and precursor mass accuracy. For TMT-based reporter ion quantitation, we extracted the signal-to-noise (S:N) ratio for each TMT channel and found the closest matching centroid to the expected mass of the TMT reporter ion. PSMs were identified, quantified, and collapsed to a 1% peptide false discovery rate (FDR) and then collapsed further to a final protein-level FDR of 1%. Moreover, protein assembly was guided by principles of parsimony to produce the smallest set of proteins necessary to account for all observed peptides.
Peptide intensities were quantified by summing reporter ion counts across all matching PSMs using in-house software, as described previously [23, 28]. Briefly, a 0.003 Th window around the theoretical m/z of each reporter ion was scanned for ions, and the maximum intensity nearest the theoretical m/z was used. PSMs with poor quality, MS3 spectra with TMT reporter summed signal-to-noise ratio that is less than 100, or no MS3 spectra were excluded from quantitation, and isolation specificity of ≥ 0.7 was required [28]. Protein quantitation values were exported for further analysis in Excel and/or JMP. We used Database for Annotation, Visualization and Integrated Discovery (DAVID) to perform gene ontology analysis to determine which biological processes and cellular components were represented by these subsets of proteins with significance testing based on a modified Fisher Exact p-value [29].
Linear modeling for determining significant protein fold changes
Protein fold changes were estimated by fitting separate models for each protein to the log base 2 peptide level intensities;
where yij represents the intensity for the ith peptide,i ∈ (1, …I) in the sample grown with sugar j, j ∈ (1, …, 10) Estimability constraints were applied to our model using reference cell coding, so that β0 represents the intensity of the first (in alphabetical order) peptide within the protein from the sample exposed only to glucose, (carbon_source1) from the first fraction observed for that protein. Thus, the parameters of interest are the β2j′s which represent the expected differences between cultures exposed to sugarj and those exposed only to glucose, with all other factors being equal. That is, only proteins to which two or more peptides were assigned were considered in the linear model for determining those proteins that have significant changes. The model cannot be fit for every protein as some proteins only contain a single peptide. For these proteins the model will not contain a term for peptides. For each model there are also two contrasts of scientific interest: 1) The difference between average levels of glucose-like sugars and average of all the others and 2) the difference between the averages of carbohydrates vs. non-carbohydrates. Specifically, we aim to determine the average effect of glucose, fructose and sucrose versus the effect of the remaining carbon sources for the first test and for the second test we want the carbohydrates (glucose, maltose, fructose, sucrose, and trehalose) versus the non-carbohydrates (oleate, lactate, acetate, pyruvate, and glycerol). In our model, with reference cell coding and nine estimated carbon source effects, this corresponds to the contrasts , for comparing glucose-like carbon sources to the rest, and , for contrasting carbohydrates and non-carbohydrates. Estimates of these parameters and p-values testing the hypothesis that the contrasts are zero were computed for each protein model. P-values were then adjusted for multiple hypothesis testing by controlling the False Discovery Rate [30]. These models were fit with the lm() function in R 3.2.3. Contrasts were estimated using the glht function from the multcomp package and p-value adjustments were computed with the p.adjust function. Although our primary threshold is based on an FDR-corrected p-value (p<0.01), we also applied a second threshold based on a log2 fold change. A value of greater than 2-fold or less than -2 fold was chosen so as to focus the data analysis on a set of proteins with the 10% largest alterations in abundance.
Data access
Supplemental Tables 1 and 2 list the proteins and peptides, respectively, as well as normalized TMT reporter ion intensities used for quantitative analysis. RAW files will be made available upon request.
RESULTS AND DISCUSSION
Application of a TMT-based quantitative mass spectrometry strategy enabled the quantification of over 5000 proteins from yeast cultured with 10 different carbon sources
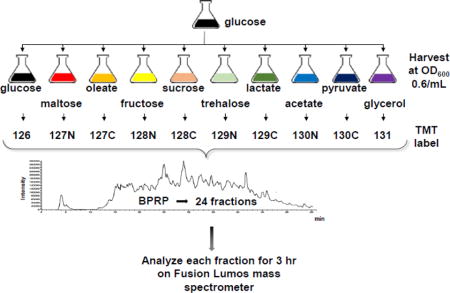
Based on our previously published protocol [31, 32], we analyzed the proteomes of S. cerevisiae grown in the presence of 10 carbon sources - glucose, maltose, oleate, fructose, sucrose, trehalose, lactate, acetate, pyruvate and glycerol. As outlined in Figure 1, a starter culture was grown overnight in glucose and cultures of each of the 10 carbon sources were inoculated to OD600 0.05/mL. Cells were disrupted by bead beating, reduced and alkylated, and proteins were extracted by chloroform-methanol precipitation. Proteins were digested with LysC and trypsin and the resulting peptides were labeled with TMT reagents. A total of 50 μg of peptide was pooled from each sample and fractionated via basic pH reversed-phase chromatography into a total of 24 fractions, as described previously [33]. Mass spectrometric data were collected over 72 hours, as each of the 24 fractions was separated on-line by reversed-phase fractionation for 3 hrs. We identified 165,938 total peptides, of which 85,269 were unique and which resulted in 5,138 identified proteins, as listed in Table 1. We note that of the proteins in SGD that we did not identify, 32% were classified as membrane proteins using the DAVID resource [29]. This outcome may indicate that our protein extraction method may not have been ideal for membrane protein extraction. If overcome, this limitation may increase further the comprehensiveness of future datasets. The majority of identified proteins, 5,003, were quantified across all 10 growth conditions. To date, this was the largest isobaric-tag based shotgun proteomics dataset of S. cerevisiae.
Figure 1. Workflow for TMT10-plex analysis of S. cerevisiae grown with ten different carbon sources.
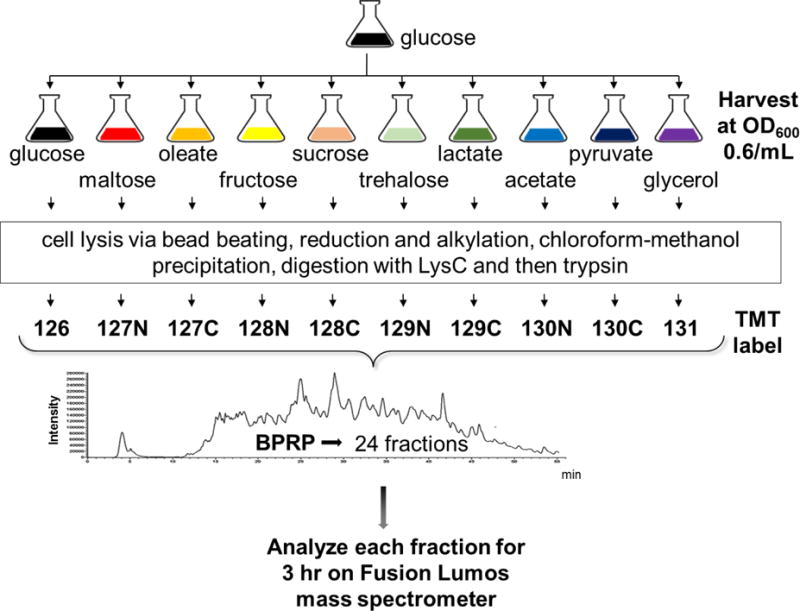
A starter culture was grown overnight in glucose and cultures were inoculated to OD600 0.05/mL and harvested at OD600 0.6/mL. Cells were disrupted by bead beating, proteins were reduced and alkylated, and subsequently extracted by chloroform-methanol precipitation. Peptides resulting from digestion with LysC and trypsin were labeled with TMT reagents. A total of 50 μg of peptide was pooled from each sample and fractionated via basic pH reversed-phase chromatography into a total of 24 fractions. Mass spectrometry data were collected for 3 h on an Orbitrap Fusion Lumos mass spectrometer.
Table 1.
Summary of mass spectrometry data
| Identified proteins | Unique proteins | Total peptides | Quantified peptidesa |
|---|---|---|---|
| 5,138 | 85,269 | 165,938 | 5,003 |
Proteins quantified across all ten TMT channels, FDR <1%.
Examining further our data, we divided yeast proteins into three categories, verified open reading frames (ORFs), uncharacterized ORFs, and dubious ORFs, as classified by Saccharomyces Genome Database (SGD) [1]. We quantified over 90% of the verified ORFs (4669 quantified, 477 not quantified) (Figure 2A). Likewise, we quantified approximately 47% of uncharacterized ORFS (320 quantified, 364 not quantified) (Figure 2B). In addition, we quantified 1.3% of the dubious ORFs in the database (10 quantified, 774 not quantified), which is in agreement with the 1% protein false discovery rate of our dataset (Figure 2C). Examining the verified ORFs, we can isolate protein classes that are highly represented in our dataset. For example, we quantified 85% of all yeast transcription factors (Figure 2D), and 88% of all kinases (Figure 2E) and phosphatases (Figure 2F). As such, the comprehensiveness of this dataset allows for the investigation of the relative abundances of many members of a particular class of proteins.
Figure 2. General characterization of quantified proteins.

We show the proportion of the proteins quantified (green) and not quantified (light grey) for A) verified ORFs, B) uncharacterized ORFs, and C) dubious ORFs. In addition, for verified ORFs, we illustrate the proportion of D) transcription factors, E) kinases, and F) phosphatases that were quantified (light green) and those that were not quantified (grey).
Hierarchical clustering and correlation plots revealed both expected and unexpected grouping of the 10 samples
We subjected the quantified proteins to two-dimensional clustering using the Euclidean distance metric (Figure 3A). The data were scaled, such that the sum of all the TMT abundance values across the 10 samples was 100. The dendrogram to the left of the heat map shows the clustering pattern for the samples cultured in the given carbon source. Two main clusters of samples emerged, one with glucose, fructose, and sucrose as the carbon source, and a second with maltose, trehalose and the five non-carbohydrate carbon sources. We expected glucose, fructose, and sucrose to cluster closer together as glucose and fructose are structural isomers, while sucrose is a disaccharide formed by a bond between the two monosaccharides. In essence, the switch to fructose and sucrose from glucose was less metabolically stressful and in turn resulted in fewer protein abundance alterations. In the second of the two major branches of the dendrogram, the two sugars, maltose and trehalose, cluster close together while acetate shows more diverse protein expression than the other four non-carbohydrate carbon sources. A broader range of protein alterations were expected, particularly in the non-carbohydrate sources, due to the metabolic stress as the cells adapt from glucose to the different carbon sources [4, 34]. The square root of the average squared deviation from glucose is listed to the right of each carbon source (in parenthesis) (Figure 3A). Agreeing with the dendrogram, fructose and sucrose deviate the least from glucose.
Figure 3. Clustering and correlation of the 10 samples in the TMT10-plex dataset.
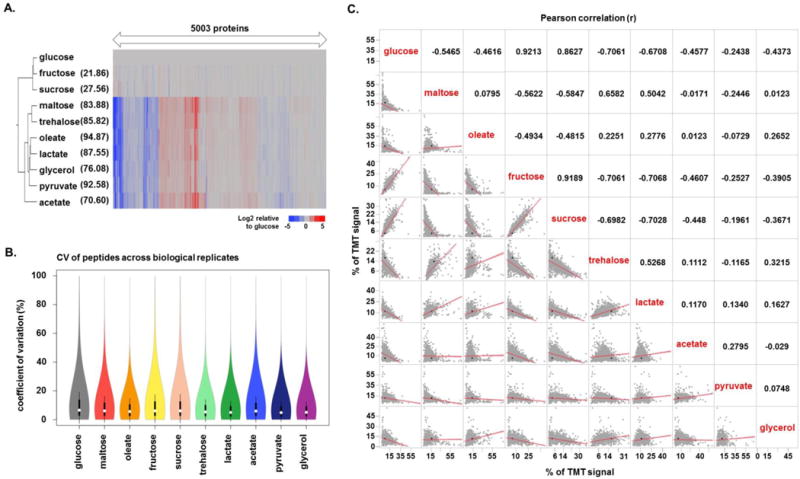
A) Hierarchical clustering of the proteins quantified in each carbon source. The data were displayed with respect to glucose. The value in parenthesis to the right of the carbon source is square root of the average squared deviation from glucose. B) Violin plots illustrating the coefficients of variation (CV) values for identical peptides across biological replicates for each carbon source. White circles show the medians; box limits indicate the 25th and 75th percentiles and whiskers extend 1.5 times the interquartile range from the 25th and 75th percentiles. C) Correlation matrix comparing the proteins quantified in the 10 carbon sources against each other. The lower triangle shows the correlation plot for each pair of carbon sources, while the upper panel shows the corresponding Pearson correlation (r).
We performed a biological replicate - using a different starter culture - of this experiment on a Fusion Lumos mass spectrometer and examined the overall correlation of our replicate measurements. Comparing the TMT relative abundance values of each protein across the two biological replicates for each carbon source resulted in strong correlation coefficients between 0.88 and 0.92 (Supplemental Figure 1). As this correlation coefficient has been calculated over several orders of magnitude, we also determined the coefficient of variation (CV) for identical peptides across biological replicates. We illustrate the distribution of CVs as violin plots for each of the 10 carbon source (Figure 3B). The median CV values range between 5–10% for each carbon source, thereby supporting the reproducibility of these data.
In addition, we constructed a correlation matrix of each carbon source against each other to examine quantitatively the correlation among the carbon sources (Figure 3C). The lower left of the diagonal displayed the scatter plot for all points representing the percent of total TMT signal attributed to proteins in the given channel (along with the best fit line), while the upper right of the diagonal displays the Pearson correlation for the same comparison. Agreeing with the dendrogram, the highest correlation (r = 0.9213) was observed between proteins from yeast cultured in glucose and fructose, with those between fructose and sucrose (r = 0.9189) and glucose and sucrose (r = 0.8627), second and third highest, respectively. The least correlated pairs of carbon sources, specifically oleate and acetate along with maltose and glycerol (both with r = 0.0123), would indicate that very diverse pathways and associated proteins were altered as the cultures adjusted to the new carbon source. As expected, we observed carbon source-dependent alterations in different subsets of proteins in our TMT10-plex dataset.
Proteins with significant differential expression between yeast cultured with carbohydrate and non-carbohydrate carbon sources were characterized as mitochondrial or as having metabolic functions
We aimed to determine the proteomic differences in yeast when shifted from growth on glucose to growth on 5 carbohydrate and 5 non-carbohydrate carbon sources. As such, we used our model to estimate the difference between the average abundance in carbohydrate and non-carbohydrate groups. We then tested the hypothesis that no difference exists between the groups. We displayed the data as a volcano plot for visualization (Supplemental Figure 2). Using significance cutoffs of an FDR adjusted p-value <0.01 and a fold change difference of greater than 2, we observed 281 proteins that were down-regulated in yeast with carbohydrates as carbon source, while 118 proteins that were up-regulated (represented by open blue circles). For visual comparisons, we highlighted several proteins of unknown function which were significantly up- or down-regulated when comparing the two groups (represented by closed black circles) (Supplemental Figure 2).
Using the significantly changing proteins, we determined enrichment in biological process or cellular component via gene ontology (GO) analysis. Examining the GO classifications of proteins down-regulated in yeast with carbohydrates as carbon source revealed enrichment of mitochondria-related proteins. As few proteins were significantly up-regulated in this comparison, strong enrichment could not be established. Nonetheless, some of these proteins were of nuclear and plasma membrane origin and had roles in metabolite transport. As expected, our overall comparative analyses revealed that proteins involved in metabolic processes were altered as a result of cultures being growth in media made non-carbohydrate carbon sources.
Proteins characterized as ribosomal, nuclear, or mitochondrial show significant differential expression between yeast cells cultured with glucose, sucrose, and fructose, and those cultured with the other 7 carbon sources
Although we expected the greatest differences between the carbohydrate and the non-carbohydrate carbon sources, from the dendrogram (Figure 2A) we observed a primary split between glucose, fructose and sucrose and the remaining seven carbon sources (maltose, trehalose, pyruvate, acetate, lactate, oleate, glycerol). As such, we aimed to determine which proteins demonstrated statistical significance between the two subsets of carbon sources. As done previously for the 5 carbohydrate and 5 non-carbohydrate comparison, we use our linear model to estimate the difference between these two carbon source subsets. We visualized the data as a volcano plot (Figure 4A) and deemed proteins to be significantly different when they had an FDR adjusted p-value<0.01 and a fold change difference of greater than |2|. We observed 544 proteins that were down-regulated in yeast with the 7 alternative carbon sources, while 661 proteins that were up-regulated. Likewise, we note 129 proteins that are of unknown function, but demonstrated statistically significant differences in abundance between the two groups. In Figure 4A, we highlighted ten proteins of unknown functions which have suspected roles in metabolism.
Figure 4. Comparison of proteins from samples grown with glucose, sucrose, or fructose versus all other carbon sources.
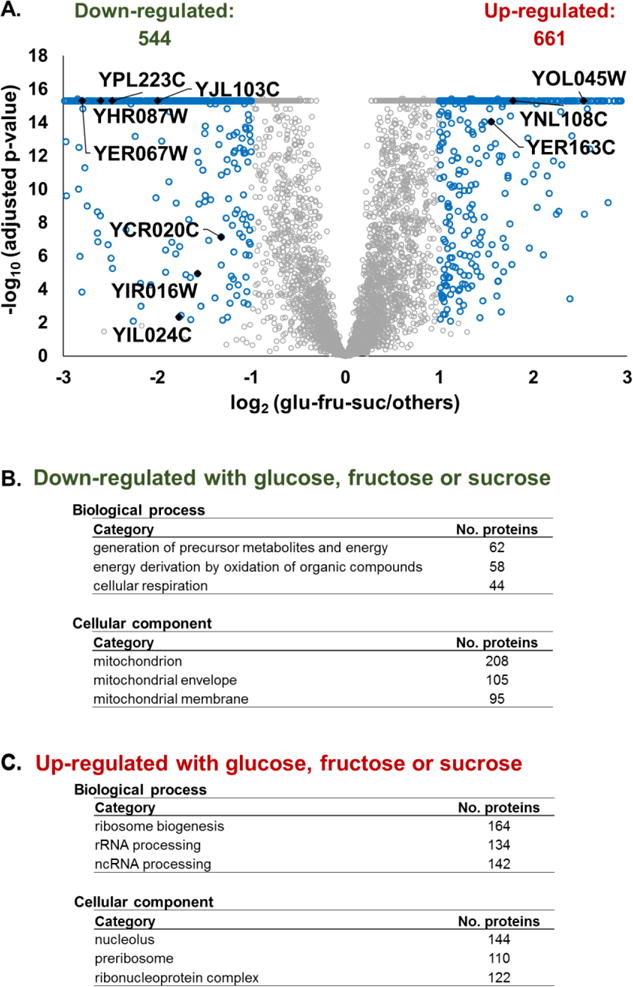
A) Volcano plot displaying the p-value and the log2 fold-change of the TMT signal-to-noise values of proteins from yeast grown in glucose, sucrose and fructose to that of the other carbon sources. Highlighted are proteins of unknown function with potential roles in metabolism. P-values were capped at 1E-16. Gene ontology terms for proteins that are B) down -regulated or C) up-regulated in yeast with glucose, sucrose or fructose as the carbon sources.
We subjected all significantly changing proteins to GO analysis to determine which, if any, enrichment in biological process or cellular component. We listed the three categories with the lowest p-values and the corresponding number of proteins classified in these categories. GO classifications of proteins down-regulated (n=544) in yeast with glucose, fructose, and sucrose, as carbon sources revealed that mitochondria-related biological processes and proteins with mitochondrial origins were significantly enriched (Figure 4B). For proteins that were significantly up-regulated (n=661) in this comparison, those involved in the biological processes of ribosome biogenesis and RNA processing and of ribosomal or nuclear-related origin were significantly enriched (Figure 4C). Overall, the protein changes may have been exemplary of the general environmental stress response as commonly observed in yeast, with ribosomal proteins being repressed and metabolic proteins being induced [35]. The data revealed that unlike yeast grown in glucose, fructose and sucrose, the remaining seven cultures required a significant alteration in proteins and associated pathways when the carbon sources were changed from glucose.
Linear modeling analysis allowed for the selection of proteins with relative abundance values that differ significantly from the mean
Although the comparative statistical analyses and volcano plots above illustrate protein abundance differences between classes of carbon sources, the individual effects of each carbon source on specific proteins can also be examined. For example, we can determine proteins which are significantly different in particular samples with respect to their relative abundance. For each alternate source of carbon, we used a linear model to test the hypotheses that no differential expression exists between protein abundance found in yeast exposed only to glucose and the abundance from yeast exposed to each of the other sources of carbon. We then assembled a list of these significant proteins for each carbon source, and performed KEGG pathway analysis to gather evidence as to which pathways are most represented [36]. Supplemental Table 3, includes a tally of the total number of significant proteins in the dataset and the KEGG pathways having at least one significantly altered protein. As expected, the pathway with the most differentially-expressed proteins was the “metabolic pathway” having a total of 780 across the 10 carbon sources, while associated categories “biosynthesis of secondary metabolites” had 380 and “microbial metabolism in diverse environments” had 299. Such a result was expected as metabolic changes were a direct consequence of growth in a particular carbon source.
Examples of up-regulated proteins in for each carbon source
Of the over 5,000 proteins quantified, we highlighted those proteins with the highest abundance - defined as the relative TMT signal across the 10 channels - in each of the 10 carbon sources investigated (Supplementary Figure 3). For glucose, two hexose transporters showed the greatest alterations in relative abundance (Supplementary Figure 3A). HXT3 [37] and HXT1 [38] are low affinity glucose transporters expressed in both high and low glucose conditions. Two hydrophilins were highly abundant for the maltose growth condition (Supplementary Figure 3B). GRE1 [39] and SIP18 [40] are paralogs, and their expression is induced by environmental stress. The two proteins with the highest fold change in oleate with respect to glucose included one of peroxisomal origin and another involved in metabolism (Supplementary Figure 3C). The oleate-inducible LPX1 is a peroxisomal matrix-localized lipase [41]. In addition, OYE3 is a conserved NADPH oxidoreductase and is involved in metabolism and oxidative stress response [42]. For the fructose growth condition, ARI1 - an NADPH-dependent aldehyde reductase - is involved in regulation of fermentation [43]. Similar to glucose, the relative concentration of hexose transporter HXT3 [37] was also considered greatly altered in relative abundance in the fructose culture (Supplementary Figure 3D). Like glucose, sucrose also showed relatively high abundance of glucose transporters. However, HXT4 [44]and HXT2 [45] are high-affinity glucose transporters that are induced by low levels of glucose (Supplementary Figure 3E). The trehalose growth condition revealed stress response proteins among those with highest relative abundance (Supplementary Figure 3F). SPG1 is a stress response protein that has been detected in the mitochondria [46]. Similarly, STF2 is also a mitochondrial stress response protein with anti-oxidant properties [47]. Growth in lactate resulted in the up-regulation of two proteins that are co-regulated in response to nutrient limitation [48]. (Supplementary Figure 3G). SNZ1 is a protein involved in pyridoxine biosynthetic process [49]. SNZ1 forms a complex with a second protein, SNO1, which is of unknown function with a putative role in pyridoxine metabolism [48]. In addition, yeast growing in acetate (Supplementary Figure 3H) showed PHO89, which is involved in phosphate metabolism [50] to be highly expressed. Likewise, involved in metabolism, particularly during diauxic shift, ENB1 - an ion transporter [51] - was up-regulated when acetate was the carbon source. Similar to acetate, yeast growing in pyruvate (Supplementary Figure 3I) also showed an ion transporter as being highly abundant. SIT1 is a ferrioxamine B transporter and is expressed in response to iron depravation [52]. Interestingly, ZPS1, a protein with an unknown function whose transcription is induced under low-zinc conditions was up-regulated in yeast grown in acetate [53]. As may be expected, the two proteins with the highest fold changes for the yeast cultured in glycerol were involved in its transport and metabolism (Supplementary Figure 3J). STL1 is a glycerol proton symporter [54] and GUT1 is a glycerol kinase that converts glycerol to glycerol-3-phosphate for use in glycolysis of gluconeogenesis [55]. In all, these highly abundant, carbon source–specific proteins may provide insight into the mechanisms and pathways that collectively alleviate the cellular stress imposed by the shift in carbon source.
The elucidation of a complete proteome allows not only for the study of individual proteins, but more significantly, for investigation of various classes and pathways in which these proteins function. We have compiled a comprehensive dataset which potentially enables the relative quantification of entire pathways. Of all the carbon sources examined in this investigation, oleate is unique as it is processed in peroxisomes by β-oxidative catabolism to form acetyl-CoA before entering the TCA cycle [16]. As we and others have shown, this 18-carbon fatty acid is capable of sustaining S. cerevisiae in the absence of glucose as a carbon source [16]. Unlike previous studies, our multiplexed analysis allowed us to demonstrate that ten peroxisome-localized proteins involved in the β-oxidative catabolism of oleate were upregulated in yeast cultured with oleate, compared to those cultured with other carbon sources. These ten proteins – CTA1, ECI1, FAA2, FOX1, PEX11, PIP2, POT1, POX1, PXA1 and PXA2 – are highlighted in Figure 5. The comprehensiveness of this dataset allowed for the analysis of the carbon source-dependent effects on this and other biochemical pathways over multiple conditions in a single experiment.
CONCLUSIONS
We used a multiplexed isobaric tag-based quantitative mass spectrometry strategy to investigate comprehensively the proteomic alterations in S. cerevisiae resulting from growth on ten different carbon sources. Our analysis demonstrated the proteomic alterations resulting from the distinctive ability of S. cerevisiae to adapt to metabolic stress stemming from growth on suboptimal carbon sources. Employing isobaric labeling [56, 57] permitted the quantification of protein samples from virtually any source, with a main limitation being the number of available labels. The maturation of mass spectrometry-based proteomic analysis currently allows for the quantification of thousands of individual proteins, to a level approaching the entire yeast proteome. In total, we quantified 5003 proteins across all 10 growth conditions. These proteins were inferred from a total of 85,269 unique peptides. As expected, gene ontology analysis revealed that the majority of altered proteins (comparing both carbohydrate versus non-carbohydrate, as well as glucose, sucrose, and fructose versus the remaining carbon sources) function in metabolic processes and that these proteins were of mitochondrial origin. In total, we have quantified the largest number to date of yeast proteins and peptides in a single analysis via a TMT-based mass spectrometry strategy.
Multiplexing strategies applied to mass spectrometry-based quantitative proteomics have expanded the efficiency, depth, and throughput of comprehensive protein analyses. As such, the experiment outlined herein and the underlying methodologies are useful for the design of future studies. Here we examined the proteomic alterations in what may be considered the early adaptation phase to environmental stress as cultures were propagated from a cell density of 0.05 OD600/mL to 0.6 OD600/mL. However, the TMT10-plex strategy also enables the quantification of proteins across specified time points to examine the temporal changes in the proteome. Moreover, future studies can leverage this strategy to develop a series of time course-based TMT10-plex experiments. A further extension of the work would be the analysis of signaling pathways, specifically phosphorylation and/or ubiquitylation, which would necessitate enrichment from substantially larger (milligram-scale) peptide amounts [33]. This methodology can also be used to investigate other yeast species, such as S. pombe, to discover differences in proteomic alterations resulting from growth on specific carbon sources. Of particular interest may be a prototrophic strain in which no amino acids are supplemented and must be produced by the cell’s own biosynthetic pathways.
As we demonstrate herein, the use of isobaric tag-based multiplexed proteomic techniques can facilitate the high throughput elucidation of comprehensive proteomes. While data collection for each individual sample could require weeks to complete, our TMT10-plex strategy required approximately 72 hours of analysis. Numerous experiments can be designed based on the general methodology which we described. With this workflow, studies may be developed to investigate the influence of carbon sources on yeast proteomes using yeast deletion and overexpression strains and with other carbon sources or forms of cellular stress. Likewise, multiplexing can be expanded by incorporating the previously-published 3×3+1 strategy to link multiple experiments [17, 58] or hyperplexing for higher-order multiplexing [59]. Furthermore, our dataset contains over 85,000 unique S. cerevisiae peptides, which will be useful for future targeted mass spectrometry-based experiments [60]. In summary, we present one of the largest expression atlases for yeast proteins and associated peptides from a single quantitative mass spectrometry-based experiment. In doing so, we provide the community with a hypothesis-generating resource for studies of characterized and uncharacterized genes, while also offering insights into targets for potential genetic engineering to optimize industrial applications.
Supplementary Material
Highlights.
-
-
Over 5000 yeast proteins are quantified across 10 carbon sources in a single experiment.
-
-
Five carbohydrate carbon sources: maltose, trehalose, fructose, sucrose, glucose.
-
-
Five non-carbohydrate carbon sources: glycerol, acetate, pyruvate, lactic acid, oleate.
-
-
MS3-SPS quantitative proteomics performed on an Orbitrap Fusion Lumos mass spectrometer.
-
-
Major alterations occurred in metabolic pathways and mitochondrial proteins.
Acknowledgments
We would like to thank members of the Gygi Lab at Harvard Medical School, particularly Dr. Ekaterina Stepanova for her insights into yeast growth and metabolism. This work was funded in part by an NIH/NIDDK grant K01 DK098285 (J.A.P.) and GM67945 (S.P.G).
Abbreviations
- TMT
tandem mass tag
Footnotes
Publisher's Disclaimer: This is a PDF file of an unedited manuscript that has been accepted for publication. As a service to our customers we are providing this early version of the manuscript. The manuscript will undergo copyediting, typesetting, and review of the resulting proof before it is published in its final citable form. Please note that during the production process errors may be discovered which could affect the content, and all legal disclaimers that apply to the journal pertain.
CONFLICTS OF INTEREST
The authors acknowledge no conflict of interest.
References
- 1.Cherry JM, Hong EL, Amundsen C, Balakrishnan R, Binkley G, Chan ET, et al. Saccharomyces Genome Database: the genomics resource of budding yeast. Nucleic Acids Res. 2012;40:D700–5. doi: 10.1093/nar/gkr1029. [DOI] [PMC free article] [PubMed] [Google Scholar]
- 2.Tang X, Feng H, Zhang J, Chen WN. Comparative proteomics analysis of engineered Saccharomyces cerevisiae with enhanced biofuel precursor production. PloS one. 2013;8:e84661. doi: 10.1371/journal.pone.0084661. [DOI] [PMC free article] [PubMed] [Google Scholar]
- 3.Raghavulu SV, Goud RK, Sarma PN, Mohan SV. Saccharomyces cerevisiae as anodic biocatalyst for power generation in biofuel cell: influence of redox condition and substrate load. Bioresour Technol. 2011;102:2751–7. doi: 10.1016/j.biortech.2010.11.048. [DOI] [PubMed] [Google Scholar]
- 4.Granot D, Snyder M. Carbon source induces growth of stationary phase yeast cells, independent of carbon source metabolism. Yeast. 1993;9:465–79. doi: 10.1002/yea.320090503. [DOI] [PubMed] [Google Scholar]
- 5.Fendt SM, Sauer U. Transcriptional regulation of respiration in yeast metabolizing differently repressive carbon substrates. BMC systems biology. 2010;4:12. doi: 10.1186/1752-0509-4-12. [DOI] [PMC free article] [PubMed] [Google Scholar]
- 6.Gao J, Opiteck GJ, Friedrichs MS, Dongre AR, Hefta SA. Changes in the protein expression of yeast as a function of carbon source. J Proteome Res. 2003;2:643–9. doi: 10.1021/pr034038x. [DOI] [PubMed] [Google Scholar]
- 7.Eleutherio E, Panek A, De Mesquita JF, Trevisol E, Magalhaes R. Revisiting yeast trehalose metabolism. Curr Genet. 2015;61:263–74. doi: 10.1007/s00294-014-0450-1. [DOI] [PubMed] [Google Scholar]
- 8.Semchyshyn HM, Lozinska LM, Miedzobrodzki J, Lushchak VI. Fructose and glucose differentially affect aging and carbonyl/oxidative stress parameters in Saccharomyces cerevisiae cells. Carbohydr Res. 2011;346:933–8. doi: 10.1016/j.carres.2011.03.005. [DOI] [PubMed] [Google Scholar]
- 9.Marques WL, Raghavendran V, Stambuk BU, Gombert AK. Sucrose and Saccharomyces cerevisiae: a relationship most sweet. FEMS Yeast Res. 2016;16 doi: 10.1093/femsyr/fov107. [DOI] [PubMed] [Google Scholar]
- 10.Schuller HJ. Transcriptional control of nonfermentative metabolism in the yeast Saccharomyces cerevisiae. Curr Genet. 2003;43:139–60. doi: 10.1007/s00294-003-0381-8. [DOI] [PubMed] [Google Scholar]
- 11.Weinhandl K, Winkler M, Glieder A, Camattari A. Carbon source dependent promoters in yeasts. Microb Cell Fact. 2014;13:5. doi: 10.1186/1475-2859-13-5. [DOI] [PMC free article] [PubMed] [Google Scholar]
- 12.Wong DW, Batt SB, Lee CC, Robertson GH. Increased expression and secretion of recombinant alpha-amylase in Saccharomyces cerevisiae by using glycerol as the carbon source. J Protein Chem. 2002;21:419–25. doi: 10.1023/a:1021186601208. [DOI] [PubMed] [Google Scholar]
- 13.Orlandi I, Ronzulli R, Casatta N, Vai M. Ethanol and acetate acting as carbon/energy sources negatively affect yeast chronological aging. Oxidative medicine and cellular longevity. 2013;2013:802870. doi: 10.1155/2013/802870. [DOI] [PMC free article] [PubMed] [Google Scholar]
- 14.Pronk JT, Yde Steensma H, Van Dijken JP. Pyruvate metabolism in Saccharomyces cerevisiae. Yeast. 1996;12:1607–33. doi: 10.1002/(sici)1097-0061(199612)12:16<1607::aid-yea70>3.0.co;2-4. [DOI] [PubMed] [Google Scholar]
- 15.Narendranath NV, Thomas KC, Ingledew WM. Effects of acetic acid and lactic acid on the growth of Saccharomyces cerevisiae in a minimal medium. J Ind Microbiol Biotechnol. 2001;26:171–7. doi: 10.1038/sj.jim.7000090. [DOI] [PubMed] [Google Scholar]
- 16.Lockshon D, Surface LE, Kerr EO, Kaeberlein M, Kennedy BK. The sensitivity of yeast mutants to oleic acid implicates the peroxisome and other processes in membrane function. Genetics. 2007;175:77–91. doi: 10.1534/genetics.106.064428. [DOI] [PMC free article] [PubMed] [Google Scholar]
- 17.Paulo JA, Gygi SP. A comprehensive proteomic and phosphoproteomic analysis of yeast deletion mutants of 14-3-3 orthologs and associated effects of rapamycin. Proteomics. 2014 doi: 10.1002/pmic.201400155. [DOI] [PMC free article] [PubMed] [Google Scholar]
- 18.Hebert AS, Richards AL, Bailey DJ, Ulbrich A, Coughlin EE, Westphall MS, et al. The one hour yeast proteome. Molecular & cellular proteomics: MCP. 2014;13:339–47. doi: 10.1074/mcp.M113.034769. [DOI] [PMC free article] [PubMed] [Google Scholar]
- 19.Webb KJ, Xu T, Park SK, Yates JR., 3rd Modified MuDPIT separation identified 4488 proteins in a system-wide analysis of quiescence in yeast. Journal of proteome research. 2013;12:2177–84. doi: 10.1021/pr400027m. [DOI] [PMC free article] [PubMed] [Google Scholar]
- 20.Picotti P, Clement-Ziza M, Lam H, Campbell DS, Schmidt A, Deutsch EW, et al. A complete mass-spectrometric map of the yeast proteome applied to quantitative trait analysis. Nature. 2013;494:266–70. doi: 10.1038/nature11835. [DOI] [PMC free article] [PubMed] [Google Scholar]
- 21.King NL, Deutsch EW, Ranish JA, Nesvizhskii AI, Eddes JS, Mallick P, et al. Analysis of the Saccharomyces cerevisiae proteome with PeptideAtlas. Genome biology. 2006;7:R106. doi: 10.1186/gb-2006-7-11-r106. [DOI] [PMC free article] [PubMed] [Google Scholar]
- 22.Nagaraj N, Kulak NA, Cox J, Neuhauser N, Mayr K, Hoerning O, et al. System-wide perturbation analysis with nearly complete coverage of the yeast proteome by single-shot ultra HPLC runs on a bench top Orbitrap. Molecular & cellular proteomics: MCP. 2012;11 doi: 10.1074/mcp.M111.013722. M111 013722. [DOI] [PMC free article] [PubMed] [Google Scholar]
- 23.McAlister GC, Nusinow DP, Jedrychowski MP, Wuhr M, Huttlin EL, Erickson BK, et al. MultiNotch MS3 enables accurate, sensitive, and multiplexed detection of differential expression across cancer cell line proteomes. Analytical chemistry. 2014;86:7150–8. doi: 10.1021/ac502040v. [DOI] [PMC free article] [PubMed] [Google Scholar]
- 24.Huttlin EL, Jedrychowski MP, Elias JE, Goswami T, Rad R, Beausoleil SA, et al. A tissue-specific atlas of mouse protein phosphorylation and expression. Cell. 2010;143:1174–89. doi: 10.1016/j.cell.2010.12.001. [DOI] [PMC free article] [PubMed] [Google Scholar]
- 25.Beausoleil SA, Villen J, Gerber SA, Rush J, Gygi SP. A probability-based approach for high-throughput protein phosphorylation analysis and site localization. Nature biotechnology. 2006;24:1285–92. doi: 10.1038/nbt1240. [DOI] [PubMed] [Google Scholar]
- 26.Elias JE, Gygi SP. Target-decoy search strategy for mass spectrometry-based proteomics. Methods Mol Biol. 2010;604:55–71. doi: 10.1007/978-1-60761-444-9_5. [DOI] [PMC free article] [PubMed] [Google Scholar]
- 27.Elias JE, Gygi SP. Target-decoy search strategy for increased confidence in large-scale protein identifications by mass spectrometry. Nat Methods. 2007;4:207–14. doi: 10.1038/nmeth1019. [DOI] [PubMed] [Google Scholar]
- 28.McAlister GC, Huttlin EL, Haas W, Ting L, Jedrychowski MP, Rogers JC, et al. Increasing the multiplexing capacity of TMTs using reporter ion isotopologues with isobaric masses. Analytical chemistry. 2012;84:7469–78. doi: 10.1021/ac301572t. [DOI] [PMC free article] [PubMed] [Google Scholar]
- 29.Huang da W, Sherman BT, Lempicki RA. Systematic and integrative analysis of large gene lists using DAVID bioinformatics resources. Nat Protoc. 2009;4:44–57. doi: 10.1038/nprot.2008.211. [DOI] [PubMed] [Google Scholar]
- 30.Benjamini Y, Hochberg Y. Controlling the false discovery rate - a practical and powerful approach to multiple testing. J R Stat Soc Ser B-Methodol. 1995;57:289–300. [Google Scholar]
- 31.Paulo JA, McAllister FE, Everley RA, Beausoleil SA, Banks AS, Gygi SP. Effects of MEK inhibitors GSK1120212 and PD0325901 in vivo using 10-plex quantitative proteomics and phosphoproteomics. Proteomics. 2015;15:462–73. doi: 10.1002/pmic.201400154. [DOI] [PMC free article] [PubMed] [Google Scholar]
- 32.Paulo JA, Gygi SP. A comprehensive proteomic and phosphoproteomic analysis of yeast deletion mutants of 14-3-3 orthologs and associated effects of rapamycin. Proteomics. 2015;15:474–86. doi: 10.1002/pmic.201400155. [DOI] [PMC free article] [PubMed] [Google Scholar]
- 33.Paulo JA, Gaun A, Gygi SP. Global analysis of protein expression and phosphorylation levels in nicotine-treated pancreatic stellate cells. J Proteome Res. 2015 doi: 10.1021/acs.jproteome.5b00398. [DOI] [PMC free article] [PubMed] [Google Scholar]
- 34.Turcotte B, Liang XB, Robert F, Soontorngun N. Transcriptional regulation of nonfermentable carbon utilization in budding yeast. FEMS Yeast Res. 2010;10:2–13. doi: 10.1111/j.1567-1364.2009.00555.x. [DOI] [PMC free article] [PubMed] [Google Scholar]
- 35.Gasch AP. The environmental stress response: a common yeast response to diverse environmental stresses. In: Hohmann S, Mager WH, editors. Yeast Stress Responses. Berlin, Heidelberg: Springer Berlin Heidelberg; 2003. pp. 11–70. [Google Scholar]
- 36.Kanehisa M, Goto S. KEGG: kyoto encyclopedia of genes and genomes. Nucleic Acids Res. 2000;28:27–30. doi: 10.1093/nar/28.1.27. [DOI] [PMC free article] [PubMed] [Google Scholar]
- 37.Ko CH, Liang H, Gaber RF. Roles of multiple glucose transporters in Saccharomyces cerevisiae. Mol Cell Biol. 1993;13:638–48. doi: 10.1128/mcb.13.1.638. [DOI] [PMC free article] [PubMed] [Google Scholar]
- 38.Lewis DA, Bisson LF. The HXT1 gene product of Saccharomyces cerevisiae is a new member of the family of hexose transporters. Mol Cell Biol. 1991;11:3804–13. doi: 10.1128/mcb.11.7.3804. [DOI] [PMC free article] [PubMed] [Google Scholar]
- 39.Garay-Arroyo A, Covarrubias AA. Three genes whose expression is induced by stress in Saccharomyces cerevisiae. Yeast. 1999;15:879–92. doi: 10.1002/(SICI)1097-0061(199907)15:10A<879::AID-YEA428>3.0.CO;2-Q. [DOI] [PubMed] [Google Scholar]
- 40.Miralles VJ, Serrano R. A genomic locus in Saccharomyces cerevisiae with four genes up-regulated by osmotic stress. Mol Microbiol. 1995;17:653–62. doi: 10.1111/j.1365-2958.1995.mmi_17040653.x. [DOI] [PubMed] [Google Scholar]
- 41.Thoms S, Debelyy MO, Nau K, Meyer HE, Erdmann R. Lpx1p is a peroxisomal lipase required for normal peroxisome morphology. FEBS J. 2008;275:504–14. doi: 10.1111/j.1742-4658.2007.06217.x. [DOI] [PubMed] [Google Scholar]
- 42.Niino YS, Chakraborty S, Brown BJ, Massey V. A new old yellow enzyme of Saccharomyces cerevisiae. J Biol Chem. 1995;270:1983–91. doi: 10.1074/jbc.270.5.1983. [DOI] [PubMed] [Google Scholar]
- 43.Bowman MJ, Jordan DB, Vermillion KE, Braker JD, Moon J, Liu ZL. Stereochemistry of furfural reduction by a Saccharomyces cerevisiae aldehyde reductase that contributes to in situ furfural detoxification. Appl Environ Microbiol. 2010;76:4926–32. doi: 10.1128/AEM.00542-10. [DOI] [PMC free article] [PubMed] [Google Scholar]
- 44.Ozcan S, Freidel K, Leuker A, Ciriacy M. Glucose uptake and catabolite repression in dominant HTR1 mutants of Saccharomyces cerevisiae. J Bacteriol. 1993;175:5520–8. doi: 10.1128/jb.175.17.5520-5528.1993. [DOI] [PMC free article] [PubMed] [Google Scholar]
- 45.Kruckeberg AL, Bisson LF. The HXT2 gene of Saccharomyces cerevisiae is required for high-affinity glucose transport. Mol Cell Biol. 1990;10:5903–13. doi: 10.1128/mcb.10.11.5903. [DOI] [PMC free article] [PubMed] [Google Scholar]
- 46.Martinez MJ, Roy S, Archuletta AB, Wentzell PD, Anna-Arriola SS, Rodriguez AL, et al. Genomic analysis of stationary-phase and exit in Saccharomyces cerevisiae: gene expression and identification of novel essential genes. Mol Biol Cell. 2004;15:5295–305. doi: 10.1091/mbc.E03-11-0856. [DOI] [PMC free article] [PubMed] [Google Scholar]
- 47.Yoshida Y, Sato T, Hashimoto T, Ichikawa N, Nakai S, Yoshikawa H, et al. Isolation of a gene for a regulatory 15-kDa subunit of mitochondrial F1F0-ATPase and construction of mutant yeast lacking the protein. Eur J Biochem. 1990;192:49–53. doi: 10.1111/j.1432-1033.1990.tb19193.x. [DOI] [PubMed] [Google Scholar]
- 48.Padilla PA, Fuge EK, Crawford ME, Errett A, Werner-Washburne M. The highly conserved, coregulated SNO and SNZ gene families in Saccharomyces cerevisiae respond to nutrient limitation. J Bacteriol. 1998;180:5718–26. doi: 10.1128/jb.180.21.5718-5726.1998. [DOI] [PMC free article] [PubMed] [Google Scholar]
- 49.Braun EL, Fuge EK, Padilla PA, Werner-Washburne M. A stationary-phase gene in Saccharomyces cerevisiae is a member of a novel, highly conserved gene family. J Bacteriol. 1996;178:6865–72. doi: 10.1128/jb.178.23.6865-6872.1996. [DOI] [PMC free article] [PubMed] [Google Scholar]
- 50.Entian KD, Schuster T, Hegemann JH, Becher D, Feldmann H, Guldener U, et al. Functional analysis of 150 deletion mutants in Saccharomyces cerevisiae by a systematic approach. Mol Gen Genet. 1999;262:683–702. doi: 10.1007/pl00013817. [DOI] [PubMed] [Google Scholar]
- 51.Heymann P, Ernst JF, Winkelmann G. A gene of the major facilitator superfamily encodes a transporter for enterobactin (Enb1p) in Saccharomyces cerevisiae. Biometals: an international journal on the role of metal ions in biology, biochemistry, and medicine. 2000;13:65–72. doi: 10.1023/a:1009250017785. [DOI] [PubMed] [Google Scholar]
- 52.Lesuisse E, Simon-Casteras M, Labbe P. Siderophore-mediated iron uptake in Saccharomyces cerevisiae: the SIT1 gene encodes a ferrioxamine B permease that belongs to the major facilitator superfamily. Microbiology. 1998;144(Pt 12):3455–62. doi: 10.1099/00221287-144-12-3455. [DOI] [PubMed] [Google Scholar]
- 53.Lamb TM, Mitchell AP. The transcription factor Rim101p governs ion tolerance and cell differentiation by direct repression of the regulatory genes NRG1 and SMP1 in Saccharomyces cerevisiae. Mol Cell Biol. 2003;23:677–86. doi: 10.1128/MCB.23.2.677-686.2003. [DOI] [PMC free article] [PubMed] [Google Scholar]
- 54.Zhao S, Douglas NW, Heine MJ, Williams GM, Winther-Larsen HC, Meaden PG. The STL1 gene of Saccharomyces cerevisiae is predicted to encode a sugar transporter-like protein. Gene. 1994;146:215–9. doi: 10.1016/0378-1119(94)90295-x. [DOI] [PubMed] [Google Scholar]
- 55.Pavlik P, Simon M, Schuster T, Ruis H. The glycerol kinase (GUT1) gene of Saccharomyces cerevisiae: cloning and characterization. Curr Genet. 1993;24:21–5. doi: 10.1007/BF00324660. [DOI] [PubMed] [Google Scholar]
- 56.Thompson A, Schafer J, Kuhn K, Kienle S, Schwarz J, Schmidt G, et al. Tandem mass tags: a novel quantification strategy for comparative analysis of complex protein mixtures by MS/MS. Analytical chemistry. 2003;75:1895–904. doi: 10.1021/ac0262560. [DOI] [PubMed] [Google Scholar]
- 57.Ross PL, Huang YN, Marchese JN, Williamson B, Parker K, Hattan S, et al. Multiplexed protein quantitation in Saccharomyces cerevisiae using amine-reactive isobaric tagging reagents. Mol Cell Proteomics. 2004;3:1154–69. doi: 10.1074/mcp.M400129-MCP200. [DOI] [PubMed] [Google Scholar]
- 58.Paulo JA, McAllister FE, Everley RA, Beausoleil SA, Banks AS, Gygi SP. Effects of MEK inhibitors GSK1120212 and PD0325901 in vivo using 10-plex quantitative proteomics and phosphoproteomics. Proteomics. 2014 doi: 10.1002/pmic.201400154. [DOI] [PMC free article] [PubMed] [Google Scholar]
- 59.Dephoure N, Gygi SP. Hyperplexing: a method for higher-order multiplexed quantitative proteomics provides a map of the dynamic response to rapamycin in yeast. Science signaling. 2012;5:rs2. doi: 10.1126/scisignal.2002548. [DOI] [PMC free article] [PubMed] [Google Scholar]
- 60.Doerr A. Mass spectrometry-based targeted proteomics. Nature methods. 2013;10:23. doi: 10.1038/nmeth.2286. [DOI] [PubMed] [Google Scholar]
Associated Data
This section collects any data citations, data availability statements, or supplementary materials included in this article.