Abstract
Parkinson disease (PD) is characterized by progressive neuronal degeneration, in particular nigrostriatal dopamine (NSDA) neurons and consequent deficits in movement. In mice and non-human primates, NSDA neurons preferentially degenerate following exposure to the neurotoxicant 1-methyl-4-phenyl-1,2,3,6-tetrahydropyridine (MPTP). Tuberoinfundibular (TI) DA neurons, in contrast, appear to be unaffected in PD and recover following acute MPTP exposure-induced injury (Behrouz et al., 2007; Benskey et al., 2012). The recovery of the TIDA neurons is dependent on de novo protein synthesis and positively correlated with an increase in parkin mRNA and protein expression (Benskey et al., 2012, 2015). Inhibition of parkin upregulation renders TIDA neurons susceptible to degeneration following MPTP exposure. In addition to parkin, other potentially protective proteins are likely to be differentially regulated in TIDA and NSDA neurons following neurotoxicant exposure. The regulation of potential transcription factors for parkin and other neuroprotective pathway genes are of interest since they may provide novel targets for PD disease modifying therapies. As such, we sought to determine if there are time-dependent differences in the expression of AP-1 transcription factors c-Fos, c-Jun, FosB, ΔFosB and JunD in TIDA and NSDA neurons of mice following acute MPTP exposure. We observed that both FosB and ΔFosB expression increase in brain regions containing TIDA, but not NSDA neurons. Furthermore, the nuclear and long-term expression of ΔFosB is consistent with its role as a transcription factor that may influence parkin transcription, which may underlie the unique ability of TIDA neurons to recovery from an injury that leads NSDA neurons to degeneration.
Keywords: Parkinson disease, nigrostriatal DA neurons, tuberoinfundibular DA neurons, ΔFosB, parkin
1. Introduction
Parkinson disease (PD) is characterized by progressive degeneration of the nigrostriatal dopamine (NSDA) neurons, leading to impaired motor function such as resting tremor, bradykinesia, rigidity, and postural instability (Nuytemans et al., 2010; Jankovic, 2008). The cell bodies of the NSDA neurons are located in the substantia nigra (SN), and the axons project rostral via the medial forebrain bundle to terminate in the striatum (ST). Though NSDA neurons are affected in PD, another population of DA neurons, the tuberoinfundibular (TI) DA neurons, are unaffected (Matzuk et al., 1985). TIDA neurons are located in the mediobasal hypothalamus, with cell bodies in the arcuate nucleus (ARC) and axon terminals in the median eminence, and are instrumental in the regulation of prolactin secretion from the anterior pituitary (Lookingland and Moore, 2005). The differential susceptibility of NSDA and TIDA neurons in PD is recapitulated by neurotoxicant animal studies with 1-methyl-4-phenyl-1,2,3,6-tetrahydropyridine (MPTP) and rotenone (Markey et al., 1984; Heikkila et al., 1984; Behrouz et al., 2007).
Following systemic injection, MPTP is taken up into glial cells where it is converted to an active metabolite 1-methyl-4-phenylpyridinium (MPP+). MPP+ accumulates in DA neurons via uptake by the DA transporter and thereby preferentially damages DA neurons (Dauer and Przedborski, 2003). MPP+ inhibits mitochondrial Complex I activity, produces oxidative stress (Chan et al., 1991), and displaces DA from presynaptic storage vesicle (Reinhart et al., 1987; Liu et al., 1992). Both TIDA and NSDA neurons are initially affected following MPTP administration, however, TIDA neurons are able to recover function and do not undergo degeneration (Behrouz et al., 2007; Benskey et al., 2012, 2013). Upregulation of a key PD-related gene, the E3 ubiquitin ligase parkin, is correlated with the ability of the TIDA neurons to recover (Benskey et al., 2012). Indeed, in response to acute MPTP administration parkin protein and mRNA increase in the ARC, but these remain unchanged the SN (Benskey et al., 2012). Similarly, in a chronic MPTP paradigm, parkin increases and remains elevated for at least 21 days after cessation of neurotoxicant exposure (Benskey et al., 2013). Suppression of parkin expression renders TIDA neurons susceptible to the toxic effects of MPTP (Benskey et al., 2015). The ability of the TIDA neurons to recover is dependent on de novo protein synthesis (Benskey et al., 2012). The increased expression of protective proteins, such as parkin, is most likely due to changes in gene transcription regulated by alterations in transcription factor expression.
The AP-1 family of transcription factors has been studied extensively. AP-1 transcription factors can form homo or heterodimeric complexes that contain a combination of binding dimers from either the Jun, Fos, activating transcription factor or Jun protein families (Hai and Curran, 1991). Members of the AP-1 family have been predicted in silica (Messeguer et al., 2002; Farre et al., 2003; West et al., 2003) and shown in cell culture to regulate parkin expression (Bouman et al., 2011; Sun et al., 2013)(Supplementary Figure 1). In the mouse brain, FosB and ΔFosB expression increase in the ST following MPTP exposure, but remain unchanged in the SN (Pérez-Otaño et al., 1998; Potashkin et al., 2007). The FosB gene, which encodes both FosB and ΔFosB, is regulated by both cAMP response element-binding protein (CREB) and serum response factor (SRF) (Morgan and Curran, 1995; Vialou et al., 2012). ΔFosB is produced through alternative splicing and is a truncated form of FosB lacking 101 amino acids on the C-terminal end (Nakabeppu and Nathans, 1991). The alternative splicing of FosB results in ΔFosB lacking two degron domains, thereby increasing the stability, accumulation, and prolonging the effects of ΔFosB at the promoter site (Nakabeppu and Nathans, 1991). Phosphorylation by casein kinase 2 has also been shown to increase the stability and transcriptional activity of ΔFosB (Ulery et al., 2006; Ulery and Nestler, 2007). Through the stability of ΔFosB and its target genes, ΔFosB is known to alter transcriptional regulation resulting in long-term desensitized responses to drug exposure in addiction (Nestler, 2008).
The goal of the present study is to examine the expression of AP-1 transcription factors in regions containing TIDA and NSDA neurons in response to MPTP. We observed that FosB and ΔFosB increase in the ARC, but not the SN, following acute MPTP exposure. Notably, the time-dependent increase of FosB/ΔFosB in the ARC following MPTP exposure parallels with the previously reported increase in parkin expression in acute and chronic neurotoxicant exposures (Benskey et al., 2012; 2013). FosB and ΔFosB are present in the nuclei of TIDA neurons, as would be expected of transcription factors responding to neurotoxic insult. Expression of FosB and ΔFosB is consistent with expectations of a transcription factor of parkin. This suggests FosB and ΔFosB are potentially involved in regulating injury induced parkin expression and possibly could be targets for neuroprotective therapy development.
2. Results
2.1 Temporal Expression of FosB and ΔFosB Following Acute MPTP Administration
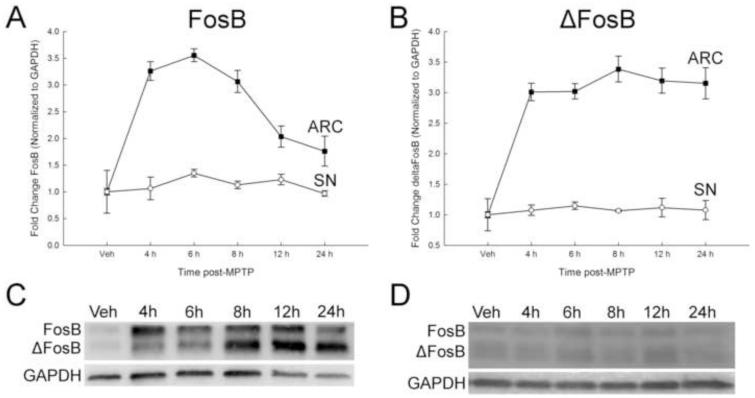
FosB and ΔFosB proteins are differentially expressed between brain regions containing DA neurons following acute administration of MPTP. In the ARC, FosB expression increased approximately 3-fold by 4 h post-MPTP and declined to two-fold by 12 and 24 h post-MPTP (Figure 1a and c). As with FosB, ΔFosB expression also increased by approximately 3-fold by 4 h post-MPTP and this increase was maintained up to 24 h post-MPTP (Figure 1b and d). Though FosB and ΔFosB are present in the SN, there was no change in expression of either protein at any time following MPTP treatment (Figure 1) These results demonstrate a differential response to neurotoxicant exposure between brain regions that occurs as early as 4 h post-MPTP, with peak FosB expression in the ARC already present at that time. In addition to FosB and ΔFosB, other transcription factors from the AP-1 family were measured. Unlike FosB and ΔFosB, the expression of c-Fos, c-Jun, and JunD were not changed at any time following MPTP treatment in either the ARC or SN (Table 1).
Figure 1.
Time course of the effects of acute MPTP on FosB and ΔFosB expression in the ARC and SN. Male mice (n=8/group) were treated with MPTP (20 mg/kg; s.c.) and killed by decapitation 4, 6, 8, 12, or 24 h post-injection. Vehicle-treated animals were injected with 0.9% saline (10 ml/kg; s.c.) decapitated 24 h later. The ARC and SN were microdissected and protein isolated from each region for Western blot analyses. FosB proteins were normalized to GAPDH. (A) FosB in the ARC and SN. (B) ΔFosB in the ARC and SN. Mean fold change from vehicle-treated mice are represented by circles with ± 1 standard error of the mean. Values for MPTP-treated mice that are significantly different (p < 0.05; one-way ANOVA) from the vehicle-treated controls are denoted with filled shapes. Representative Western blots of protein from the ARC (C) and SN (D).
Table 1.
Lack of effect of acute administration of MPTP on expression of c-Fos, c-Jun and JunD AP-1 transcription factors in the ARC and SN.
| ARC | SN | |||||
|---|---|---|---|---|---|---|
|
| ||||||
| Treatment | c-Fos | c-Jun | JunD | c-Fos | c-Jun | JunD |
| Veh | 1.00 ± 0.06 | 1.00 ± 0.26 | 1.00 ± 0.48 | 1.00 ± 0.05 | 1.00 ± 0.24 | 1.00 ± 0.35 |
| 4 h | 1.29 ± 0.09 | 1.22 ± 0.16 | 0.88 ± 0.15 | 1.06 ± 0.15 | 0.86 ± 0.21 | 0.85 ± 0.27 |
| 6 h | 1.23 ± 0.07 | 0.96 ± 0.14 | 1.05 ± 0.16 | 0.92 ± 0.02 | 0.80 ± 0.31 | 0.87 ± 0.30 |
| 8 h | 1.27 ± 0.23 | 1.02 ± 0.23 | 1.04 ± 0.19 | 0.95 ± 0.16 | 0.95 ± 0.27 | 0.72 ± 0.13 |
| 12 h | 1.14 ± 0.12 | 0.88 ± 0.25 | 1.41 ± 0.44 | 0.91 ± 0.02 | 1.07 ± 0.22 | 1.19 ± 0.30 |
| 24 h | 1.40 ± 0.23 | 0.94 ± 0.20 | 1.32 ± 0.32 | 0.90 ± 0.14 | 1.31 ± 0.18 | 0.96 ± 0.67 |
2.2 Early Expression of FosB and ΔFosB Following Acute MPTP Administration
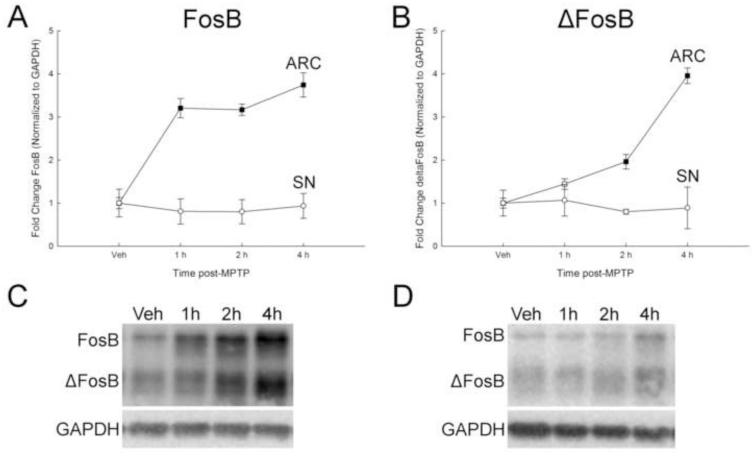
An early time-course experiment was performed to determine how rapidly FosB and ΔFosB expression increase in the ARC post-MPTP treatment. Consistent with data presented in Figure 1, FosB and ΔFosB were differentially expressed between brain regions (Figure 2) containing TIDA and NSDA neurons. In the ARC, FosB expression increased approximately 3-fold by 1 h post-MPTP and this increase was maintained at 2 and 4 h post MPTP (Figure 2a and c). ΔFosB expression did not increase until 2 h post-MPTP, where expression levels were approximately 2-fold and 4-fold higher than control at 2 and 4 h post MPTP treatment (Figure 2b and d). In the SN, there was no change in expression of either FosB or ΔFosB at 1, 2 or 4 h after MPTP (Figure 2).
Figure 2.
Early time course of the effects of acute MPTP on FosB and ΔFosB expression in the ARC and SN. Male mice (n=8/group) were treated with MPTP (20 mg/kg; s.c.) and killed by decapitation 1, 2, or 4 h post-injection. Vehicle-treated animals were injected with 0.9% saline (10 ml/kg; s.c.), decapitated 24 h later. The ARC and SN were microdissected and protein isolated from each region for Western blot analyses. FosB proteins were normalized to GAPDH. (A) FosB in the ARC and SN. (B) ΔFosB in the ARC and SN. Mean fold change from vehicle-treated mice are represented by circles with ± 1 standard error of the mean. Values for MPTP-treated mice that are significantly different (p < 0.05; one-way ANOVA) from the vehicle-treated controls are denoted with filled shapes. Representative Western blots of protein from the ARC (C) and SN (D).
2.3 Expression of Upstream Regulators of the FosB Gene, Phosphorylated CREB and SRF
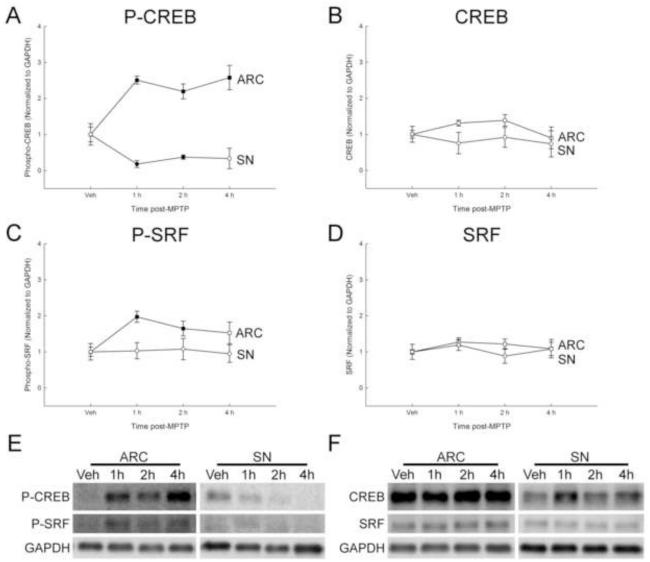
Known transcriptional activators of FosB, CREB and SRF were measured 1, 2 and 4 h after MPTP as a strategy to identify mechanisms underlying the MPTP-induced increase in FosB and ΔFosB in the ARC. The active form of CREB, phosphorylated at serine 133, increased over 2-fold by 1 h post-MPTP in the ARC and remained elevated at 4 h post-MPTP (Figure 3a and e). In contrast, phosphorylated CREB decreased by 1 and 2 h post-MPTP in the SN, and returned to basal levels by 4 h post-MPTP (Figure 3a and e). The expression of total CREB protein in the ARC or SN did not change at 1, 2, or 4 h post MPTP (Figure 3b and f). The active form of SRF, phosphorylated at serine 103, increased to approximately 2-fold at 1 and 2 h post-MPTP in the ARC and returned to basal levels by 4 h post-MPTP (Figure 3c and e). Phosphorylated SRF was unaltered in the SN at any of the time points examined, and there was no difference in total SRF in the ARC or SN (Figure 3c-f).
Figure 3.
Early time course of the effects of acute MPTP on CREB and SRF expression in the ARC and SN. Male mice (n=8/group) were treated with MPTP (20 mg/kg; s.c.) and killed by decapitation 1, 2, or 4 h post-injection. Vehicle-treated animals were injected with 0.9% saline (10 ml/kg; s.c.), decapitated 24 h later. The ARC and SN were microdissected and protein isolated from each region for Western blot analyses. CREB and SRF proteins were normalized to GAPDH. (A) Phosphorylated CREB (Ser133), (B) CREB, (C) phosphorylated SRF (Ser103), and (D) SRF in the ARC and SN. Mean fold change from vehicle treated mice are represented by circles with ± 1 standard error of the mean. Values for MPTP-treated mice that are significantly different (p < 0.05; one-way ANOVA) from the vehicle-treated controls are denoted with filled shapes. Representative Western blots of protein from the phosphorylated CREB and phosphorylated SRF (E) and CREB and SRF (F).
2.4 FosB and ΔFosB Expression in Nuclear and Cytoplasmic Fractions
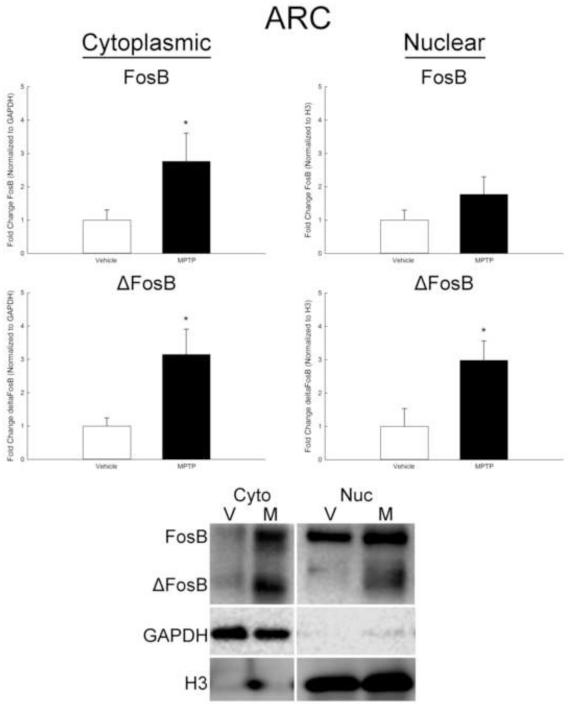
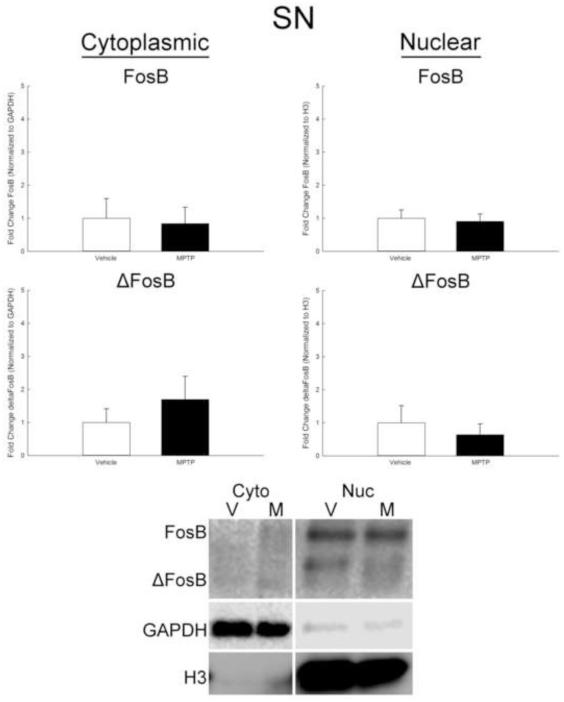
Since transcription factors need to be localized to the nucleus to be active, the partitioning of FosB and ΔFosB in cytoplasmic and nuclear fractions was examined. The ARC and SN were collected separately, processed with extraction buffers of increasing strength, and cytoplasmic and nuclear fractions collected for Western blot analyses. In the ARC, both FosB and ΔFosB increased in the cytoplasmic fraction approximately 3-fold 6 h after MPTP treatment (Figure 4). Expression of FosB in the nuclear fraction did not change after MPTP. However, ΔFosB increased approximately 3-fold in the nuclear fraction 6 h following treatment (Figure 4). There was no change in either FosB or ΔFosB in the cytoplasmic or nuclear fractions of the SN following MPTP (Figure 5).
Figure 4.
Effects of MPTP on expression of FosB and ΔFosB in cytoplasmic and nuclear fractions derived from the ARC. Male mice (n=8/group) were treated with 0.9% saline (10 ml/kg; s.c.) or MPTP (20 mg/kg; s.c.) and killed by decapitation 6 h later. The ARC was microdissected, cytoplasmic and nuclear fractions separated, and protein isolated for Western blot analyses. FosB and ΔFosB were normalized to GAPDH in the cytoplasmic fraction and to histone protein H3 in the nuclear fraction. Representative Western blots of protein from the cytoplasmic and nuclear fractions is shown below the graphs. Mean fold change from vehicle-treated mice are represented by bars with + 1 standard error of the mean. * indicates values for MPTP-treated mice that are significantly different (p < 0.05; t-test) from vehicle-treated controls.
Figure 5.
Lack of effect of MPTP on expression of FosB and ΔFosB in cytoplasmic and nuclear fractions derived from the SN. Male mice (n=8/group) were treated with 0.9% saline (10 ml/kg; s.c.) or MPTP (20 mg/kg; s.c.) and killed by decapitation 6 h later. The SN was microdissected, cytoplasmic and nuclear fractions separated, and protein isolated for Western blot analyses. FosB and ΔFosB were normalized to GAPDH in the cytoplasmic fraction and to histone protein H3 in the nuclear fraction. Representative Western blots of protein from the cytoplasmic and nuclear fractions is shown below the graphs. Mean fold change from vehicle-treated mice are represented by bars with + 1 standard error of the mean.
2.5 Localization of Total FosB protein to TH-immunoreaction Neurons
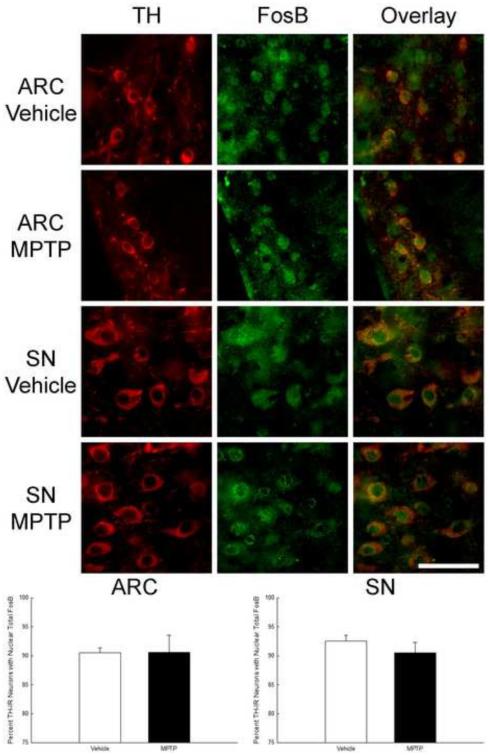
To determine if FosB is located in nuclei of TIDA and NSDA neurons following neurotoxicant exposure, immunofluorescent staining was used to co-localize TH, the rate-limiting enzyme in DA synthesis, and total FosBs (FosB and ΔFosB). The antibody used in this analysis recognizes both FosB and ΔFosB isoforms. Sections through the ARC and SN of vehicle- and MPTP-treated mice were collected 6 h after treatment, stained, imaged (Figure 6), and the total numbers of TH-immunoreactive neurons with and without FosB in the nuclei were counted. The percentage of TH-immunoreactive neurons with FosB stained nuclei were calculated for each brain region of individual mice and averaged across the treatment groups. In the ARC of vehicle-treated mice approximately 90% of TH neurons had total FosBs localized to nuclei and this did not change 6 h post-MPTP treatment (Figure 6 and Table 2). In the SN of vehicle-treated mice approximately 90% of TH neurons had total FosBs localized to the nuclei and this did not change at 6 h post-MPTP (Figure 6 and Table 2).
Figure 6.
Lack of effect of MPTP on the percent of TH-immunoreactive neurons co-localizing total (FosB + ΔFosB) protein in the ARC and SN. Male mice (n=5/group) were treated with 0.9% saline (10 ml/kg; s.c.) or MPTP (20 mg/kg; s.c.) and perfused 6 h later. Brains were cut into 20 μm sections and immunofluorescence was used to co-localize TH and total FosB. Sections 100 μm apart were imaged and TH-immunoreactive cells with and without FosB in the nucleus were counted. The mean percentage of TH-immunoreactive cells containing FosB in the nucleus are expressed as bars with + 1 standard error of the mean. Scale bar is 50 μm.
Table 2.
Mean percentage of DA neurons, total neurons, and glial cells containing FosB
| DA Neurons | Total Neurons | Glia | ||||
|---|---|---|---|---|---|---|
|
|
||||||
| ARC | SN | ARC | SN | ARC | SN | |
| Vehicle | 90.6% ± 0.4% | 92.5% ± 0.4% | 98.7% ± 0.9% | 97.7% ± 0.9% | 8.0% ± 2.7% | 11.7% ± 4.6% |
| MPTP | 88.8% ± 1.3% | 90.5% ± 0.8% | 98.5% ± 0.6% | 97.9% ± 0.6% | 7.6% ± 1.4% | 11.1% ± 3.4% |
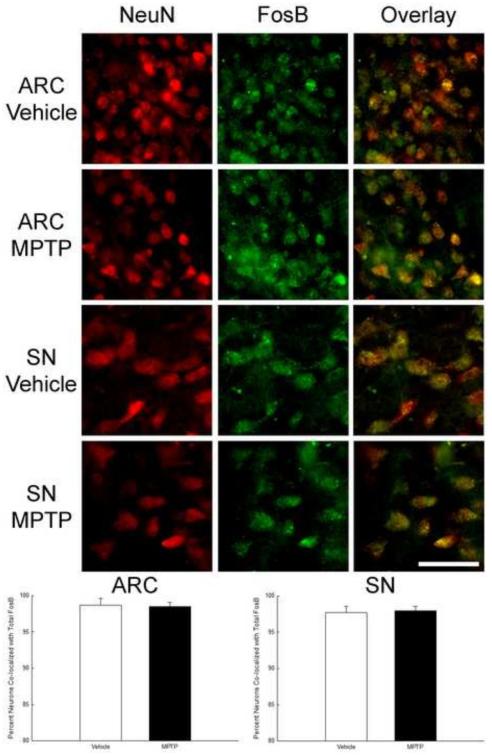
It is possible that observed changes in FosB and ΔFosB from tissue samples were occurring in non-DA neurons. As such, we evaluated the nuclear expression of FosB using NeuN as a phenotype independent neuronal marker. Sections from the ARC and SN of vehicle MPTP-treated (6 h) mice were immunohistochemically stained for total FosB and NeuN. A majority (>95%) of all ARC and SN neurons in vehicle and MPTP treated mice exhibited nuclear staining for FosB, with no change after MPTP (Figure 7 and Table 2).
Figure 7.
Lack of effect of MPTP on the percent of all neurons co-localizing total (FosB + ΔFosB) protein in the ARC and SN. Male mice (n=5/group) were treated with 0.9% saline (10 ml/kg; s.c.) or MPTP (20 mg/kg; s.c.) and perfused 6 h later. Brains were cut into 20 μm sections and immunofluorescence was used to co-localize NeuN and total FosB. Sections 100 μm apart were imaged and NeuN-immunoreactive cells with and without FosB were counted. The mean percentage of NeuN-immunoreactive cells containing FosB are expressed as bars with + 1 standard error of the mean. Scale bar is 50 μm.
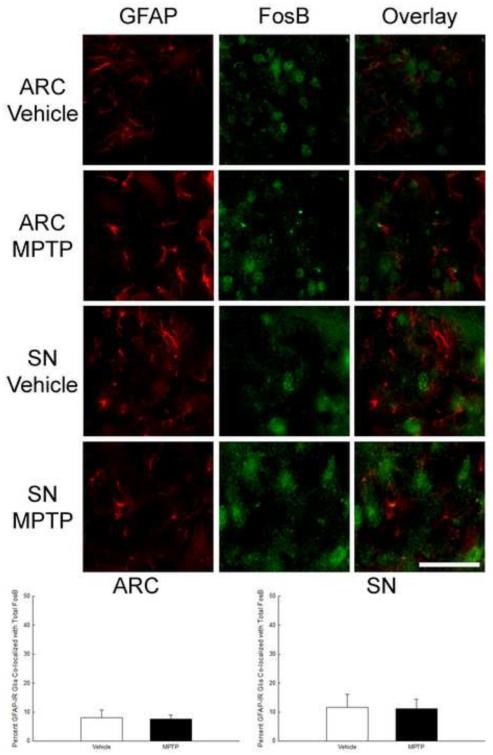
To evaluate the possibility that changes in tissue levels of FosB and ΔFosB were occurring in non-neuronal cells, immunofluorescent staining for nuclear FosB and the glial marker, GFAP, was used to stain sections from the ARC and SN of vehicle and 6 h post-MPTP treated mice. Only a small percentage (~10%) of cells stained with GFAP co-localized with total FosB (~10%) in the ARC and SN of saline-treated mice and there was no change in these percentages following treatment with MPTP (Figure 8 and Table 2). .
Figure 8.
Lack of effect of MPTP on the percent of glia co-localizing total (FosB + ΔFosB) protein in the ARC and SN. Male mice (n=5/group) were treated with 0.9% saline (10 ml/kg; s.c.) or MPTP (20 mg/kg; s.c.) and perfused 6 h later. Brains were cut into 20 μm sections and immunofluorescence was used to co-localize GFAP and total FosB. Sections 100 μm apart were imaged and GFAP-immunoreactive cells with and without FosB were counted. The mean percentage of GFAP-immunoreactive cells containing FosB in nuclei are expressed as bars with + 1 standard error of the mean. Scale bar is 50 μm.
2.6 Long-Term Effects of Acute Single MPTP Exposure on the Expression of ΔFosB and Parkin
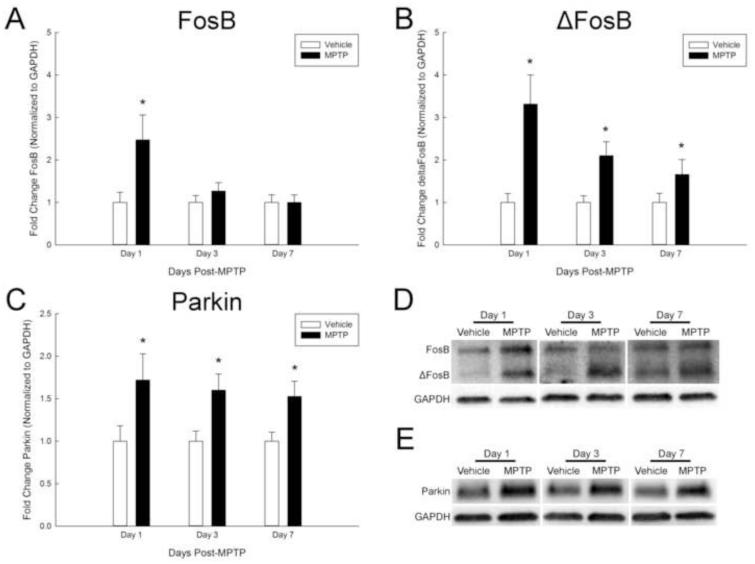
The expression of ΔFosB is frequently persistent long after initial induction. We, therefore, determined the expression of FosB and ΔFosB over a prolonged time course following neurotoxicant exposure. Consistent with results shown in Figure 1, both FosB and ΔFosB were increased in the ARC at 1 day post-MPTP (Figure 9a, b, and d). FosB was 2-fold higher in the MPTP-treated mice compared to vehicle-treated mice at 1 day post-MPTP. Levels of FosB returned to basal levels by 3 and 7 days post-MPTP (Figure 9a and d). ΔFosB expression was approximately 3-fold higher in the ARC of MPTP-treated mice compared to vehicle treated mice 1 day following treatment. The increase in ΔFosB in the ARC was persistent up to 7 days post-MPTP (Figure 9b and d). Expression of parkin in the ARC was increased at 1, 3, and 7 days post-MPTP (Figure 9c and e). Pearson correlation coefficients calculated for ΔFosB and parkin were 0.885 at 1 day post-MPTP, 0.899 at 3 days post-MPTP, and 0.894 at 7 days post-MPTP (Supplementary Table 6). Spearman correlation coefficients calculated for ΔFosB and parkin were 0.929 at 1 day post-MPTP, 0.922 at 3 days post-MPTP, and 0.738 at 7 days post-MPTP (Supplementary Table 6). In addition to Pearson and Spearman correlation coefficients, linear regressions were plotted for FosB and ΔFosB at 1, 3, and 7 days post-MPTP (Supplementary Figure 2).
Figure 9.
Long-term changes of ΔFosB and parkin expression in the ARC after acute MPTP administration. Male mice (n=8/group) were treated with 0.9% saline (10 ml/kg; s.c.) or MPTP (20 mg/kg; s.c.) and killed by decapitation 1, 3, or 7 days post-injection. The ARC was microdissected and protein isolated from each region for Western blot analyses. FosB (A), ΔFosB (B) and parkin (C) were normalized to GAPDH. Representative Western blots for both FosB and ΔFosB (D) and parkin (E) are shown. Mean fold change from vehicle-treated mice are represented by bars with + 1 standard error of the mean. * indicates values for MPTP-treated mice that are significantly different (p < 0.05; t-test) from the same-day vehicle-treated controls
3. Discussion
3.1 Differential effects of MPTP on AP-1 transcription factor expression
Differential and long-term expression of FosB and ΔFosB supports the hypothesis that these transcription factors may play an adaptive role in response to neurotoxic insult and could be transcriptional activators of parkin or other neuroprotective proteins. Within the group of AP-1 proteins examined in the present study, only FosB and ΔFosB are responsive to MPTP exposure in the ARC. The MPTP-induced increase in FosB and ΔFosB expression in the ARC corresponds with activation of parkin expression and sparing of TIDA neurons located in this brain region (Behrouz et al, 2007; Benskey et al., 2012; 2013; 2015). Conversely, neither FosB or ΔFosB expression were altered in the SN following MPTP, which corresponds with a lack of effect of this neurotoxicant on parkin expression and the higher susceptibility of NSDA neurons located in this region to degeneration following neurotoxicant exposure and degeneration in PD (Behrouz et al, 2007; Matzuk et al., 1985; Heikkila et al., 1984; Benskey et al., 2012, 2013, 2015). In the context of an acute MPTP exposure paradigm, there is limited neurodegeneration of the NSDA neurons within 24h after MPTP, and no degeneration of the TIDA neurons (Meredith and Rademacher, 2011; Benskey et al., 2013). MPTP causes rapid changes within hours and effects NSDA, TIDA and MLDA neurons, with recovery observed in the TIDA neurons and partial recovery in the MLDA neurons (Behrouz et al., 2007). While PD is a slowly progressive neurodegenerative process, this could occur via multiple, acute events occurring sequentially over time. Notably, the resistance of TIDA neurons to acute MPTP exposure is also observed in chronic toxicant models of PD (Benskey et al., 2013). It is possible, however, that the difference in the rapid onset of stress caused by MPTP as compared to the slow progression of PD plays a factor in the induction of FosB and ΔFosB expression.
Previous studies reported that FosB/ΔFosB protein and mRNA expression are increased in the ST following MPTP exposure (Perez-Otano et al., 1998). Notably, the MPTP exposure paradigm used for these studies required more aggressive toxicant exposure (e.g., multiple repeated doses of MPTP) to observe any changes in striatal ΔFosB expression (Perez-Otano et al., 1998; Potashkin et al., 2007). It is likely that changes in FosB were occurring in medium spiny neurons of the striatum, perhaps in response to axonopathy of NSDA neurons and loss of DA receptor-mediated regulation of these neurons (Gerfen et al., 2011; Albin et al., 1989).
The expression of c-Fos and c-Jun were previously reported to increase the SN following multiple or high doses of MPTP (Duchemin et al., 1992; Nishi, 1997; Chen et al., 2001). The high exposure MPTP paradigms are more severe than the acute single injection paradigm employed in the current studies, which could explain why no increases in c-Fos or c-Jun were observed in the SN. Consistent with the present results, Potashkin et al., reported that there was no change in the expression of FosB/ΔFosB in the SN following chronic MPTP. This latter study also noted that the ratio of ΔFosB to FosB decreased in the SN after acute MPTP (Potashkin et al., 2007). Our observation that Fos and ΔFosB do not change following a single low dose of MPTP (20 mg/kg), while higher doses of MPTP are associated with increase expression, suggests there is a threshold of injury of NSDA neurons required to initiate AP-1 transcription factor dependent changes in the SN. Notably, higher doses or chronic paradigms of MPTP exposure are also associated with the loss of NSDA neurons, whereas the low dose single exposure paradigm employed in the present studies does not cause loss of these neurons (Benskey et al., 2012).
In contrast to FosB and ΔFosB, the expression of c-Fos or c-Jun does not change in the ARC at any of the times examined in response to MPTP. It is possible that expression of these immediate early transcription factors increases prior to 4 h, which was the earliest measured time-point for c-Fos and c-Jun. High levels of MPP+ have, however, been observed at 4 h in the axon terminal regions of both the TIDA and NSDA neurons and MPP+ persists in the tissue for at least 24 h (Benskey et al., 2012). Taken together, this suggests changes in c-Fos and c-Jun should still be present, as long as MPP+ is present in the tissue. In addition, phosphorylation of c-Fos, c-Jun, or both may occur to modulate activity independent of steady state levels of these transcription factors to promote transcription of neuroprotective proteins.
3.2 Effects of MPTP on FosB transcription factor expression
In order to identify possible transcriptional activators of the FosB gene, the effects of MPTP on SRF and CREB were examined (Vialou et al., 2012). Both CREB and SRF have been shown to have a potential role in the response to oxidative stress in neurons (Lee et al., 2009; Rieker et al., 2012). Phosphorylated SRF and CREB both increase early after MPTP in the ARC but not the SN. Total SRF and CREB expression is not effected by MPTP, suggesting that increased kinase activity, rather than transcription leads to the increases the phosphorylated forms.
In relation to FosB and ΔFosB expression, both phosphorylated SRF and CREB expression are consistent with these transcription factors acting on the FosB gene. By the earliest time after MPTP (1 h), FosB was already elevated, however, ΔFosB levels were not significantly increased until 2 h after MPTP, and had not attained its highest levels until 4 h. This suggests that transcription factors would be expected to be acting at the FosB promoter and still be present at 1 and 2 h after neurotoxicant exposure. At both 1 and 2 h, phosphorylated SRF levels are elevated and at 1, 2 and 4 h, phosphorylated CREB is elevated. Though none of the time points measured show the increase in phosphorylated SRF or CREB preceding FosB expression, the differential expression between the ARC and SN, and the temporal expression of phosphorylated SRF and CREB are consistent with their known roles as transcriptional activators of FosB.
In addition to interactions with the FosB gene, phosphorylation of SRF and CREB are potentially activators of other genes that could aid in the recovery of the TIDA neurons. The loss of SRF for example, has been shown to increase the sensitivity of DA neurons to MPTP (Rieker er al., 2012). This suggests that the increase of phosphorylated SRF could be beneficial to the TIDA neurons, possibly through activation of FosB/ΔFosB expression.
3.3 Effects of MPTP exposure on nuclear localization of FosB/ΔFosB
The role FosB and ΔFosB as transcription factors in response to MPTP is dependent on nuclear localization. Both FosB and ΔFosB are localized in both the cytoplasm and the nuclei in the ARC and the SN. Though no change in localization or expression occurs in the SN, there are increases in both the cytoplasm and nuclei found in the ARC. As would be expected of a transcription factor, ΔFosB increases in the nuclear fraction, whereas FosB does not show a significant increase in the nuclear fraction. Increased nuclear localization of ΔFosB and not FosB could be due to phosphorylation at serine 27 by casein kinase 2. Phosphorylayion of ΔFosB increases the stability and transcriptional activity of ΔFosB, and not FosB (Ulery and Nestler et al., 2007). When casein kinase 2 is inhibited, translocation of ΔFosB into the nucleus decreases (Ulery and Nestler et al., 2007). By extension, this suggests that via ΔFosB phosphorylation its translocation into the nucleus increases compared to FosB, which could explain why ΔFosB, and not FosB increases in the nuclear fraction at 6 h.
3.4 Effects of MPTP exposure on nuclear localization of FosBs in TH-immunoreactive neurons in the ARC and SN
Increases in FosB and ΔFosB in the nuclear fraction occur in regions containing DA neurons. To further resolve if the changes occur in DA neurons, immunofluorescent staining was employed. The immunofluorescent staining for total FosB TH immunoreactive neurons at 6 h after MPTP administration shows no change in the number of DA neurons with total FosBs in the nuclei in both the ARC and SN. The lack of increase in the number of DA neurons expressing total FosB suggests that increased expression occurs within individual TIDA neurons, rather than an increase in the numbers of TIDA neurons expressing FosB/ΔFosB.
Alternatively, the number of non-DA neurons or glia expressing total FosB could be increasing, but both NeuN and GFAP staining for total neurons and glia, respectively, show that the number of cells expressing total FosB does not change with MPTP. In the ARC and SN, almost all of the neurons observed express FosB to some degree. Though other neurons express total FosB in the ARC, the increase in FosB and ΔFosB is most likely occurring in DA neurons due to the selectivity of MPP+ for the DA transporter (Bezard et al., 1998; Javitch et al., 1985). As with neurons, both astrocytes and microglia have been shown to have the potential to express FosB and ΔFosB (Li et al., 2008; Nomaru et al., 2014). In both the ARC and SN, a low percentage of glia co-localize FosB. Considering the low number of total FosB expressing glia, the increase in FosB and ΔFosB observed in the Western blots are not likely due to changes in these non-neuronal cells.
3.5 A potential connection between neurotoxicant-induced expression of FosB/ΔFosB and parkin
The increased expression of FosB and ΔFosB in the ARC suggests activation of target genes responding to mediators of the effects of MPTP, such as oxidative stress and mitochondrial impairment. One gene known to respond to MPTP is the PD related Park2, which encodes for the protein parkin (Benskey et al., 2012). Expression patterns of FosB and ΔFosB, as well as putative AP-1 site on the Park2 promoter support a potential role for FosB and ΔFosB as transcription factors of parkin (Messeguer et al., 2002; Farre et al., 2003). Parkin protein increases by 12 h, and mRNA increases by 8 h post-MPTP (Benskey et al., 2012). FosB and ΔFosB protein increases by 2 h post-MPTP, total FosB is found in nuclei of TIDA neurons in the ARC, and at least ΔFosB has been shown to increase in nuclei in the ARC at 6 h post-MPTP – all of which is in line with expectations of transcription factors of parkin. In addition, both ΔFosB and parkin expression is elevated for at least 7 days post-MPTP, suggesting the long-term expression of ΔFosB instills long-term parkin expression. In addition, correlation analyses suggest a clear correlation between ΔFosB and parkin at 1, 3, and 7 days post-MPTP, consistent with what would be expected of a long-term transcription factor of parkin.
Further evidence supporting a role for ΔFosB in parkin expression, are experiments involving a chronic treatment paradigm of MPTP. In one paradigm, mice treated every 3.5 days for 35 days with MPTP were allowed to recover 21 days, and even after the recovery period, parkin remained elevated in the ARC (Benskey et al., 2013). Chronic MPTP, along with the cumulative nature of ΔFosB, could explain elevated parkin levels three weeks after the last MPTP exposure.
ΔFosB is known to increase in response to stress and act as a mediator of neural plasticity via changes in receptors and number of dendritic spines (Pitchers et al., 2013; Perrotti et al., 2004; Zachariou et al., 2006; Kelz et al., 1999). Long-term changes within the ARC, such as those induced by ΔFosB, could yield neuroprotective effects through the potentially neuroprotective protein parkin. Since parkin plays a role in the ubiquitin-proteasome system, mitophagy, mitochondrial fission and fusion thereby removing damaged proteins and mitochondria, increasing parkin could counteract and compensate for the deleterious effects of MPTP toxicity (Tanaka et al., 2001; Narendra et al., 2008; Lutz et al., 2009; Park et al., 2009; Poole et al., 2010). Corresponding differential and temporal expression of FosB/ΔFosB and parkin are congruent with the hypothesis that FosB (and especially long-term changes in ΔFosB) may increase parkin in the ARC, and feasibly be responsible for the neurotoxicant resistance of TIDA neurons. Additional studies however, are required to show if there is a causal link between FosB/ΔFosB and parkin, and if they are direct transcription factors of parkin or part of a pathway that influences parkin expression.
4. Experimental Procedure
4.1 Animals
C57BL/6J male WT mice were obtained from The Jackson Laboratory. Mice were housed 3-5 to a cage in a room with a 12 h light/dark cycle and provided food and water ad libitum. All animal use was performed with approval from the Michigan State University Institutional Animal Care and Use Committee (AUF 10/14-183-00).
4.2 Drug Treatment
MPTP (Sigma Aldrich #M0896) was dissolved in 0.9% saline and diluted to 2.0 mg/ml based on the free base of MPTP. Animals were randomly assigned to treatment groups and were injected with MPTP (20 mg/kg; s.c.) or vehicle (0.9% saline, 10 ml/kg; s.c.). A significant decrease in DA and DOPAC levels in the striatum via neurochemistry was used to confirm MPTP efficacy as previously described (Benskey et al., 2012).
4.3 Tissue Preparation
At the designated times, mice were killed by decapitation, the brain frozen on dry ice, and 500 μm sections were cut in a cryostat. Coronal sections containing the ARC, and SN were collected on glass slides and the brain regions individually microdissected. Tissue was transferred into lysis buffer (50 mM Tris, 150 mM NaCl, 0.1% SDS, 1% Triton ×100, 1 mM dithiothreitol, 0.1mM phenylmethylsulfonyl fluoride, 1× Halt™ protease and 1× Halt™ phosphatase inhibitor). Samples were lysed by sonication and centrifuged at 10,000 × g for 10 min. A bicinchoninic acid assay was used to determine protein concentrations, samples were diluted to equal amounts of protein and used for Western blot analyses.
4.4 Nuclear and Cytoplasmic Faction Isolation
Nuclear extractions were performed based on methods reported by Karunakaran and Ravindranath (2009) and Korner et al. (1989). Mice were killed by decapitation; the brain was removed, placed in cold PBS, and sectioned with a razor blade using a Zivic brain matrix. Sections containing the ARC and SN were collected and the regions were individually microdissected and transferred into a PBS in a 0.5 ml microcentrifuge tube. Tubes were briefly centrifuged, PBS decanted, and 30 μl of weak lysis buffer (10 mM HEPES (pH 7.9), 1.5 mM MgCl2, 10 mM KCl, 0.5 mM dithiothreitol, 1× Halt™ protease and 1× Halt™ phosphatase inhibitor cocktails) added to each tube. Four gentle strokes with a Kimble™ Kontes™ Pellet Pestle™ with chlorotrifluoroethylene tip was used to homogenize the tissue. Samples were incubated on ice in weak lysis buffer for 5 min and centrifuged at 10,000 g for 10 min at 4 °C. Supernatant collected (cytoplasmic fraction) and 20 μl of a strong lysis buffer (20 mM HEPES (pH 7.9) 0.84 M NaCl, 1.5 mM MgCl2, 0.4 mM EDTA, 0.5 mM dithiothreitol, 1× Halt™ protease and 1× Halt™ phosphatase inhibitor cocktails) added to the pellet. Pellet was re-suspended, incubated on ice for 30 min (vortexing every 10 min), and centrifuged at 10,000 g for 10 min at 4°C. Supernatant was collected (nuclear fraction), a bicinchoninic acid assay assay used to measure protein concentration in both the cytoplasmic and nuclear fractions, and equal amounts of protein used for Western blotting.
4.5 Western Blot Analyses
Protein from each sample was run on a 4-20% Tris-HCl gel (Bio-Rad), and transferred to a polyvinylidene fluoride membrane. Membranes were incubated with 1:500 rabbit anti- FosB (Cell Signaling #2251), 1:500 rabbit anti-c-Fos (Cell Signaling #4384), 1:500 rabbit anti-c-Jun (Millipore #09-754), 1:500 rabbit anti-JunD (Cell Signaling #5000), 1:1000 rabbit anti-phospho-SRF (Ser103) (Cell Signaling #4261), 1:1000 rabbit anti-SRF (Cell Signaling #5147), 1:1000 rabbit anti-phospho-CREB (Ser133) (Cell Signaling #9198), 1:1000 rabbit anti-CREB (Cell Signaling #9197), 1:1000 mouse anti-parkin (Cell Signaling #4221), 1:3000 mouse anti-GAPDH (Sigma Aldrich #G8795), or 1:1000 rabbit anti-Histone H3 (Cell Signaling #4499). Membranes were washed and incubated with 1:3000 horse anti-mouse conjugate HRP (Cell Signaling #7076), or 1:3000 goat anti- rabbit conjugated HRP (Cell Signaling #7074). A SuperSignal™ West Femto (Thermo Scientific #34095) or SuperSignal™ West Pico (Thermo Scientific #34077) substrate kit was used with the LI-COR Fc Odyssey Infrared Imaging System. Band densitometry was performed using Li-Cor Image Studio Lite (version 5.0).
4.6 Immunofluorescent Staining and Quantification
Mice were anesthetized with a lethal dose of ketamine:xylazine (24.4 mg/kg:3.6 mg/kg) and transcardially perfused with 0.9% saline, followed by 4% paraformaldehyde in 0.1M phosphate buffer (pH 7.4). Perfused brains were removed and transferred to vials of 4% parafomaldehyde for 24 h at 4°C. Fixed brains were placed in 20% Sucrose-phosphate buffer until fully infiltrated for cryoprotection. Coronal sections (20 μm) through the ARC, and SN were cut on a cryostat, and sections collected in five groups, 100 μm apart in 0.05 M phosphate buffer (pH 7.4). Brain sections were washed in phosphate buffer with 0.1% Triton ×100, then blocked in 5% normal goat serum or 5% bovine serum albumin. Sections were transferred into 1:1000 rabbit anti-FosB (SCBT #sc-48), 1:500 sheep anti-TH (Millipore #AB1542), 1:500 goat anti-GFAP (SCBT #sc-6170) or 1:500 rabbit anti-NeuN Cy3 conjugate (Millipore #ABN78C3). Sections were washed, incubated with 1:1000 F(ab')2 anti-rabbit Alexa Fluor® 488 conjugate (Cell Signaling #4412), 1:1000 donkey anti-sheep Alexa Fluor® 594 conjugate (Thermo Scientific #A11016), or 1:1000 donkey anti-goat Alexa Fluor® 594 conjugate (Thermo Scientific #A11058), and mounted. Slides were imaged with a Nikon TE2000-U inverted fluorescent microscope. ImageJ was used to quantify cells co-localized with or without FosB staining in sections located 100 μm apart (Abramoff et al., 2004). The percentage of the cells containing total FosB were calculated and averaged across animals within each treatment group.
4.7 Statistical Analysis
One-way analysis of variance (ANOVA) tests were used to detect differences between three or more groups, and two-sample t-tests were used to detect differences between two groups. Sample sizes had a power greater than or equal to 0.80. A p value less than or equal to 0.05 was considered a significant difference. In experiments where an ANOVA was used and a significant difference was found, post hoc Tukey tests were used for comparisons between groups. F and t-values for each experiment, as well as which test was used are shown in supplementary tables 1-5. Pearson and Spearman correlations coefficients were calculated for comparisons of FosB and ΔFosB, to parkin (Supplementary Table 6). Animals were randomly assigned to treatment groups and investigators conducting endpoint data collection were blinded to treatment group assignment.
Supplementary Material
Highlights.
FosB and ΔFosB expression increases after MPTP in the arcuate nucleus.
FosB and ΔFosB expression does not increase in the substantia nigra.
Known transcriptional activators FosB increase in the arcuate nucleus.
Long-term expression of parkin correlates with the expression pattern of ΔFosB.
Acknowledgements
This work was supported by the National Institute of Health grants R01 NS065338-01A1.
Footnotes
Publisher's Disclaimer: This is a PDF file of an unedited manuscript that has been accepted for publication. As a service to our customers we are providing this early version of the manuscript. The manuscript will undergo copyediting, typesetting, and review of the resulting proof before it is published in its final citable form. Please note that during the production process errors may be discovered which could affect the content, and all legal disclaimers that apply to the journal pertain.
Conflict of Interest: None
References
- Abramoff MD, Magalhaes PJ, Ram SJ. Image processing with ImageJ. Biophotonics international. 2004;11(7):36–42. [Google Scholar]
- Albin RL, Young AB, Penney JB. The functional anatomy of basal ganglia disorders. Trends in neurosciences. 1989;12:366–375. doi: 10.1016/0166-2236(89)90074-x. [DOI] [PubMed] [Google Scholar]
- Behrouz B, Drolet RE, Sayed ZA, Lookingland KJ, Goudreau JL. Unique responses to mitochondrial complex I inhibition in tuberoinfundibular dopamine neurons may impart resistance to toxic insult. Neuroscience. 2007;147:592–598. doi: 10.1016/j.neuroscience.2007.05.007. [DOI] [PMC free article] [PubMed] [Google Scholar]
- Benskey M, Behrouz B, Sunryd J, Pappas SS, Baek SH, Huebner M, Lookingland KJ, Goudreau JL. Recovery of hypothalamic tuberoinfundibular dopamine neurons from acute toxicant exposure is dependent upon protein synthesis and associated with an increase in parkin and ubiquitin carboxy-terminal hydrolase-L1 expression. Neurotoxicology. 2012;33:321–331. doi: 10.1016/j.neuro.2012.02.001. [DOI] [PMC free article] [PubMed] [Google Scholar]
- Benskey M, Lee KY, Parikh K, Lookingland KJ, Goudreau JL. Sustained resistance to acute MPTP toxicity by hypothalamic dopamine neurons following chronic neurotoxicant exposure is associated with sustained up-regulation of parkin protein. Neurotoxicology. 2013;37:144–153. doi: 10.1016/j.neuro.2013.04.002. [DOI] [PMC free article] [PubMed] [Google Scholar]
- Benskey MJ, Manfredsson FP, Lookingland KJ, Goudreau JL. The role of parkin in the differential susceptibility of tuberoinfundibular and nigrostriatal dopamine neurons to acute toxicant exposure. Neurotoxicology. 2015;46:1–11. doi: 10.1016/j.neuro.2014.11.004. [DOI] [PMC free article] [PubMed] [Google Scholar]
- Bezard E, Imbert C, Gross CE. Experimental models of Parkinson's disease: from the static to the dynamic. Reviews in the neurosciences. 1998;9:71–90. doi: 10.1515/revneuro.1998.9.2.71. [DOI] [PubMed] [Google Scholar]
- Bouman L, Schlierf A, Lutz AK, Shan J, Deinlein A, Kast J, Galehdar Z, Palmisano V, Patenge N, Berg D, Gasser T, Augustin R, Trumbach D, Irrcher I, Park DS, Wurst W, Kilberg MS, Tatzelt J, Winklhofer KF. Parkin is transcriptionally regulated by ATF4: evidence for an interconnection between mitochondrial stress and ER stress. Cell death and differentiation. 2011;18:769–782. doi: 10.1038/cdd.2010.142. [DOI] [PMC free article] [PubMed] [Google Scholar]
- Chan P, DeLanney LE, Irwin I, Langston JW, Di Monte D. Rapid ATP loss caused by 1-methyl-4-phenyl-1,2,3,6-tetrahydropyridine in mouse brain. Journal of neurochemistry. 1991;57:348–351. doi: 10.1111/j.1471-4159.1991.tb02134.x. [DOI] [PubMed] [Google Scholar]
- Chen JY, Hsu PC, Hsu IL, Yeh GC. Sequential up-regulation of the c-fos, c-jun and bax genes in the cortex, striatum and cerebellum induced by a single injection of a low dose of 1-methyl-4-phenyl-1,2,3,6-tetrahydropyridine (MPTP) in C57BL/6 mice. Neuroscience letters. 2001;314:49–52. doi: 10.1016/s0304-3940(01)02281-9. [DOI] [PubMed] [Google Scholar]
- Dauer W, Przedborski S. Parkinson's disease: mechanisms and models. Neuron. 2003;39:889–909. doi: 10.1016/s0896-6273(03)00568-3. [DOI] [PubMed] [Google Scholar]
- Duchemin AM, Gudehithlu KP, Neff NH, Hadjiconstantinou M. c-fos mRNA in mouse brain after MPTP treatment. Neurochemistry international. 1992;20:281–287. doi: 10.1016/0197-0186(92)90042-p. [DOI] [PubMed] [Google Scholar]
- Farre D, Roset R, Huerta M, Adsuara JE, Rosello L, Alba MM, Messeguer X. Identification of patterns in biological sequences at the ALGGEN server: PROMO and MALGEN. Nucleic acids research. 2003;31:3651–3653. doi: 10.1093/nar/gkg605. [DOI] [PMC free article] [PubMed] [Google Scholar]
- Gerfen CR, Surmeier DJ. Modulation of striatal projection systems by dopamine. Annual review of neuroscience. 2011;34:441–466. doi: 10.1146/annurev-neuro-061010-113641. [DOI] [PMC free article] [PubMed] [Google Scholar]
- Hai T, Curran T. Cross-family dimerization of transcription factors Fos/Jun and ATF/CREB alters DNA binding specificity. Proceedings of the National Academy of Sciences of the United States of America. 1991;88:3720–3724. doi: 10.1073/pnas.88.9.3720. [DOI] [PMC free article] [PubMed] [Google Scholar]
- Heikkila RE, Hess A, Duvoisin RC. Dopaminergic neurotoxicity of 1-methyl-4-phenyl-1,2,5,6-tetrahydropyridine in mice. Science. 1984;224:1451–1453. doi: 10.1126/science.6610213. [DOI] [PubMed] [Google Scholar]
- Jankovic J. Parkinson's disease: clinical features and diagnosis. Journal of neurology, neurosurgery, and psychiatry. 2008;79:368–376. doi: 10.1136/jnnp.2007.131045. [DOI] [PubMed] [Google Scholar]
- Javitch JA, D'Amato RJ, Strittmatter SM, Snyder SH. Parkinsonism-inducing neurotoxin, N-methyl-4-phenyl-1,2,3,6 -tetrahydropyridine: uptake of the metabolite N-methyl-4-phenylpyridine by dopamine neurons explains selective toxicity. Proceedings of the National Academy of Sciences of the United States of America. 1985;82:2173–2177. doi: 10.1073/pnas.82.7.2173. [DOI] [PMC free article] [PubMed] [Google Scholar]
- Karunakaran S, Ravindranath V. Activation of p38 MAPK in the substantia nigra leads to nuclear translocation of NF-kappaB in MPTP-treated mice: implication in Parkinson's disease. Journal of neurochemistry. 2009;109:1791–1799. doi: 10.1111/j.1471-4159.2009.06112.x. [DOI] [PubMed] [Google Scholar]
- Korner M, Rattner A, Mauxion F, Sen R, Citri Y. A brain-specific transcription activator. Neuron. 1989;3:563–572. doi: 10.1016/0896-6273(89)90266-3. [DOI] [PubMed] [Google Scholar]
- Lee B, Cao R, Choi YS, Cho HY, Rhee AD, Hah CK, Hoyt KR, Obrietan K. The CREB/CRE transcriptional pathway: protection against oxidative stress-mediated neuronal cell death. Journal of neurochemistry. 2009;108:1251–1265. doi: 10.1111/j.1471-4159.2008.05864.x. [DOI] [PMC free article] [PubMed] [Google Scholar]
- Li B, Du T, Li H, Gu L, Zhang H, Huang J, Hertz L, Peng L. Signalling pathways for transactivation by dexmedetomidine of epidermal growth factor receptors in astrocytes and its paracrine effect on neurons. British journal of pharmacology. 2008;154:191–203. doi: 10.1038/bjp.2008.58. [DOI] [PMC free article] [PubMed] [Google Scholar]
- Liu Y, Peter D, Roghani A, Schuldiner S, Prive GG, Eisenberg D, Brecha N, Edwards RH. A cDNA that suppresses MPP+ toxicity encodes a vesicular amine transporter. Cell. 1992;70:539–551. doi: 10.1016/0092-8674(92)90425-c. [DOI] [PubMed] [Google Scholar]
- Lookingland KJ, Moore KE. Functional neuroanatomy of hypothalamic dopaminergic neuroendocrine systems. In: Dunnett SB, Bentivoglio M, Bjorklund A, Hokfelt T, editors. Handbook of chemical neuroanatomy. Elsevier; Amsterdam: 2005. 2005. pp. 433–521. [Google Scholar]
- Lutz AK, Exner N, Fett ME, Schlehe JS, Kloos K, Lammermann K, Brunner B, Kurz-Drexler A, Vogel F, Reichert AS, Bouman L, Vogt-Weisenhorn D, Wurst W, Tatzelt J, Haass C, Winklhofer KF. Loss of parkin or PINK1 function increases Drp1-dependent mitochondrial fragmentation. The Journal of biological chemistry. 2009;284:22938–22951. doi: 10.1074/jbc.M109.035774. [DOI] [PMC free article] [PubMed] [Google Scholar]
- Markey SP, Johannessen JN, Chiueh CC, Burns RS, Herkenham MA. Intraneuronal generation of a pyridinium metabolite may cause drug-induced parkinsonism. Nature. 1984;311:464–467. doi: 10.1038/311464a0. [DOI] [PubMed] [Google Scholar]
- Matzuk MM, Saper CB. Preservation of hypothalamic dopaminergic neurons in Parkinson's disease. Annals of neurology. 1985;18:552–555. doi: 10.1002/ana.410180507. [DOI] [PubMed] [Google Scholar]
- Meredith GE, Rademacher DJ. MPTP mouse models of Parkinson's disease: An update. Journal of Parkinson's Disease. 2011;1(1):19–33. doi: 10.3233/JPD-2011-11023. [DOI] [PMC free article] [PubMed] [Google Scholar]
- Messeguer X, Escudero R, Farre D, Nunez O, Martinez J, Alba MM. PROMO: detection of known transcription regulatory elements using species-tailored searches. Bioinformatics. 2002;18:333–334. doi: 10.1093/bioinformatics/18.2.333. [DOI] [PubMed] [Google Scholar]
- Morgan JI, Curran T. Immediate-early genes: ten years on. Trends in neurosciences. 1995;18:66–67. [PubMed] [Google Scholar]
- Nakabeppu Y, Nathans D. A naturally occurring truncated form of FosB that inhibits Fos/Jun transcriptional activity. Cell. 1991;64:751–759. doi: 10.1016/0092-8674(91)90504-r. [DOI] [PubMed] [Google Scholar]
- Narendra D, Tanaka A, Suen DF, Youle RJ. Parkin is recruited selectively to impaired mitochondria and promotes their autophagy. The Journal of cell biology. 2008;183:795–803. doi: 10.1083/jcb.200809125. [DOI] [PMC free article] [PubMed] [Google Scholar]
- Nestler EJ. Review. Transcriptional mechanisms of addiction: role of DeltaFosB. Philosophical transactions of the Royal Society of London Series B, Biological sciences. 2008;363:3245–3255. doi: 10.1098/rstb.2008.0067. [DOI] [PMC free article] [PubMed] [Google Scholar]
- Nestler EJ, Kelz MB, Chen J. DeltaFosB: a molecular mediator of long-term neural and behavioral plasticity. Brain research. 1999;835:10–17. doi: 10.1016/s0006-8993(98)01191-3. [DOI] [PubMed] [Google Scholar]
- Nishi K. Expression of c-Jun in dopaminergic neurons of the substantia nigra in 1-methyl-4-phenyl-1,2,3,6-tetrahydropyridine (MPTP)-treated mice. Brain research. 1997;771:133–141. doi: 10.1016/s0006-8993(97)00862-7. [DOI] [PubMed] [Google Scholar]
- Nomaru H, Sakumi K, Katogi A, Ohnishi YN, Kajitani K, Tsuchimoto D, Nestler EJ, Nakabeppu Y. Fosb gene products contribute to excitotoxic microglial activation by regulating the expression of complement C5a receptors in microglia. Glia. 2014;62:1284–1298. doi: 10.1002/glia.22680. [DOI] [PMC free article] [PubMed] [Google Scholar]
- Nuytemans K, Theuns J, Cruts M, Van Broeckhoven C. Genetic etiology of Parkinson disease associated with mutations in the SNCA, PARK2, PINK1, PARK7, and LRRK2 genes: a mutation update. Human mutation. 2010;31:763–780. doi: 10.1002/humu.21277. [DOI] [PMC free article] [PubMed] [Google Scholar]
- Park J, Lee G, Chung J. The PINK1-Parkin pathway is involved in the regulation of mitochondrial remodeling process. Biochemical and biophysical research communications. 2009;378:518–523. doi: 10.1016/j.bbrc.2008.11.086. [DOI] [PubMed] [Google Scholar]
- Perez-Otano I, Mandelzys A, Morgan JI. MPTP-Parkinsonism is accompanied by persistent expression of a delta-FosB-like protein in dopaminergic pathways. Brain research Molecular brain research. 1998;53:41–52. doi: 10.1016/s0169-328x(97)00269-6. [DOI] [PubMed] [Google Scholar]
- Perrotti LI, Hadeishi Y, Ulery PG, Barrot M, Monteggia L, Duman RS, Nestler EJ. Induction of deltaFosB in reward-related brain structures after chronic stress. The Journal of neuroscience : the official journal of the Society for Neuroscience. 2004;24:10594–10602. doi: 10.1523/JNEUROSCI.2542-04.2004. [DOI] [PMC free article] [PubMed] [Google Scholar]
- Pitchers KK, Vialou V, Nestler EJ, Laviolette SR, Lehman MN, Coolen LM. Natural and drug rewards act on common neural plasticity mechanisms with DeltaFosB as a key mediator. The Journal of neuroscience : the official journal of the Society for Neuroscience. 2013;33:3434–3442. doi: 10.1523/JNEUROSCI.4881-12.2013. [DOI] [PMC free article] [PubMed] [Google Scholar]
- Poole AC, Thomas RE, Yu S, Vincow ES, Pallanck L. The mitochondrial fusion-promoting factor mitofusin is a substrate of the PINK1/parkin pathway. PloS one. 2010;5:e10054. doi: 10.1371/journal.pone.0010054. [DOI] [PMC free article] [PubMed] [Google Scholar]
- Potashkin JA, Kang UJ, Loomis PA, Jodelka FM, Ding Y, Meredith GE. MPTP administration in mice changes the ratio of splice isoforms of fosB and rgs9. Brain research. 2007;1182:1–10. doi: 10.1016/j.brainres.2007.08.080. [DOI] [PubMed] [Google Scholar]
- Reinhart JF, Diliberto EJ, Viveros OH, Daniels AJ. Subcellular compartmentalization of 1-methyl-4-phenylpyridinium with catecholamines in adrenal medullary chromaffin vesicles may explain the lack of toxicity to adrenal chromaffin cells. Proc. Natl. Acad. Sci. 1987;84(22):8160–8164. doi: 10.1073/pnas.84.22.8160. [DOI] [PMC free article] [PubMed] [Google Scholar]
- Rieker C, Schober A, Bilbao A, Schutz G, Parkitna JR. Ablation of serum response factor in dopaminergic neurons exacerbates susceptibility towards MPTP-induced oxidative stress. The European journal of neuroscience. 2012;35:735–741. doi: 10.1111/j.1460-9568.2012.08003.x. [DOI] [PubMed] [Google Scholar]
- Sun X, Liu J, Crary JF, Malagelada C, Sulzer D, Greene LA, Levy OA. ATF4 protects against neuronal death in cellular Parkinson's disease models by maintaining levels of parkin. The Journal of neuroscience : the official journal of the Society for Neuroscience. 2013;33:2398–2407. doi: 10.1523/JNEUROSCI.2292-12.2013. [DOI] [PMC free article] [PubMed] [Google Scholar]
- Tanaka K, Suzuki T, Chiba T, Shimura H, Hattori N, Mizuno Y. Parkin is linked to the ubiquitin pathway. Journal of molecular medicine. 2001;79:482–494. doi: 10.1007/s001090100242. [DOI] [PubMed] [Google Scholar]
- Ulery PG, Nestler EJ. Regulation of DeltaFosB transcriptional activity by Ser27 phosphorylation. The European journal of neuroscience. 2007;25:224–230. doi: 10.1111/j.1460-9568.2006.05262.x. [DOI] [PubMed] [Google Scholar]
- Ulery PG, Rudenko G, Nestler EJ. Regulation of DeltaFosB stability by phosphorylation. The Journal of neuroscience : the official journal of the Society for Neuroscience. 2006;26:5131–5142. doi: 10.1523/JNEUROSCI.4970-05.2006. [DOI] [PMC free article] [PubMed] [Google Scholar]
- Vialou V, Feng J, Robison AJ, Ku SM, Ferguson D, Scobie KN, Mazei-Robison MS, Mouzon E, Nestler EJ. Serum response factor and cAMP response element binding protein are both required for cocaine induction of DeltaFosB. The Journal of neuroscience : the official journal of the Society for Neuroscience. 2012;32:7577–7584. doi: 10.1523/JNEUROSCI.1381-12.2012. [DOI] [PMC free article] [PubMed] [Google Scholar]
- West AB, Lockhart PJ, O'Farell C, Farrer MJ. Identification of a novel gene linked to parkin via a bi-directional promoter. Journal of Molecular Biology. 2003;326(1):11–19. doi: 10.1016/s0022-2836(02)01376-1. [DOI] [PubMed] [Google Scholar]
- Zachariou V, Bolanos CA, Selley DE, Theobald D, Cassidy MP, Kelz MB, Shaw-Lutchman T, Berton O, Sim-Selley LJ, Dileone RJ, Kumar A, Nestler EJ. An essential role for DeltaFosB in the nucleus accumbens in morphine action. Nature neuroscience. 2006;9:205–211. doi: 10.1038/nn1636. [DOI] [PubMed] [Google Scholar]
Associated Data
This section collects any data citations, data availability statements, or supplementary materials included in this article.


