Abstract
Functional motions of 15N-labeled proteins can be monitored by solution NMR spin relaxation experiments over a broad range of timescales. These experiments however typically take of the order of several days to a week per protein. Recently, NMR chemical exchange saturation transfer (CEST) experiments have emerged to probe slow millisecond motions complementing R1ρ and CPMG-type experiments. CEST also simultaneously reports on site-specific R1 and R2 parameters. It is shown here how CEST-derived R1, R2 relaxation parameters can be measured within few hours at an accuracy comparable to traditional relaxation experiments. Using a “lean” version of the model-free approach S2 order parameters can be determined that match those from the standard model-free approach applied to 15N R1, R2, and {1H}-15N NOE data. The new methodology, which is demonstrated for ubiquitin and arginine kinase (42 kDa), should serve as an effective screening tool of protein dynamics from ps to ms timescales.
Keywords: NMR spin relaxation, CEST, ps-ns protein dynamics, lean model-free analysis
Graphical Abstract
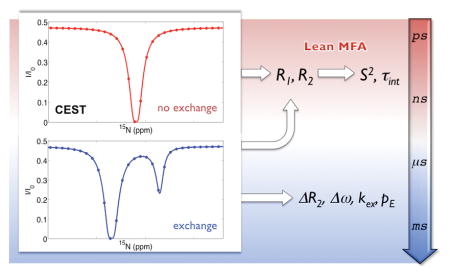
An integrated protocol is presented for the rapid measurement of longitudinal and transverse spin relaxation parameters of proteins using Chemical Exchange Saturation Transfer (CEST) experiments, suitable for quantitative interpretation by a lean model-free approach (L-MFA).

The recent emergence of CEST[1] and Dark-state Exchange Saturation Transfer (DEST) experiments[2] permit the sensitive detection of lowly populated, slowly interconverting conformational substates of proteins, thereby complementing well-established R1ρ[3] and CPMG experiments.[4] CEST reports on the presence of such ‘excited’ protein states indirectly by measuring the signal of a ground-state resonance in the presence of a variable-offset radio-frequency (rf) B1 saturation field. When the B1 field is applied at the frequency of the excited state resonance, saturation is transferred to the ground state via the exchange process(es), which is manifested as a dip in the CEST intensity profile from which kinetic rates (kab + kba = kex) together with the population of the excited state (pb) and its chemical shift can be extracted. In addition to these slow exchange processes, CEST profiles also reflect longitudinal R1 and transverse R2 relaxation rates of the protein ground state, providing a potentially alternative source of these parameters for quantitative studies of nano- and picosecond dynamics. These parameters do not only characterize dynamic loop regions, which are often involved in protein-protein interfaces,[5] but they also represent unique reporters of the conformational entropy at atomic resolution providing unique insights into this driving force of molecular function.[6] However, it is unclear whether CEST-derived 15N R1 and R2 values can be determined as accurately and precisely as those obtained from traditional relaxation experiments, which has important consequences for their interpretation in terms protein dynamics.
Information about fast timescale dynamics can be extracted from 15N R1, R2 and {1H}-15N NOE data by the model-free approach (MFA)[7] with various software packages available.[8] The general goal of MFA is to extract a S2 order parameter for each 15N site, which is a measure for the motional restriction of the N-H bond vector in the molecular frame, along with an internal motional correlation time τint. Extended variants of the model-free analysis exist,[9] but in practice the extended model-free approach is often equivalent to MFA.[10]
Here, we explore the exclusive use of CEST-derived R1, R2 data for their interpretation by MFA. Since CEST does not report about the {1H}-15N NOE, and by avoiding a separate NOE experiment due to its time-consuming nature, R1, R2 are interpreted by a lean version of the model-free approach, referred to as L-MFA. The performance of L-MFA is rigorously tested by comparison with MFA using simulated relaxation parameter sets derived from 10 extended protein molecular dynamics simulations. With CEST-derived relaxation rates serving as input for L-MFA fitting to extract S2 order parameters, an integrated protocol is established that aims at the rapid characterization of protein dynamics on the picosecond to nanosecond timescale, while simultaneously gaining insight into millisecond motions, solely based on a single CEST profile.
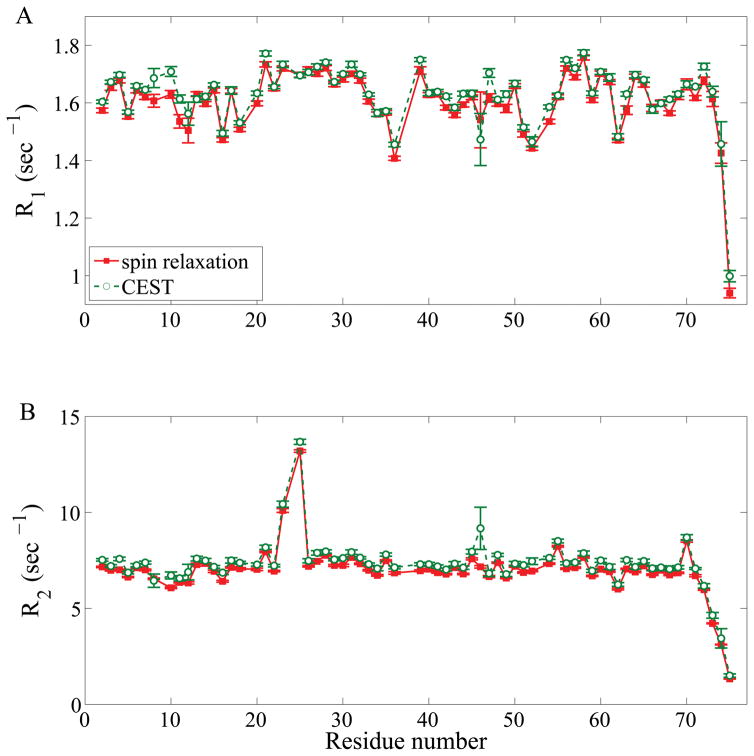
To assess the quality of CEST-derived relaxation parameters, R1, R2 data from CEST were compared with R1, R2 data obtained from standard spin relaxation experiments all measured at 850 MHz magnetic field strength. Figure 1 shows that the data obtained for ubiquitin are in remarkably good agreement with each other with a Pearson’s correlation coefficients of 0.97 and 0.98 and root mean square (RMS) errors of 0.03 (~2%) and 0.40 (~5%) for R1 and R2, respectively. The large R2 rates for residues I23, N25 are consistent with values reported previously for these residues as they undergo dynamic exchange.[11] Similarly good agreement between CEST-derived and traditionally measured R1, R2 parameters were obtained for a protein of substantially larger size, which is the apo state of the 42 kDa arginine kinase (AK, see Supporting Information Figure S1).
Figure 1.
Comparison of experimental relaxation parameters (A) R1 and (B) R2 of ubiquitin derived from CEST (green circles) and standard spin relaxation experiments (red squares) at 850 MHz magnetic field strength. Residue T9 is not shown due to substantial broadening of this peak at pH 7 resulting in a large uncertainty of its relaxation parameters.
When performing CEST experiments, the choice of the strength of the B1 saturating field is important. With larger B1 fields, greater step sizes can be used for the frequency sweep and, hence, fewer B1 points need to be measured, which shortens the duration of the experiment. However, larger B1 fields lead to broadened CEST profiles resulting in lower resolution and lower sensitivity to the presence of exchange processes. If only a single field is to be used, we find that γB1/2π = 100 Hz represents a good compromise. It can be optionally paired with a second B1 field at 25 Hz to more accurately characterize residues experiencing chemical exchange,[12], which is discussed in greater detail in the Supporting Information.
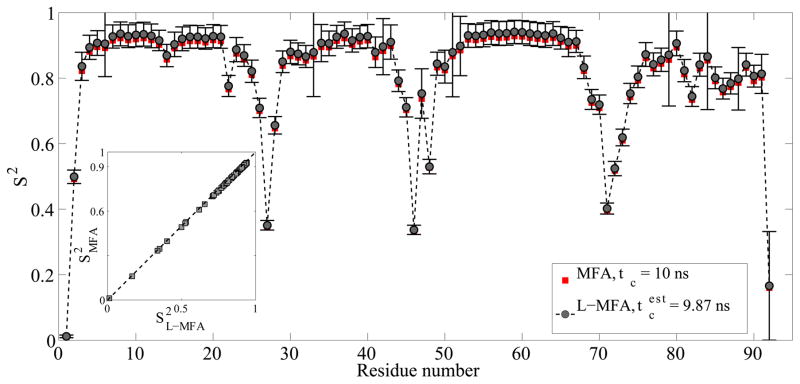
Before analyzing experimental CEST-derived relaxation parameters by L-MFA, we tested the accuracy and stability of the L-MFA approach for the determination of S2 solely based on 15N R1 and R2 relaxation rates. For this purpose, we compared the S2 values computed by L-MFA and MFA for 10 proteins fitted from relaxation parameters derived from 500 ns molecular dynamics (MD) trajectories (see Supporting Information). We find that discarding the heteronuclear {1H}-15N NOEs has only minimal effect on the S2 values. For example, the S2 profiles of the ATPase α-domain (PDB: 1QZM) determined by the two model-free methods are nearly identical (Figure 2 inset). The correlation coefficient between S2L-MFA and S2MFA is 1.00 and the RMS error is 0.012. The optimal τc value estimated from R2/R1 ratios is 9.87 ns compared to the true value of 10.00 ns. This leads to a small, systematic offset of S2L-MFA toward larger values compared to S2MFA. Further analyses were performed for proteins of different size represented by different tumbling correlation times τc of 5 ns, 10 ns, and 15 ns (Figures S3–S12).[13] Isotropic diffusion was chosen for L-MFA as it applies in very good approximation for globular proteins and does not require a high-resolution 3D protein structure. While for some of the most mobile residues the uncertainties in S2, estimated from 30 Monte Carlo simulations assuming 5% errors for R1 and R2, tend to increase, for all systems studied here, the S2 profiles extracted by the two model-free analysis methods (L-MFA and MFA) show a very high level of consistency.
Figure 2.
Comparison of backbone N-H S2 order parameters obtained by L-MFA and MFA model-free analysis of the α-domain of ATPase (PDB 1QZM) based on NMR spin relaxation data computed from a 500 ns MD trajectory assuming a tumbling correlation time τc = 10 ns. An estimated τc = 9.87 ns based on the average R2/R1 ratio of residues in well-defined secondary structures was used for the L-MFA analysis. The inset shows a correlation plot of S2MFA vs. S2L-MFA with different τc values of 10 and 9.87 ns, respectively. The correlation coefficient between S2MFA and S2L-MFA is 1.00 and the RMS error is 0.012.
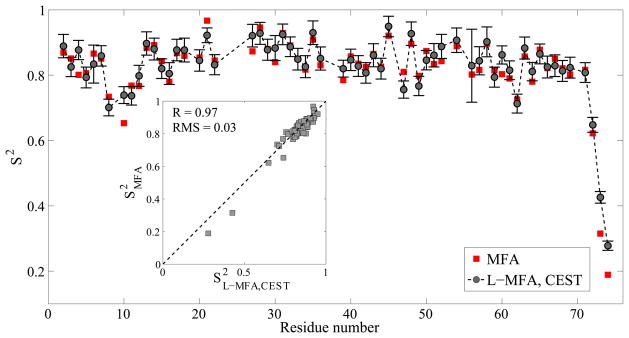
After having been validated by simulations, the L-MFA method was applied to the experimental CEST-derived 15N relaxation parameters for ubiquitin and arginine kinase. In general, S2 values from L-MFA of CEST-derived R1, R2 rates closely match the results from MFA applied to a full set of spin relaxation parameters (Figure 3). For ubiquitin, a high correlation coefficient (R = 0.97) and a small error (RMS = 0.03) between S2L-MFA and S2MFA demonstrates the ability to derive accurate S2 values directly from CEST experiments. Good agreement is also found between S2L-MFA and the previously published S2 profile for protein arginine kinase (see Figure S2).[14] In particular, there is excellent agreement in the V308–V322 loop near the C-terminus, which is by far the most dynamic region of AK on the ps-ns timescale by displaying a consistently low S2 around 0.4 for both sets of experiments. In addition, we evaluated the accuracy with which internal correlation times τint could be extracted by the L-MFA method and found that, while the L-MFA-derived τint values agree quite well with MFA results for ubiquitin (Figure S14), the overall uncertainty in τint is larger. This is because unlike S2 values, typical sub-ns τint values are particularly sensitive to the heteronuclear {1H}-15N NOE, which L-MFA does not use.
Figure 3.
Comparison of experimental ubiquitin order parameters S2MFA determined from R1, R2 and NOE data of standard spin relaxation experiments (red squares) and S2L-MFA determined from CEST-derived R1, R2 values (black circles). The insets show scatter plots for the two types of order parameters.
In summary, our results show that CEST permits the extraction of R1 and R2 relaxation parameters that are equivalent to those determined by traditional methods and they can be analyzed via the L-MFA method for the reliable determination of S2 order parameter profiles. A speed up can also be achieved with traditional NMR relaxation experiments by discarding the heteronuclear NOE experiment and recording R1 and R2 only, followed by L-MFA analysis. However, in this case one would not gain insights into the slow exchange dynamics that CEST offers in addition. Moreover, when exchange is observed in the CEST profile, accurate ground-state R1 and R2 values can be obtained by fitting the exchange contribution (see Supporting Information), whereas this contribution would merely be averaged into the rates determined from traditional spin relaxation experiments. For the proteins studied in this work, the agreement between CEST-derived and traditionally measured R1, R2 relaxation parameters is remarkable considering the highly complementary nature of the two approaches: CEST extracts relaxation information from partially saturated resonances at variable off-resonance frequencies, whereas the traditional method measures exponential magnetization decays. The CEST-based strategy proposed here is promising for efficient routine screening of proteins of dynamics properties and their changes that might be of functional relevance, such as free vs. complexed or wild-type vs. mutant protein states.
Experimental Section
NMR experiments were carried out at 800 MHz (apo-AK) or 850 MHz (ubiquitin) on Avance IIIHD Bruker instruments equipped with TXI (800) or TCI (850) cryoprobes. 15N CEST experiments were performed using the experiments of Vallurupalli, et al. [1c] with B1 field strengths of 30 and 60 Hz, for apo-AK, and 25 and 100 Hz for ubiquitin. The B1 field was swept from 90 to 150 ppm in each of the CEST experiments and acquired in 6 hours (ubiquitin with 100 Hz field) and 39 hours (apo-AK with 30 Hz field). All CEST data was processed with the nmrPipe[15] and intensity profiles analysed using ChemEx[1c] (http://www.github.com/gbouvignies/chemex). 15N spin relaxation experiments were performed on ubiquitin at 850 MHz using HSQC-based experiments[16] with a minor modification for fully protonated samples.[17] The combined acquisition time for R1 and R2 experiments of ubiquitin was 8 hrs. Detailed experimental setups and analysis of all experiments can be found in Supporting Information.
Supplementary Material
Acknowledgments
This work was supported by the National Science Foundation (MCB-1360966) and the NIH (5R01GM077643). All experiments were performed at the CCIC NMR facility at OSU.
Footnotes
Supporting information for this article is given via a link at the end of the document.
References
- 1.(a) Bouvignies G, Kay LE. J Phys Chem B. 2012;116:14311–14317. doi: 10.1021/jp311109u. [DOI] [PubMed] [Google Scholar]; (b) Bouvignies G, Kay LE. J Biomol NMR. 2012;53:303–310. doi: 10.1007/s10858-012-9640-7. [DOI] [PubMed] [Google Scholar]; (c) Vallurupalli P, Bouvignies G, Kay LE. J Am Chem Soc. 2012;134:8148–8161. doi: 10.1021/ja3001419. [DOI] [PubMed] [Google Scholar]; (d) Zhao B, Hansen AL, Zhang Q. J Am Chem Soc. 2014;136:20–23. doi: 10.1021/ja409835y. [DOI] [PMC free article] [PubMed] [Google Scholar]
- 2.(a) Fawzi NL, Ying JF, Ghirlando R, Torchia DA, Clore GM. Nature. 2011;480:268-U161. doi: 10.1038/nature10577. [DOI] [PMC free article] [PubMed] [Google Scholar]; (b) Fawzi NL, Ying JF, Torchia DA, Clore GM. Nat Protoc. 2012;7:1523–1533. doi: 10.1038/nprot.2012.077. [DOI] [PMC free article] [PubMed] [Google Scholar]; (c) Libich DS, Fawzi NL, Ying JF, Clore GM. Proc Natl Acad Sci U S A. 2013;110:11361–11366. doi: 10.1073/pnas.1305715110. [DOI] [PMC free article] [PubMed] [Google Scholar]; (d) Fawzi NL, Libich DS, Ying JF, Tugarinov V, Clore GM. Angew Chem, Int Ed. 2014;53:10345–10349. doi: 10.1002/anie.201405180. [DOI] [PMC free article] [PubMed] [Google Scholar]
- 3.(a) Palmer AG, 3rd, Kroenke CD, Loria JP. Methods Enzymol. 2001;339:204–238. doi: 10.1016/s0076-6879(01)39315-1. [DOI] [PubMed] [Google Scholar]; (b) Mittermaier A, Kay LE. Science. 2006;312:224–228. doi: 10.1126/science.1124964. [DOI] [PubMed] [Google Scholar]; (c) Palmer AG, 3rd, Massi F. Chem Rev. 2006;106:1700–1719. doi: 10.1021/cr0404287. [DOI] [PubMed] [Google Scholar]; (d) Korzhnev DM, Kay LE. Acc Chem Res. 2008;41:442–451. doi: 10.1021/ar700189y. [DOI] [PubMed] [Google Scholar]
- 4.(a) Carr HY, Purcell EM. Phys Rev. 1954;94:630–638. [Google Scholar]; (b) Meiboom S, Gill D. Rev Sci Instrum. 1958;29:688–691. [Google Scholar]; (c) Sauerwein AC, Hansen DF. In: Protein NMR. Berliner L, editor. Vol. 32. Springer US; 2015. pp. 75–132. [Google Scholar]
- 5.Gu Y, Li DW, Brüschweiler R. J Chem Theory Comput. 2015;11:1308–1314. doi: 10.1021/ct501085y. [DOI] [PubMed] [Google Scholar]
- 6.(a) Akke M, Brüschweiler R, Palmer AG., 3rd J Am Chem Soc. 1993;115:9832–9833. [Google Scholar]; (b) Yang D, Kay LE. J Mol Biol. 1996;263:369–382. doi: 10.1006/jmbi.1996.0581. [DOI] [PubMed] [Google Scholar]; (c) Li Z, Raychaudhuri S, Wand AJ. Protein Sci. 1996;5:2647–2650. doi: 10.1002/pro.5560051228. [DOI] [PMC free article] [PubMed] [Google Scholar]
- 7.(a) Lipari G, Szabo A. J Am Chem Soc. 1982;104:4559–4570. [Google Scholar]; (b) Lipari G, Szabo A. J Am Chem Soc. 1982;104:4546–4559. [Google Scholar]
- 8.(a) Mandel AM, Akke M, Palmer AG., 3rd J Mol Biol. 1995;246:144–163. doi: 10.1006/jmbi.1994.0073. [DOI] [PubMed] [Google Scholar]; (b) Dosset P, Hus JC, Blackledge M, Marion D. J Biomol NMR. 2000;16:23–28. doi: 10.1023/a:1008305808620. [DOI] [PubMed] [Google Scholar]; (c) Cole R, Loria JP. J Biomol NMR. 2003;26:203–213. doi: 10.1023/a:1023808801134. [DOI] [PubMed] [Google Scholar]; (d) Bieri M, d’Auvergne EJ, Gooley PR. J Biomol NMR. 2011;50:147–155. doi: 10.1007/s10858-011-9509-1. [DOI] [PubMed] [Google Scholar]
- 9.Clore GM, Szabo A, Bax A, Kay LE, Driscoll PC, Gronenborn AM. J Am Chem Soc. 1990;112:4989–4991. [Google Scholar]
- 10.Jaremko L, Jaremko M, Nowakowski M, Ejchart A. J Phys Chem B. 2015;119:11978–11987. doi: 10.1021/acs.jpcb.5b07181. [DOI] [PubMed] [Google Scholar]
- 11.(a) Tjandra N, Feller SE, Pastor RW, Bax A. J Am Chem Soc. 1995;117:12562–12566. [Google Scholar]; (b) Lienin SF, Bremi T, Brutscher B, Brüschweiler R, Ernst RR. J Am Chem Soc. 1998;120:9870–9879. [Google Scholar]
- 12.(a) Hansen AL, Bouvignies G, Kay LE. J Biomol NMR. 2013;55:279–289. doi: 10.1007/s10858-013-9711-4. [DOI] [PubMed] [Google Scholar]; (b) Carneiro MG, Reddy JG, Griesinger C, Lee D. J Biomol NMR. 2015 doi: 10.1007/s10858-015-9985-9. [DOI] [PubMed] [Google Scholar]
- 13.Gu Y, Li DW, Brüschweiler R. J Chem Theory Comput. 2014;10:2599–2607. doi: 10.1021/ct500181v. [DOI] [PubMed] [Google Scholar]
- 14.Davulcu O, Flynn PF, Chapman MS, Skalicky JJ. Structure. 2009;17:1356–1367. doi: 10.1016/j.str.2009.08.014. [DOI] [PMC free article] [PubMed] [Google Scholar]
- 15.Delaglio F, Grzesiek S, Vuister GW, Zhu G, Pfeifer J, Bax A. J Biomol NMR. 1995;6:277–293. doi: 10.1007/BF00197809. [DOI] [PubMed] [Google Scholar]
- 16.Lakomek NA, Ying J, Bax A. J Biomol NMR. 2012;53:209–221. doi: 10.1007/s10858-012-9626-5. [DOI] [PMC free article] [PubMed] [Google Scholar]
- 17.Gairi M, Dyachenko A, Gonzalez MT, Feliz M, Pons M, Giralt E. J Biomol NMR. 2015;62:209–220. doi: 10.1007/s10858-015-9937-4. [DOI] [PMC free article] [PubMed] [Google Scholar]
Associated Data
This section collects any data citations, data availability statements, or supplementary materials included in this article.


