SUSTAINABILITY SCIENCE Correction for “Temperature-driven global sea-level variability in the Common Era,” by Robert E. Kopp, Andrew C. Kemp, Klaus Bittermann, Benjamin P. Horton, Jeffrey P. Donnelly, W. Roland Gehrels, Carling C. Hay, Jerry X. Mitrovica, Eric D. Morrow, and Stefan Rahmstorf, which appeared in issue 11, March 15, 2016, of Proc Natl Acad Sci USA (113:E1434–E1441; first published February 22, 2016; 10.1073/pnas.1517056113).
The authors wish to note the following: “In the semiempirical hindcasts of 20th century global warming-driven sea-level change, an error occurred when estimating historical sea-level change (H in Fig. 1B; red curves in Fig. S4) from the samples of historical temperature, (red curves in Fig. S4 Insets). The estimate of historical sea-level change (Table 1, row labeled ‘Historical’) is necessary to calculate the fraction of sea-level change not driven by global warming, and so this error also affected the estimates of this fraction (Table 1, rows under the heading ‘Percent of historical’). As described, to generate each , each temperature sample from the proxy-based temperature distribution was replaced after 1900 with a global temperature estimate based on weather station data. The HadCRUT4 global temperature data (not HadCRUT3, as originally stated) were used. These data should have been shifted so as to minimize the misfit between the HadCRUT4 record and each over the period 1850–1900. Unfortunately, a coding error led to an alignment that yielded samples that were 0.06 °C too high after 1900. As a consequence, we note the below changes.
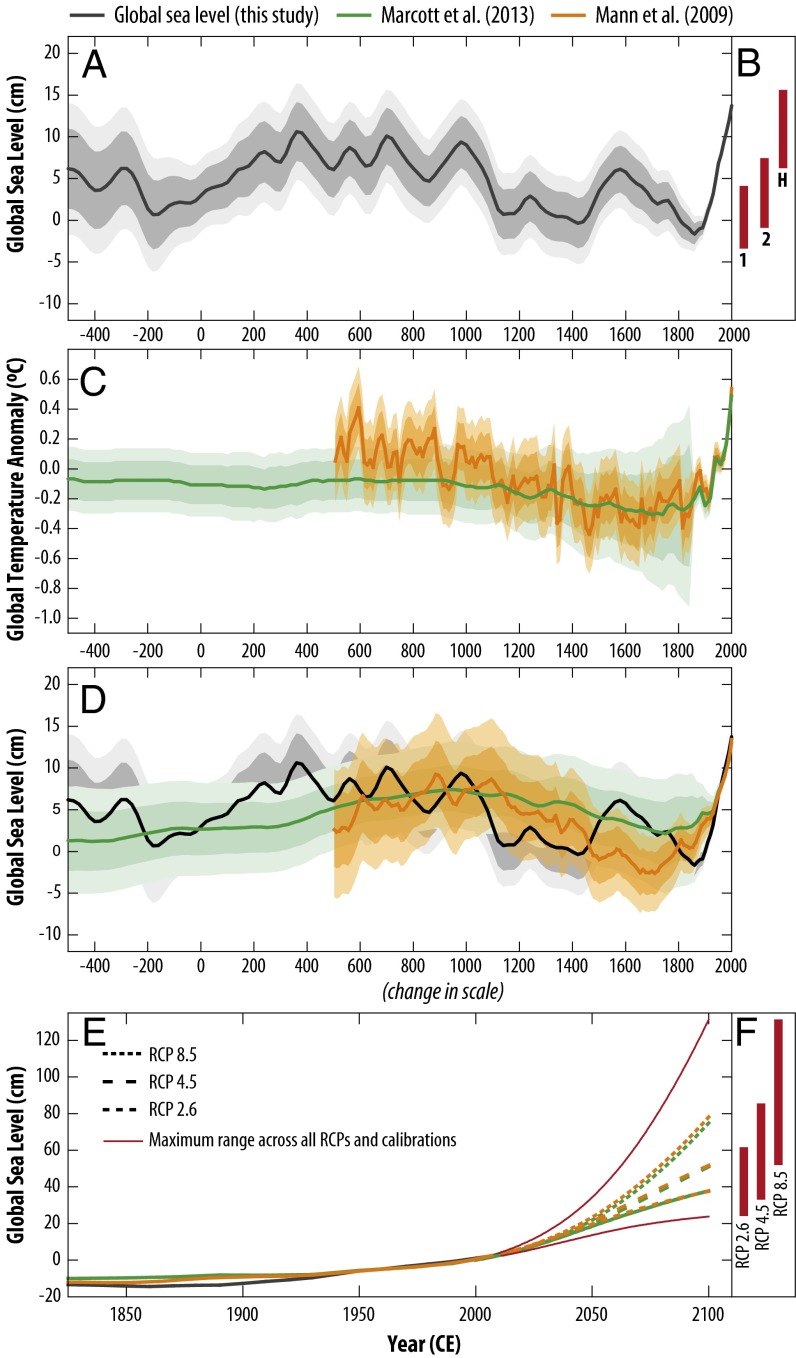
Fig. 1.
(A) Global sea level (GSL) under prior ML2,1. Note that the model is insensitive to small linear trends in GSL over the Common Era, so the relative heights of the 700–1000 CE and 20th century peaks are not comparable. (B) The 90% credible intervals for semiempirical hindcasts of 20th century sea-level change under historical temperatures (H) and counterfactual scenarios 1 and 2, using both temperature calibrations. (C) Two reconstructions of global mean temperature anomalies relative to the 1850–2000 CE mean (1, 2). (D) Semiempirical fits to the GSL curve using the two alternative temperature reconstructions. (E) As in D, including 21st century projections for RCPs 2.6, 4.5, and 8.5. Red lines show the fifth percentile of RCP 2.6 and 95th percentile of RCP 8.5. (F) The 90% credible intervals for 2100 by RCP. In A, B, and D, values are with respect to 1900 CE baseline; in E and F, values are with respect to 2000 CE baseline. Heavy shading, 67% credible; light shading, 90% credible.
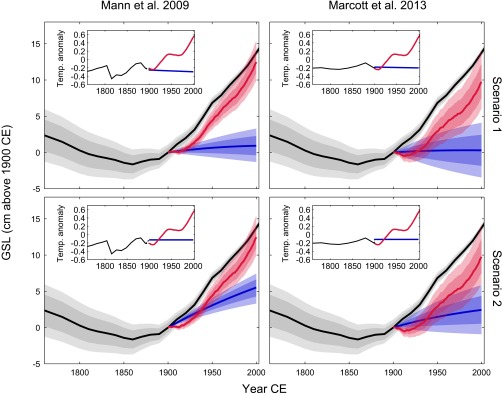
Fig. S4.
Counterfactual hindcasts of global mean sea-level rise in the absence of anthropogenic warming. Each row assumes a different counterfactual temperature scenario (see Materials and Methods), while each column represents model calibration to a different temperature reconstruction (Inset). In the temperature Insets, the black lines represent the original temperature reconstruction to 1900, the red line represents the HadCRUT4 temperature reconstruction for the 20th century, and the blue line represents the counterfactual scenario. In the main plots, the red and blue curves correspond, respectively, to the HadCRUT4 and counterfactual temperature scenarios. The difference between them can be interpreted as the anthropogenic GSL rise. Heavy shading, 67% credible; light shading, 90% credible.
Table 1.
Hindcasts of 20th century GSL rise (centimeters)
| Scenario | Summary | Calibrated to individual temperature reconstructions | ||||
| Mann et al. (1) | Marcott et al. (2) | |||||
| 50th percentile | 5th–95th percentile | 50th percentile | 5th–95th percentile | 50th percentile | 5th–95th percentile | |
| Observed | 13.8 | 12.6–15.0 | ||||
| Historical | 11.1 | 6.0–15.4 | 12.5 | 9.9–15.4 | 9.8 | 6.0–14.2 |
| Scenario 1 | 0.6 | −3.5–4.1 | 0.9 | −1.3–3.3 | 0.3 | −3.5–4.1 |
| Scenario 2 | 4.0 | −0.9–7.5 | 5.5 | 3.3–7.5 | 2.4 | −0.9–5.9 |
| Percent of historical | ||||||
| Scenario 1 | 6 | −32–51 | 8 | −11–26 | 3 | −32–51 |
| Scenario 2 | 35 | −13–59 | 44 | 28–59 | 25 | −13–49 |
All values are with respect to year 1900 CE baseline.
Summary results show means of medians, minima of lower bounds, and maxima of upper bounds taken across both temperature calibrations.
“The initially published version of the paper states that the hindcast 20th century GSL rise, driven by observed temperatures, is ∼13 cm, with a 90% credible interval of 7.7–17.5 cm. The corrected hindcast projection is ∼11 cm, with a 90% credible interval of 6.0–15.4 cm (Table 1, row labeled ‘Historical’). This remains consistent with the observed GSL rise of 13.8 ± 1.5 cm.
“The initially published version of the paper states that, of the hindcast 20th century GSL rise, it is very likely (P = 0.90) that −27% to 41% of the total (scenario 1) or −10% to 51% of the total (scenario 2) would have occurred in the absence of anthropogenic warming. The corrected values are −32% to 51% (scenario 1) and −13% to 59% (scenario 2) (Table 1, rows under the heading ‘Percent of historical’).
“The initially published version of the paper states that, under all calibrations and scenarios, it is likely (P > 0.83) that observed 20th century GSL rise exceeded the nonanthropogenic counterfactuals by 1940 CE and extremely likely (P ≥ 0.95) that it had done so by 1950 CE. In the corrected results, it is likely (P > 0.88) that the observed 20th century GSL rise exceeded the nonanthropogenic counterfactuals by 1950 CE and extremely likely (P ≥ 0.95) that it had done so by 1970 CE (Dataset S1, h).”
The authors also note that on page E1439, left column, Eq. 10, line 3, should instead appear as .
The corrected Table 1, Fig. 1, and its corresponding legend appear below. In the online Supporting Information, Dataset S1, Fig. S4, and its corresponding legend have been corrected and updated.


