Significance
Degeneration of the corticostriatal circuit is a key neuropathological and clinical feature of Huntington’s disease (HD). To define disease mechanisms and explore treatments, we recreated the corticostriatal circuit in microfluidic chambers using neurons from the BACHD mouse model of HD and WT controls. We showed that expression of mutant huntingtin (mHTT) induced defects in brain-derived neurotrophic factor (BDNF) transport in BACHD cortical axons that resulted in atrophy of striatal target neurons. Introducing subunits of the cytosolic chaperonin T-complex 1 (TCP-1) ring complex (TRiC) into BACHD cortical neurons reduced mHTT, rescued defects in BDNF transport, and normalized the size of striatal neurons. These findings encourage studies to explore a role for TRiC reagents as possible treatments for HD.
Keywords: Huntington’s disease, striatal atrophy, BDNF transport, TRiC chaperonin, BACHD mouse model
Abstract
Corticostriatal atrophy is a cardinal manifestation of Huntington’s disease (HD). However, the mechanism(s) by which mutant huntingtin (mHTT) protein contributes to the degeneration of the corticostriatal circuit is not well understood. We recreated the corticostriatal circuit in microfluidic chambers, pairing cortical and striatal neurons from the BACHD model of HD and its WT control. There were reduced synaptic connectivity and atrophy of striatal neurons in cultures in which BACHD cortical and striatal neurons were paired. However, these changes were prevented if WT cortical neurons were paired with BACHD striatal neurons; synthesis and release of brain-derived neurotrophic factor (BDNF) from WT cortical axons were responsible. Consistent with these findings, there was a marked reduction in anterograde transport of BDNF in BACHD cortical neurons. Subunits of the cytosolic chaperonin T-complex 1 (TCP-1) ring complex (TRiC or CCT for chaperonin containing TCP-1) have been shown to reduce mHTT levels. Both CCT3 and the apical domain of CCT1 (ApiCCT1) decreased the level of mHTT in BACHD cortical neurons. In cortical axons, they normalized anterograde BDNF transport, restored retrograde BDNF transport, and normalized lysosomal transport. Importantly, treating BACHD cortical neurons with ApiCCT1 prevented BACHD striatal neuronal atrophy by enhancing release of BDNF that subsequently acts through tyrosine receptor kinase B (TrkB) receptor on striatal neurons. Our findings are evidence that TRiC reagent-mediated reductions in mHTT enhanced BDNF delivery to restore the trophic status of BACHD striatal neurons.
Huntington’s disease (HD), a genetically defined progressive neurodegenerative disorder, is characterized by abnormal involuntary movements, cognitive disability, and psychiatric symptoms (1). The pathogenesis of HD is due to an expanded CAG repeat in the huntingtin (HTT) gene, which encodes the protein Htt. Mutant Htt (mHTT) features an increased number of glutamines (Q > 36) near the N terminus. The striking atrophy and loss of striatal medium-sized spiny neurons (MSNs) in the HD brain are accompanied by atrophy of the cortex (2). The mechanisms by which mHTT induces dysfunction and death of neurons are actively explored (3). It has been shown that mHTT has an impact on axonal trafficking and signaling, synaptic function, gene expression, mitochondrial function, calcium homeostasis, and proteostasis (4, 5). Thus, mHTT plays a central role in HD pathogenesis, an assertion fully supported by recent studies in the BACHD model of HD (6).
One productive line of inquiry regarding HD pathogenesis focuses on brain-derived neurotrophic factor (BDNF), which sustains neurons of the corticostriatal circuit (7–10). In the corticostriatal circuit, BDNF is produced in cortical neurons and is transported anterogradely in axons before secretion in striatum. Released BDNF binds to tyrosine receptor kinase B (TrkB) on striatal MSNs, resulting in BDNF-mediated signaling. Because MSNs do not produce BDNF, they are largely dependent on cortical neurons for its supply (11). BDNF released in striatum also binds to TrkB receptors on cortical axons to allow for retrograde signaling to cortical neurons (12). Deficits in BDNF expression, trafficking, and signaling have been implicated in HD (12): (i) expression and trafficking of BDNF and its TrkB receptor are altered in human HD tissue and HD mouse models (8, 13), (ii) reducing BDNF expression replicates changes in gene expression characteristic of HD in mice (14), (iii) reducing cortical expression of BDNF leads to earlier onset and more rapid progression of pathology in HD mice (15), and (iv) overexpressing BDNF rescues changes in neuron structure and function in HD model mice (8, 10).
Our approach focused on T-complex 1 (TCP-1) ring complex (TRiC), a cytosolic chaperonin (16, 17) that participates in folding ∼10% of the cellular proteome (18, 19). It also supports degradation of misfolded proteins through the proteasome and the autophagosome/lysosome pathways. Importantly, mHTT is a substrate for TRiC and its cochaperones (20–22). Overexpressing TRiC markedly reduced mHTT and prevented its toxicity in yeast, Drosophila, neuroblastoma cells, and brain (20, 22–24). TRiC forms a barrel-shaped structure composed of two identical rings, each with eight different but similar protein subunits [i.e., chaperonin containing TCP-1 (CCT)1 to CCT8] (25). Interestingly, overexpression of a single subunit, CCT1, reduced mHTT toxicity in mammalian cells (20). More remarkable, following exogenous delivery, the substrate-binding apical domain of CCT1, ApiCCT1, entered the cytosol and nucleus of cells and suppressed mHTT aggregation (26). In addition, cryoelectron tomography uncovered that another individual subunit, CCT5, caps fibrils and encapsulates oligomers to inhibit mHTT aggregation (27).
In the present study, we recapitulated the HD corticostriatal circuit using microfluidic chamber cocultures and explored the possibility that TRiC and TRiC-related reagents may provide a means to target HD pathogenesis. In cultures that paired BACHD (28) cortical neurons with BACHD striatal neurons, there was reduced synaptic connectivity and atrophy of striatal neurons. Correlated with these changes, BACHD cortical neurons were deficient in anterograde transport of BDNF in cortical axons. CCT3 or ApiCCT1 normalized axonal anterograde BDNF transport in cortical axons. Significantly, ApiCCT1 treatment prevented BACHD striatal atrophy through BDNF release and activation of its TrkB receptors. Our findings suggest that by targeting mHTT for degradation, TRiC and TRiC-related reagents may constitute a novel approach to treat HD.
Results
Corticostriatal Atrophy in HD Was Recapitulated in Microfluidic Chambers.
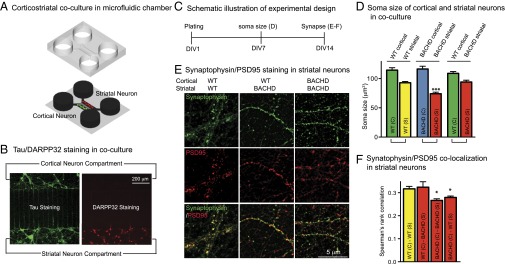
Although dysregulation of BDNF trafficking and signaling contributes to neurodegeneration in HD (12, 29), the underlying cellular and molecular events are poorly understood. To explore how mHTT affects BDNF signaling in HD, we used microfluidic chambers to recreate the vulnerable corticostriatal circuit (Fig. 1 A and B).
Fig. 1.
Striatal neuron atrophy and reduced synaptic connectivity in HD are recapitulated in corticostriatal microfluidic chambers of BACHD neurons. (A) Schematic drawing of corticostriatal coculture plated in the microfluidic chamber. (B) Tau (green) and DARPP32 (red) staining in the corticostriatal coculture. (C) Experimental time course. (D) Analysis of soma sizes of cortical and striatal neurons in WT-WT, BACHD-BACHD, and WT-BACHD cocultures. Results are shown as mean ± SD from two independent chambers with n = 10 fields and a total of 50–100 cells. ***P < 0.001 using Dunnett’s post hoc test of multiple comparisons to the WT-WT striatal soma size. (E) Synaptophysin (green) and PSD95 (red) staining in the striatal compartment. (F) Comparison of pre- and postsynaptic marker colocalization using Spearman’s rank correlation. Results are shown as mean ± SD from two independent chambers with n = 10 fields and 50–100 cells. *P < 0.05 using Dunnett’s post hoc test of multiple comparisons to the WT-WT group striatal soma size.
We first established that striatal neuron atrophy and reduced synaptic connectivity, well-recognized features of HD (30), were recapitulated in BACHD corticostriatal cultures (Fig. 1C). When cocultured with BACHD cortical neurons, BACHD striatal neurons were significantly smaller (74.14 ± 2.67 μm2) than when WT striatal neurons (92.89 ± 2.25 μm2) were cocultured with WT cortical neurons (Fig. 1D). Remarkably, the size of BACHD striatal neurons was markedly increased when cocultured with WT cortical neurons (94.22 ± 3.02 μm2) (Fig. 1D). Thus, BACHD cortical neurons were deficient in supporting BACHD striatal neurons.
To ask if changes in synaptic connectivity were recapitulated, we set up four cortical-striatal cocultures (WT-WT, WT-BACHD, BACHD-BACHD, and BACHD-WT) and immunostained them for synaptophysin and PSD95 (Pierce) in the striatal chamber at days in vitro (DIV)14 (Fig. 1 C and E). The efficiency of colocalization of synaptophysin and PSD95 was significantly lower in BACHD-BACHD (0.26 ± 0.01) and BACHD-WT (0.27 ± 0.01) than in WT-WT (0.32 ± 0.01) cocultures (Fig. 1F). In WT-BACHD coculture (0.32 ± 0.02), the measure was equivalent to the measure in WT-WT culture (Fig. 1F). Therefore, reduced synaptic connectivity in the BACHD cortical-striatal cocultures was prevented when WT cortical neurons were paired with BACHD striatal neurons.
Anterograde BDNF Transport from Cortical Axons Supported Striatal Neurons.
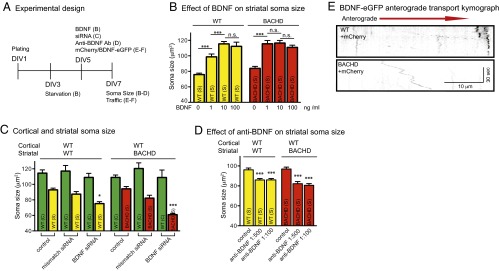
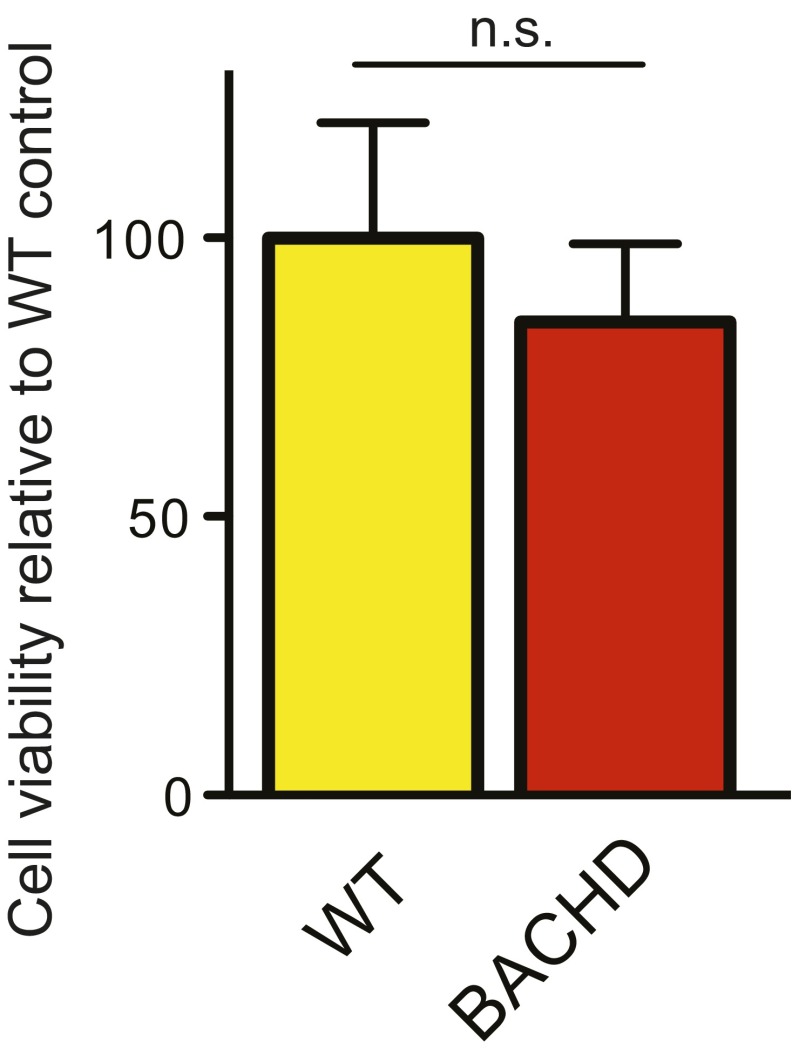
BDNF, provided through anterograde axonal transport in cortical neurons (11, 31), regulates the size of striatal neurons (32). BDNF deficits contribute to HD pathogenesis (31, 33). To ask if the axonal supply of BDNF from BACHD cortical neurons to striatal neurons was deficient, we first assessed BDNF responsivity of WT and BACHD striatal neurons. By frequently changing culture medium, we eliminated a possible autocrine effect of trophic factors secreted by these neurons, including the unlikely possibility that BDNF itself was secreted. Following starvation for 48 h, we assessed responses to BDNF (1–100 ng/mL) for 48 h (Fig. 2A). In the absence of BDNF, the sizes of both WT (75.82 ± 1.86 μm2) and BACHD (83.84 ± 2.56 μm2) striatal neurons were similar to BACHD neurons cocultured with BACHD cortical neurons (Fig. 2B versus Fig. 1D). BDNF treatment at concentrations as low as ∼1 ng/mL markedly increased the soma size for both WT and BACHD neurons (34) (Fig. 2B). In the absence of added BDNF, there was no evident difference in the viability of WT versus BACHD striatal neurons (Fig. S1).
Fig. 2.
Effect of BDNF on the trophic status of BACHD striatal neurons. (A) Experimental time course for studies of soma size and trafficking. (B) Analysis of soma sizes of striatal neurons in WT and BACHD cultures treated with BDNF. Results are shown as mean ± SD from two independent chambers with n = 10 fields and a total of 50–100 cells. Significant differences, ***P < 0.001, were determined by Bonferroni post hoc comparisons of selected pairs. n.s., not significant. (C) Analysis of soma sizes of cortical and striatal neurons in WT-WT and WT-BACHD cocultures with cortical neurons treated with BDNF siRNA or mismatch siRNA. Results are shown as mean ± SD from two independent chambers with n = 10 fields and a total of 50–100 cells. *P < 0.05 and ***P < 0.001 were determined using Dunnett’s post hoc test of multiple comparisons to the WT-WT striatal soma size. (D) Analysis of soma sizes of striatal neurons in WT-WT and WT-BACHD cocultures treated with BDNF antibody in striatal compartment. Results are shown as mean ± SD from two independent chambers with n = 10 fields and a total of 50–100 cells. ***P < 0.001 using Dunnett’s post hoc test of multiple comparisons to the WT-WT group striatal soma size. (E) Representative kymographs of BDNF-eGFP anterograde transport in WT and BACHD cortical neurons expressing mCherry.
Fig. S1.
Cell viability assay in WT and BACHD striatal neurons. No significant difference was detected with Student’s t test. n.s., not significant.
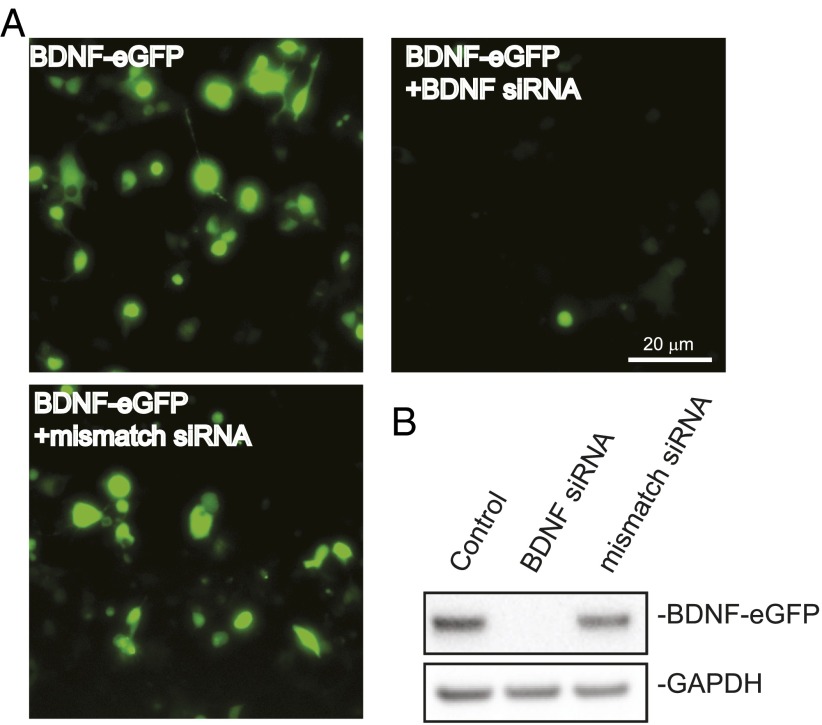
To test a role for cortical neuron BDNF in supporting striatal neurons further, we performed siRNA-mediated knockdown against BDNF in WT cortical neurons. The knockdown efficiency and specificity of the siRNA were confirmed (Fig. S2 A and B). When WT cortical neurons were treated with BDNF siRNA, the average size of WT striatal neurons in the coculture was 75.24 ± 2.45 μm2, a value equivalent to the value in BACHD cocultures (Fig. 2C versus Fig. 1D), and significantly smaller than the WT control (92.89 ± 2.25 μm2). In WT cortical-BACHD striatal neuron coculture, the effect of the BDNF siRNA was even more striking; BACHD striatal neuron size (60.99 ± 1.70 μm2) was even smaller than when cocultured with BACHD cortical neurons (Fig. 2C versus Fig. 1D). The control siRNA had no significant effect on either WT (87.39 ± 3.30 μm2) or BACHD (82.22 ± 3.78 μm2) striatal neuron size (Fig. 2C). We conclude that BDNF synthesis is required for WT cortical neurons to rescue BACHD striatal neurons.
Fig. S2.
BDNF knockdown in 293 cells. (A) Live imaging of 293 cells coexpressing BDNF-eGFP with either the BDNF siRNA or the mismatch siRNA. (B) Twenty-four hours after BDNF knockdown, 293 cells were lysed. Lysates were analyzed by Western blotting and blotted with anti-GFP.
We next tested if BDNF release from cortical axons was required. We applied a mouse monoclonal BDNF neutralizing antibody, BDNF9, (35, 36) at a 1:500 or 1:100 dilution to both the cortical and striatal compartments for 48 h before measuring neuron size (Fig. 2A). In WT-WT cocultures, WT striatal neurons had significantly smaller soma sizes (85.93 ± 1.47 μm2 and 86.03 ± 1.37 μm2 at 1:500 and 1:100, respectively) than nontreated neurons (96.10 ± 1.81 μm2) (Fig. 2D). In WT-BACHD cocultures, the reduction in striatal soma size was 82.20 ± 2.15 μm2 at 1:500 dilution and 80.61 ± 1.70 μm2 at 1:100 dilution, significantly smaller than control cultures (96.94 ± 1.86 μm2) (Fig. 2D). Together with the siRNA knockdown experiments, these results suggest that BDNF released from cortical axons following anterograde axonal transport regulates striatal neuron size (37).
BDNF Anterograde Axonal Transport Was Impaired in BACHD Cortical Neurons.
To determine if BACHD neurons are deficient in anterograde axonal transport of BDNF, we measured transport in microfluidic chambers (38, 39) (Fig. 2A). WT or BACHD cortical neurons at DIV5 were transfected with BDNF-enhanced GFP (eGFP) for 48 h. Axonal transport of BDNF-eGFP was recorded for 120 s (one frame per second). Processive stop-and-go anterograde axonal movement of BDNF-eGFP puncta predominated, but with some retrograde movement and pausing. BDNF-eGFP transport was analyzed in kymographs (Fig. 2E). The instantaneous velocity of BDNF puncta in WT neurons was 1.40 ± 0.24 μm/s, significantly greater than in BACHD neurons (0.97 ± 0.13 μm/s) (Table 1). BDNF puncta that appeared to stall, or switched direction, resulting in a distance traveled <0.2 μm/s, were counted as pauses. Approximately 94% of BDNF puncta in BACHD neurons paused as compared with only ∼30% in WT neurons (Table 1). Although the duration of pausing was not significantly different (Table 1), the decrease in instantaneous speed and more frequent pausing resulted in decreased average velocity in BACHD neurons (0.45 ± 0.15 μm/s) versus 1.18 ± 0.18 μm/s for WT neurons (Table 1). Thus, BDNF anterograde axonal transport was significantly impaired in BACHD cortical axons.
Table 1.
Summary of the BDNF anterograde transport velocities and pause times in mouse cortical neurons
| Parameters | WT | BACHD |
| Instantaneous velocity, μm/s | 1.40 ± 0.24 | 0.97 ± 0.13 |
| P value* | 0.0444 | |
| Percentage of pause events, % | 31 ± 2 | 95 ± 2 |
| P value* | <0.001 | |
| Pause duration, s | 16.1 ± 2.1 | 20.6 ± 2.1 |
| P value* | n.s. | |
| Average velocity, μm/s | 1.18 ± 0.18 | 0.45 ± 0.15 |
| P value* | 0.0033 |
Time-lapse recordings were collected from three independent experiments with 25–30 movies collected and 50–80 BDNF signals recorded (mean ± SEM). Significant differences were determined using Student’s t test. n.s., not significant.
P value is calculated against WT.
TRiC Subunit(s) and ApiCCT1 Reduced mHTT in PC12 Cells and Cortical Neurons.
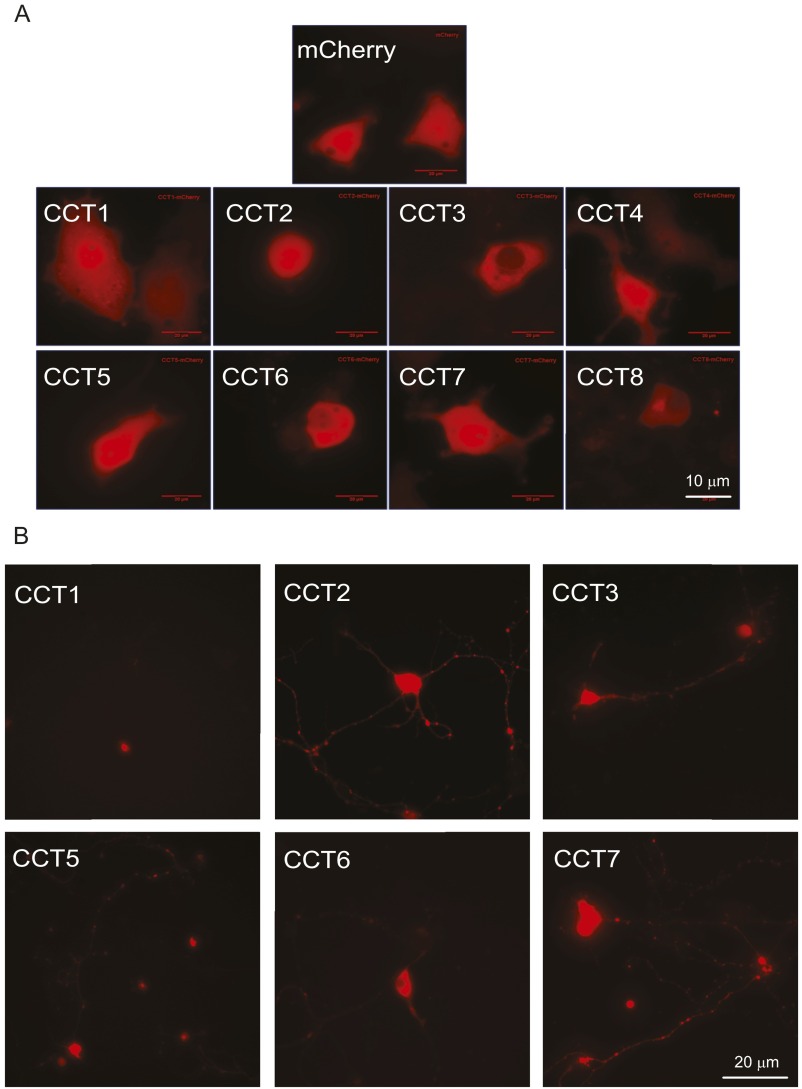
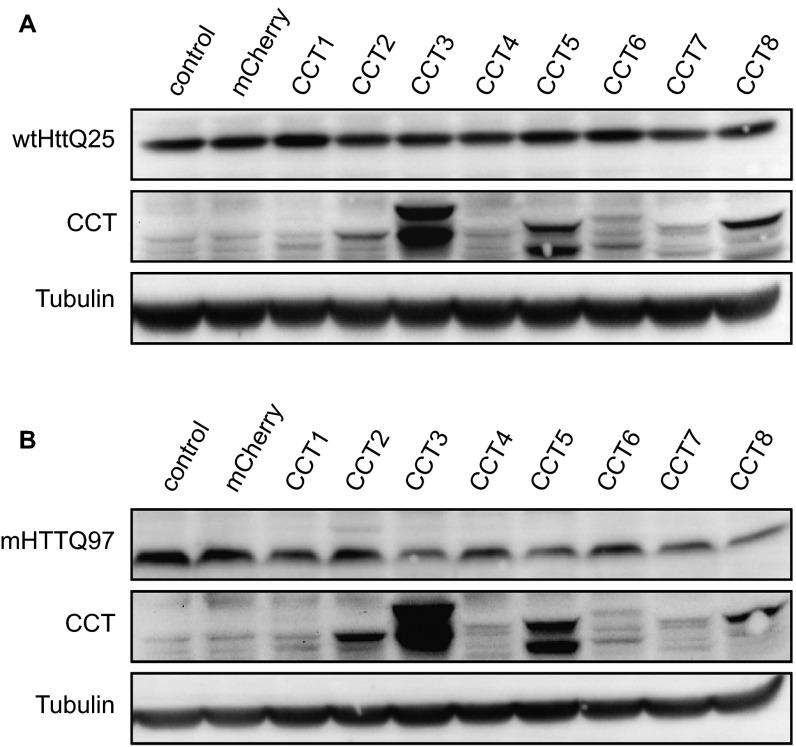
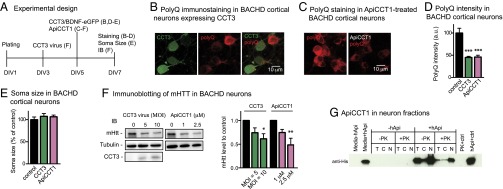
Recent findings have shown individual subunits of TRiC (i.e., CCTs) are able to reduce mHTT in yeast (22) and N2A cells (20). To ask if TRiC subunits or TRiC-derived proteins would engage mHTT in BACHD neurons, we first expressed each of the eight human CCT subunits, C-terminally tagged with mCherry, in PC12 cells as well as in rat embryonic day 18 (E18) cortical neurons. Most CCT subunits showed diffuse red fluorescence in PC12 cells (Fig. S3A), and in neurons, the proteins were detected in both cell bodies and neurites (Fig. S3B). Next, we examined if CCT subunit expression affected the levels of Htt. In PC12 cells, CCT3 and CCT5 levels were robust, with lesser levels detected for the other CCTs (Fig. S4A). Cells cotransfected with wtHttQ25-GFP and individual CCT subunits showed little, if any, effect on wtHttQ25-GFP levels (Fig. S4A). When cotransfected with mHTTQ97-GFP, soluble mHTTQ97-GFP levels were reduced in cells expressing individual CCT subunits, particularly CCT1-, CCT3-, CCT5-, CCT7-, and CCT8-mCherry, but not in cells expressing mCherry alone (Fig. S4B). Thus, expressing individual CCT subunits reduced mHTT in PC12 cells. To test if this effect was also true in primary neurons, due to its robust expression in PC12 cells, we transfected BACHD cortical neurons with CCT3 (Fig. 3A). Forty-eight hours after transfection, we immunostained BACHD neurons with MAB1574 antibody (Millipore), which specifically recognizes mHTT, but not wtHtt (40). In CCT3-expressing BACHD cortical neurons, there was a marked decrease in mHTT signal (44.97 ± 2.55%) compared with nontransfected neurons (Fig. 3 B and D).
Fig. S3.
Single CCT-mCherry subunits were expressed in (A) PC12 cells and (B) rat cortical neurons.
Fig. S4.
Expression of individual CCT subunits decreased mHTT level, but not wtHtt level, in PC12 cells. (A) In PC12 cells, wtHttQ25-GFP was coexpressed with each CCT subunit. The level of wtHttQ25-GFP was not altered by expression of any CCT subunit. (B) In PC12 cells, mHTTQ97-GFP was coexpressed with each CCT subunit. Compared with the mCherry control, the level of mHTTQ97-GFP was reduced by expression of several CCTs, especially CCT1, CCT3, CCT5, CCT7, and CCT8.
Fig. 3.
CCT3 and ApiCCT1 decrease mHTT in BACHD cortical neurons. (A) Experimental time course studies for measuring soma size and intensity of mHTT immunofluorescence. (B) Immunostaining of BACHD cortical neurons overexpressing CCT3 (green) with antipolyglutamine MAB1574 antibody (red). (C) Immunostaining of BACHD cortical neurons treated with ApiCCT1 with antipolyglutamine MAB1574 antibody (red). (D) Analysis of polyglutamine intensity in BACHD neurons expressing CCT3 or treated with ApiCCT1. a.u., arbitrary units. (E) Analysis of cortical neuron soma size in CCT3-treated or ApiCCT1-treated cells versus untreated cells. In D and E, results are shown as mean ± SD from three independent chambers with n = 39 for control cells, n = 33 for CCT3-positive cells, and n = 59 for ApiCCT1-treated cells. ***P < 0.001 using Dunnett’s post hoc test of multiple comparisons to the control groups. (F) Immunoblotting (IB) of mHTT using MAB1574 antibody in BACHD cortical neurons treated with CCT3 lentivirus [multiplicity of infection (MOI) of 5 and 10] and exogenous ApiCCT1 (1 or 2.5 μM). Results are shown as mean ± SD from three independent experiments. *P < 0.05 and **P < 0.01 using Dunnett’s post hoc test of multiple comparisons to the nontreated control group. (G) ApiCCT1 was detected inside primary cortical neuron cytosol and nucleus following PK treatment. Lanes are labeled as follows: C, cytoplasmic fraction; N, nuclear fraction; −PK, no PK treatment; +PK, with PK treatment; PK + ctrl, 60 μg of lysed nuclear fraction treated with PK; T, total lysate. Samples were analyzed by Western blot with anti-His antibody.
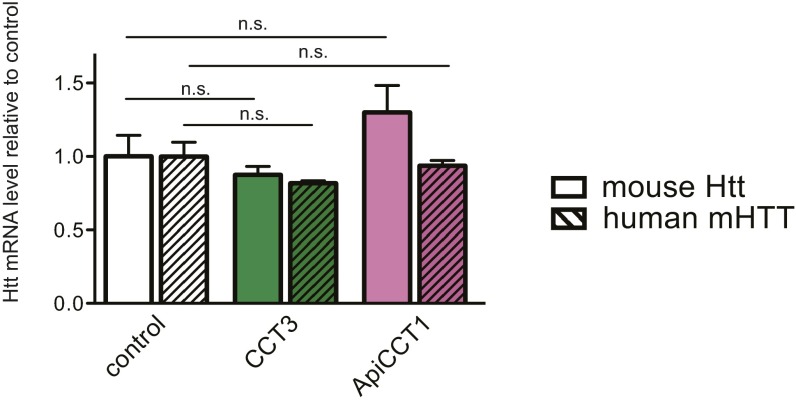
As a potential TRiC reagent, we tested the ∼14-kDa ApiCCT1; this protein entered the cytosolic and nuclear compartments of cells (26) and inhibited mHTT aggregation in vitro (20, 26). BACHD cortical neurons treated with 2.5 μM ApiCCT1 for 48 h showed a marked decrease in mHTT signal in comparison to controls (46.02 ± 4.10%; Fig. 3 A, C, and D); ApiCCT1 treatment had no significant effect on the size of cortical neurons (Fig. 3E). To quantitate mHTT in BACHD cortical neurons, we performed immunoblotting assays with the MAB1574 antibody. The level of mHTT was significantly decreased in neurons treated either with CCT3 lentivirus for 5 d (61.47 ± 21.45%; Fig. 3F) or with 2.5 μM ApiCCT1 for 2 d (48.52 ± 24.64%; Fig. 3F). The responses to both CCT3 and ApiCCT1 were dose-dependent (Fig. 3F), providing evidence that increased delivery of these reagents resulted in increased efficacy in reducing mHTT. In view of the fact that no significant changes were detected in the mRNAs for mouse Htt or human mHTT in BACHD cortical neurons expressing CCT3 or treated with ApiCCT1 (Fig. S5), we conclude that these reagents had an impact on mHTT at the protein level.
Fig. S5.
CCT3 and ApiCCT1 treatments did not change the mRNA levels of either mouse wtHtt or human mHTT. Levels of mRNAs in DIV7 BACHD cortical neurons were assessed using real-time RT-PCR. Relative to untreated cells, no significant changes were observed in neurons expressing CCT3 or treated with ApiCCT1. Results are shown as mean ± SD from three independent experiments. Bonferroni post hoc comparisons of selected pairs were used to test for significance of differences.
To examine if exogenous ApiCCT1 entered primary cortical neurons, mouse cortical neurons were treated with 1 μM ApiCCT1 for 48 h, followed by treatment with proteinase K (PK) to remove cell surface proteins (26). Total extract/lysate (T), cytoplasmic fraction (C), and nuclear fraction (N) were generated and analyzed by immunoblotting (Fig. 3G). As expected, ApiCCT1 was largely eliminated in the total extract by PK treatment. Nevertheless, ApiCCT1 was found in both the cytosolic and nuclear fractions following PK treatment, indicating that exogenous ApiCCT1 gained access to the neuronal cytosol and nucleus.
CCT3 and ApiCCT1 Normalized BDNF Anterograde Transport.
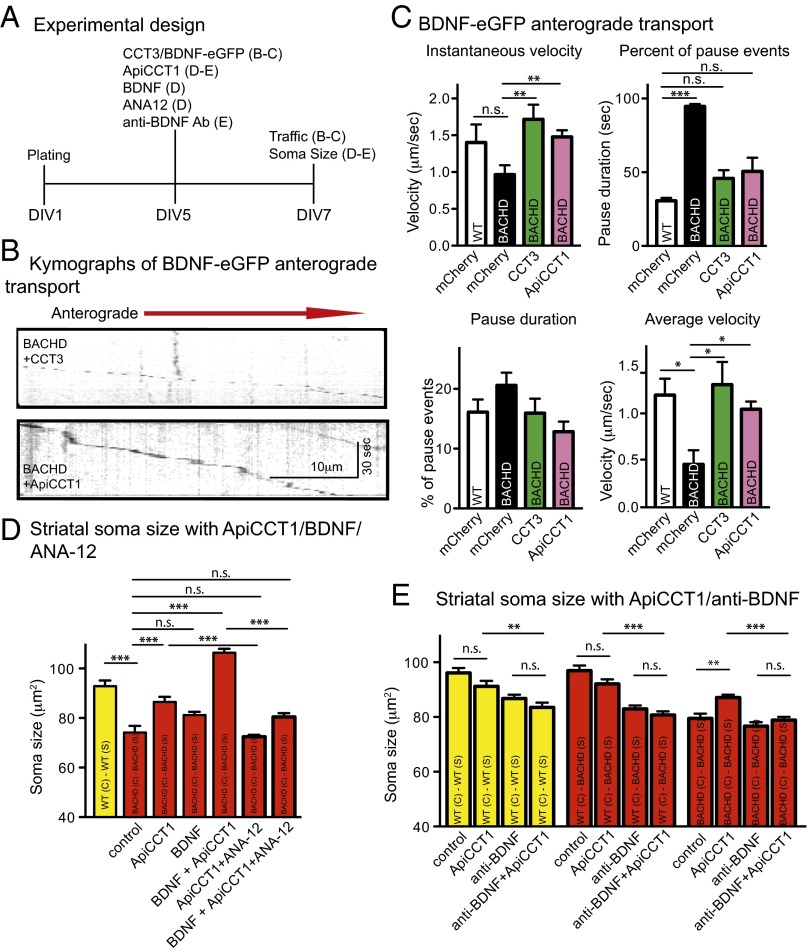
Based on the finding that CCT3 and ApiCCT1 reduced mHTT, we reasoned that these TRiC reagents might reduce deficits in anterograde axonal BDNF transport in BACHD cortical neurons (Fig. 4A). Representative kymographs of CCT3-transfected BACHD neurons showed that BDNF-eGFP transport was similar to transport in WT neurons (Fig. 4B). Most noticeably, there were fewer pauses and a marked decrease in to-and-fro movement (Fig. 2E versus Fig. 4B). These improvements were also seen following ApiCCT1 treatment. In BACHD neurons transfected with mCherry, instantaneous velocity (0.97 ± 0.13 μm/s) was lower than in WT neurons expressing mCherry (1.40 ± 0.24 μm/s); the change was significant by Student’s t test (Table 1), but not by Dunnett’s multiple comparisons test (Fig. 4C). Expressing CCT3 in BACHD neurons resulted in an increase in instantaneous velocity of 1.72 ± 0.20 μm/s, equivalent to WT neurons (Fig. 4C), representing a significant improvement compared with BACHD neurons. Treating BACHD neurons with 2.5 μM ApiCCT1 for 2 d also resulted in a significant increase in instantaneous velocity to 1.47 ± 0.09 μm/s (Fig. 4C). The percentage of pausing events was significantly reduced in CCT3- and ApiCCT1-treated BACHD neurons to levels close to the control (Fig. 4C); CCT3- or ApiCCT1-treated BACHD neurons also exhibited shorter pauses (Fig. 4C). The average velocities of BACHD neurons expressing CCT3 (1.29 ± 0.24 μm/s) or ApiCCT1-treated (1.03 ± 0.08 μm/s) were significantly improved and no longer different from WT neurons (Fig. 4C), suggesting that CCT3 and ApiCCT1 blunted the impact of mHTT on anterograde BDNF transport.
Fig. 4.
Rescue of impaired anterograde transport of BDNF in BACHD cortical neurons by expression of CCT3 or treatment with ApiCCT1. (A) Experimental time course for studies measuring soma size and trafficking. (B) Representative kymographs of BDNF-eGFP anterograde transport in BACHD cortical neurons overexpressing CCT3 or treated with ApiCCT1. (C) Comparison of the anterograde instantaneous velocity, percentage of pause events, pause duration, and average velocity of BDNF-eGFP in WT or BACHD cortical neurons overexpressing mCherry (as a control), overexpressing CCT3-mCherry, or treated with ApiCCT1. Results are shown as mean ± SEM from three independent experiments with 30–40 movies collected and 50–75 BDNF signals recorded. Significant differences, *P < 0.05, **P < 0.01, and ***P < 0.001, were determined by Bonferroni post hoc comparisons of selected pairs. (D) Analysis of soma size of BACHD striatal neurons in BACHD-BACHD coculture when cortical neurons were treated with ApiCCT1, BDNF, or both; also shown are the effects of treatment with 10 μM ANA-12. Results are shown as mean ± SD from two independent chambers with n = 10 fields and total 60–200 cells. ***P < 0.001 using Bonferroni post hoc comparisons of selected pairs. (E) Analysis of some size of striatal neurons in WT-WT, WT-BACHD, and BACHD-BACHD cocultures treated with ApiCCT1, neutralizing BDNF antibody, or both. Results are shown as mean ± SD from two independent chambers with n = 10 fields and a total of 50–120 cells. Significant differences, **P < 0.01 and ***P < 0.001, were determined by Bonferroni post hoc comparisons of selected pairs.
ApiCCT1 Prevented Atrophy of BACHD Striatal Neurons Through BDNF Delivery and TrkB Signaling in Striatal Neurons.
To test if ApiCCT1 effects on anterograde trafficking of BDNF would have an impact on the BACHD corticostriatal circuit, we applied 2.5 μM ApiCCT1 to the cortical compartment as illustrated in Fig. 4A. Fig. 4D shows that BACHD striatal soma size was increased significantly from 74.14 ± 2.67 μm2 to 86.50 ± 2.08 μm2, ∼93% of soma size for WT striatal neurons. Thus, ApiCCT1 largely prevented somal atrophy of BACHD striatal neurons. To ask if increasing BDNF in cortical neurons would also increase the size of striatal neurons, we added exogenous BDNF to the cortical compartment to increase BDNF available through transcytosis and anterograde transport (41). Exogenous BDNF slightly increased soma size to 81.21 ± 1.32 μm2 (Fig. 4D), but the increase was not significant. Remarkably, adding BDNF and ApiCCT1 together appeared to exert a synergistic effect; striatal soma size was increased to 106.4 ± 1.57 μm2, a value even greater than for WT striatal neurons (92.89 ± 2.25 μm2) (Fig. 4D).
To confirm that ApiCCT1 acted to increase BDNF release from cortical axons, we added exogenous ApiCCT1 to the cortical compartment and added the BDNF neutralizing antibody to the striatal compartment (Fig. 4A). Consistent with Fig. 4D, treatment of ApiCCT1 alone rescued the striatal soma deficit in BACHD-BACHD coculture; ApiCCT1 treatment had no significant effect in WT-WT and WT-BACHD cocultures (Fig. 4E). Importantly, in the presence of the anti-BDNF antibody, ApiCCT1 treatment no longer restored striatal soma size in BACHD-BACHD cocultures. As expected, the BDNF antibody alone significantly reduced the size of striatal neuron somas in WT-WT, WT-BACHD, and BACHD-BACHD cocultures, demonstrating again that BDNF release from cortical axons regulates striatal neuron size, as in Fig. 2D. We conclude that ApiCCT1 acted through BDNF release from cortical axons to regulate striatal neuron size.
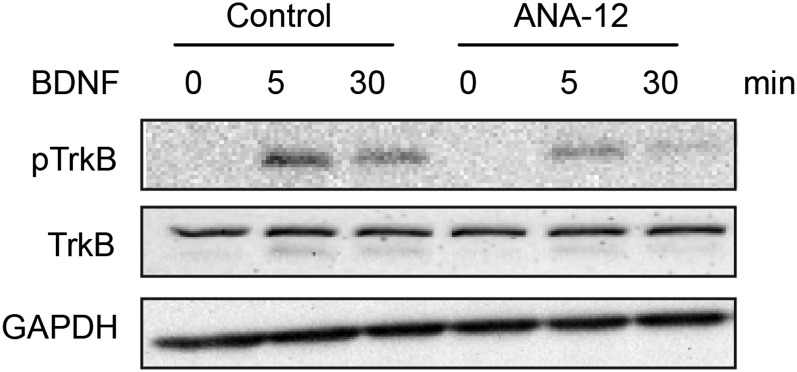
To ask if the effect of ApiCCT1 on striatal soma size was dependent on TrkB-mediated signaling, we applied a TrkB antagonist, ANA-12 (Sigma-Aldrich) (42), in the striatal compartment. Pretreatment with ANA-12 blocked BDNF-induced phosphorylation of pTrkB (Fig. S6). The increase in size due to ApiCCT1, as well as the increase in size due to both ApiCCT1 and BDNF, was abolished in the presence of ANA-12 (72.48 ± 0.77 μm2 and 80.47 ± 1.49 μm2, respectively). Therefore, TRiC reagents acted via BDNF delivery and TrkB-mediated signaling to support the trophic status of striatal neurons.
Fig. S6.
ANA-12 pretreatment in striatal neurons reduced levels of pTrkB. Embryonic day 18 rat striatal neurons were treated with 10 μM ANA-12 at DIV5 for 48 h. The neurons were then treated with 100 ng/mL BDNF for 0, 5, and 30 min. Lysates were generated, and Western blotting was performed with a rabbit antibody that specifically recognizes pY490 on TrkB.
Impaired Retrograde BDNF Transport in BACHD Cortical Neurons Was Improved by CCT3 and ApiCCT1.
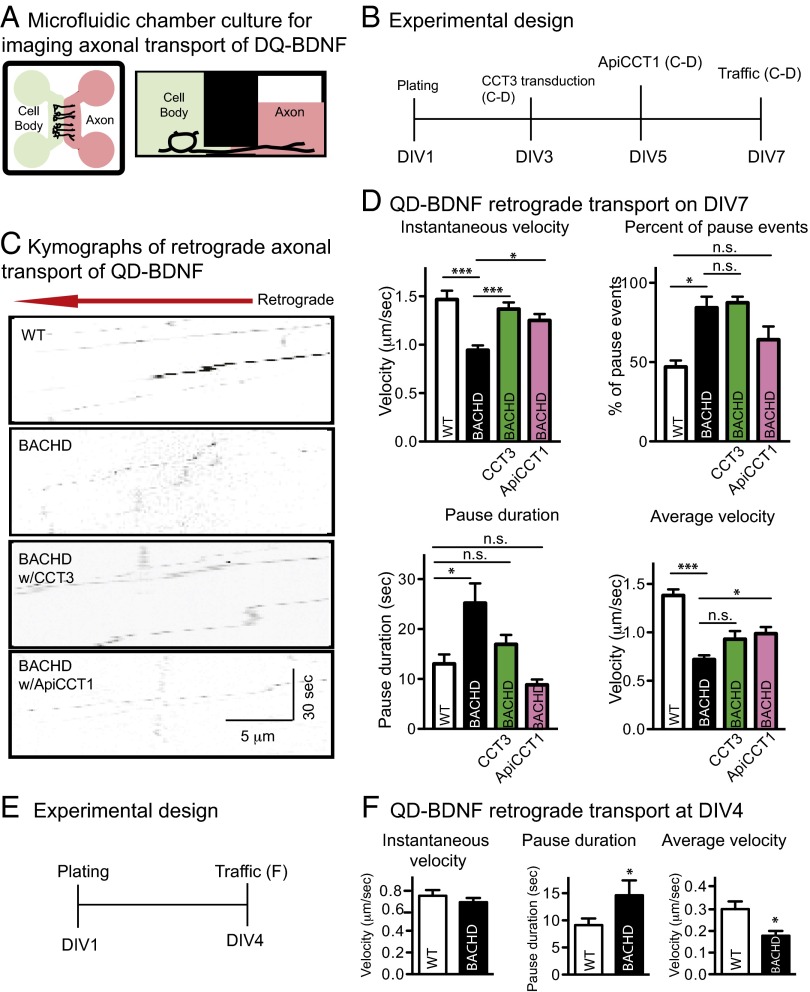
Retrograde axonal transport of BDNF and BDNF signaling plays a key role in regulating the genomic and cellular events that support the interaction of many neurons with their postsynaptic targets (43). BDNF released by cortical axons in striatum binds to TrkB receptors on cortical axons to support retrograde signaling to these neurons (12). We asked if retrograde axonal transport of BDNF was also compromised in BACHD neurons. As depicted in the schematic of the microfluidic chamber (Fig. 5A), WT or BACHD cortical neurons were plated in the cell body compartment. Axons grew into the axonal compartment within 5–7 d. Quantum dot-conjugated BDNF (QD-BDNF) (38) was used to examine BDNF retrograde transport in cortical axons with or without TRiC reagent treatment (38, 39). Representative kymographs are shown (Fig. 5C).
Fig. 5.
Rescue of impaired retrograde transport of BDNF in BACHD cortical neurons by overexpressing CCT3 or treating with ApiCCT1. (A) Schematic drawing showing that neurons loaded in the cell body compartment extended axons into the axon compartment. QD-BDNF was added to the axon compartment. Diffusion of the QD-BDNF to the cell body compartment was minimized by reducing the height of the medium level in the axon compartment. (B) Experimental time course for measuring QD-BDNF retrograde trafficking in DIV7 cortical neurons. (C) Representative kymographs of QD-BDNF retrograde transport in DIV7 cortical neurons from WT, BACHD, BACHD treated with CCT3, and BACHD treated with ApiCCT1. (D) Comparison of the retrograde instantaneous velocity, percentage of pause events, pause duration, and average velocity of QD-BDNF in DIV7 WT or BACHD cortical neurons that overexpressed CCT3, were treated with ApiCCT1, or were not treated. Results are shown as mean ± SEM from three independent experiments with 30–40 movies collected and 40–75 BDNF signals recorded. Significant differences, *P < 0.05 and ***P < 0.001, were determined by Bonferroni post hoc comparisons of selected pairs. (E) Experimental time course for measuring QD-BDNF retrograde trafficking in DIV4 cortical neurons. (F) Comparison of the retrograde instantaneous velocity, pause duration, and average velocity of QD-BDNF in DIV4 WT or BACHD cortical neurons. Results are shown as mean ± SEM from two independent experiments with 25–30 movies collected and 35–50 BDNF signals recorded. *P < 0.05 using Student’s t test.
In BACHD cortical neurons, the mean retrograde instantaneous velocity was 0.94 ± 0.05 μm/s, significantly lower than in WT cortical neurons (1.42 ± 0.08 μm/s) (Fig. 5D). To test if CCT3 or ApiCCT1 would normalize retrograde BDNF transport in BACHD cortical neurons, cells were transduced with a lentivirus encoding CCT3 or were treated with ApiCCT1 (Fig. 5B). Expressing CCT3 in the BACHD neurons resulted in an increase of mean instantaneous velocity to 1.36 ± 0.07 μm/s, a value equivalent to the value in WT neurons (Fig. 5D). When BACHD cortical neurons were pretreated with 2.5 μM ApiCCT1, BDNF instantaneous velocity was increased (1.25 ± 0.07 μm/s) to values equivalent to WT neurons.
Pausing and to-and-fro movement were more common in BACHD than WT neurons, with ∼84% for BACHD compared with ∼46% for WT neurons (Fig. 5D). Relative to BACHD neurons, ApiCCT1-treated BACHD neurons showed less pausing (∼65%), whereas CCT3 had little effect (∼87%). As shown in Fig. 5D, in BACHD neurons, pauses averaged 25.2 ± 3.9 s, a value significantly greater than for WT neurons (13.0 ± 1.9 s). Treatment with CCT3 or ApiCCT1 significantly reduced pausing to 16.9 ± 1.9 s and 8.8 ± 1.1 s, respectively.
The average retrograde velocity in BACHD neurons was 0.72 ± 0.05 μm/s, significantly lower than in WT neurons (1.38 ± 0.06 μm/s) (Fig. 5D). Expressing CCT3 or adding ApiCCT1 increased this measure in BACHD neurons (0.93 ± 0.08 μm/s and 0.98 ± 0.07 μm/s, respectively), but it was less than for WT neurons. Incomplete normalization was due, in large part, to the persistence of pausing in treated neurons. Taken together, the data show that there is impaired BDNF retrograde axonal transport, with more frequent and longer pauses, in BACHD neurons. These defects were partially normalized by expression of CCT3 or treatment with ApiCCT1.
CCT3 Reversed Deficits in Retrograde Transport of BDNF.
To ask if BACHD neurons were deficient in retrograde axonal transport before treatment with CCT3 or ApiCCT1, we used a microfluidic culture system with shorter microgrooves (150 μm) to allow axons to reach the axonal chamber by DIV4 (i.e., 1 d before the time at which treatments were delivered in earlier studies) (Fig. 5E). At DIV4, instantaneous velocity was significantly lower than for axons at DIV7. Fig. 5F shows there was a deficit in the average velocity of retrograde transport in BACHD cortical axons at DIV4. Given the absence of a significant change in instantaneous velocity, the reduction in average velocity was explained by a significant increase in pausing in BACHD axons, as shown in Fig. 5F. The reduction in average velocity in BACHD neurons at DIV7 (∼48%) was greater than at DIV4 (∼33%), suggesting progressive disruption of BDNF transport with time. We conclude that TRiC reagents reversed defects in retrograde transport of BDNF.
Impaired Lysosome Transport in BACHD Cortical Neurons Was Normalized by Expression of CCT3 or CCT5.
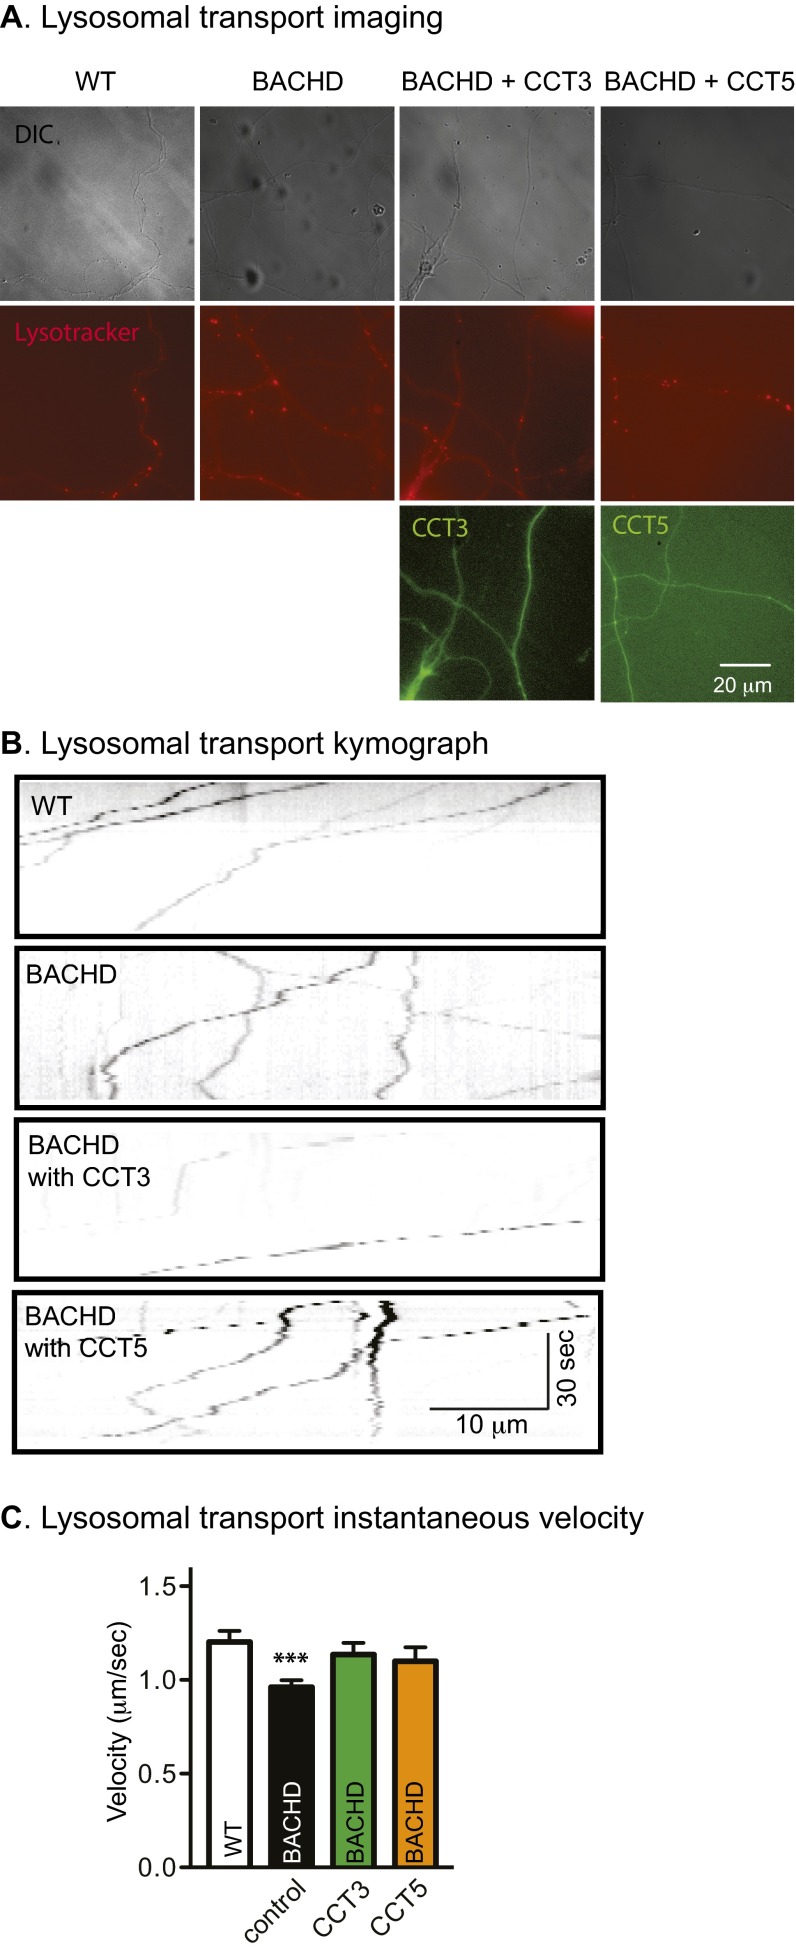
Htt has an important role in regulating dynein-based transport of a number of cargoes (44–48). To understand whether or not axonal trafficking defects in BACHD neurons had an impact on other endocytic cargoes, we examined axonal trafficking of lysosomes in mass cultures of cortical neurons using LysoTracker, which specifically labels lysosomes that appear as red fluorescent puncta (Fig. S7A). Transport was recorded at one frame per second for 60 s. Representative kymographs are shown in Fig. S7B. Lysosomes moved both retrogradely and anterogradely; instantaneous velocities were calculated to include both anterograde and retrograde movements. In WT processes, lysosomes moved processively and largely in one direction. In contrast, in BACHD processes, much more to-and-fro movement with frequent switching of direction was noted. The average velocity for lysosome movement in WT processes was 1.20 ± 0.06 μm/s (Fig. S7C). In BACHD, the same measure was 0.96 ± 0.04 μm/s, significantly slower than in WT neurons. To explore the effect of CCT expression, neurons were transfected with CCT3 in a GFP-containing vector. In BACHD neurons expressing CCT3, the average instantaneous velocity was 1.14 ± 0.06 μm/s, significantly greater than for untreated BACHD processes and not significantly different from WT processes. CCT5 treatment was also effective, but less so than CCT3 treatment (Fig. S7). Therefore, defective trafficking of lysosomes in BACHD neurons was normalized by expressing CCT3 or CCT5.
Fig. S7.
Impaired lysosome transport in BACHD cortical neurons was rescued by expression of CCT3 or CCT5. (A) Live imaging of cortical neurons grown on coverslips that were transfected with CCT3 or CCT5 in a pLenti vector, which carries a GFP signal (green). At 24 h after transfection, LysoTracker (red) was added for 30 min; it was removed by washing before live imaging. (B) Representative kymographs of lysosome movement, showing both retrograde or anterograde transits, from WT, BACHD, and BACHD neurons that express CCT3 or CCT5. (C) Analysis of the instantaneous velocity of lysosomal transport in cortical neurons from WT-, BACHD-, and BACHD-treated CCT3 or CCT5 neurons. Results are shown as mean ± SEM from three independent experiments with 30–40 movies collected and 100–150 BDNF signals recorded. ***P < 0.001 using Dunnett’s post hoc test of multiple comparisons to the WT-WT group.
CCT3 Reduced the Number of Inclusion Bodies and mHTT in 14A2.6 Cells.
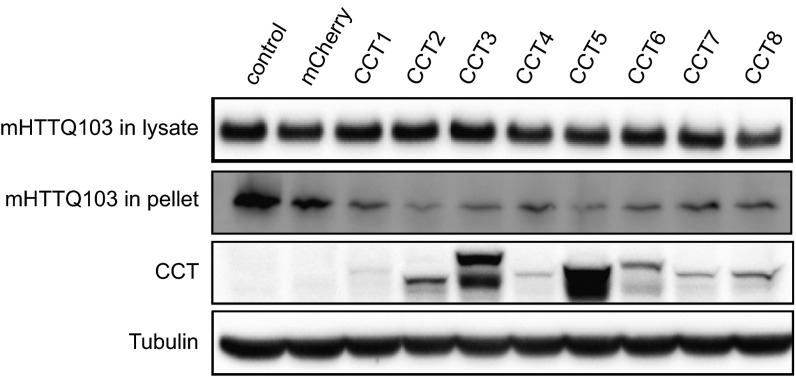
To explore further the impact of CCT3 on mHTT, we turned to 14A2.6 cells, a PC12 cell line that can be induced by ponasterone A (PA) to produce an eGFP-tagged, truncated form of mHTT carrying 103Qs (mHTTQ103-GFP) (49). Expression of each of the CCT subunits in 14A2.6 cells induced significant reductions in the level of insoluble mHTTQ103-GFP, but small changes in the level of the soluble protein (Fig. S8). Remarkably, virtually all of the CCT subunits reduced the insoluble mHTTQ103-GFP.
Fig. S8.
Expression of a single CCT subunit decreases the insoluble mHTT level in 14A2.6 cells. In 14A2.6 cells, mHTTQ103-GFP production was PA-induced after individual CCT subunits were expressed for 48 h. The level of insoluble, but not soluble, mHTTQ103-GFP was decreased.
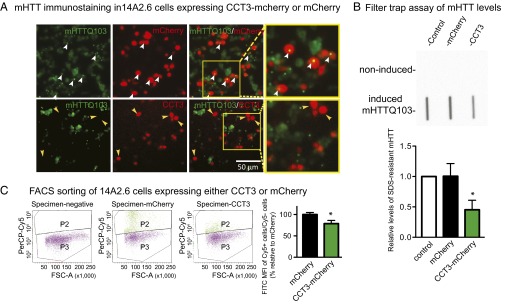
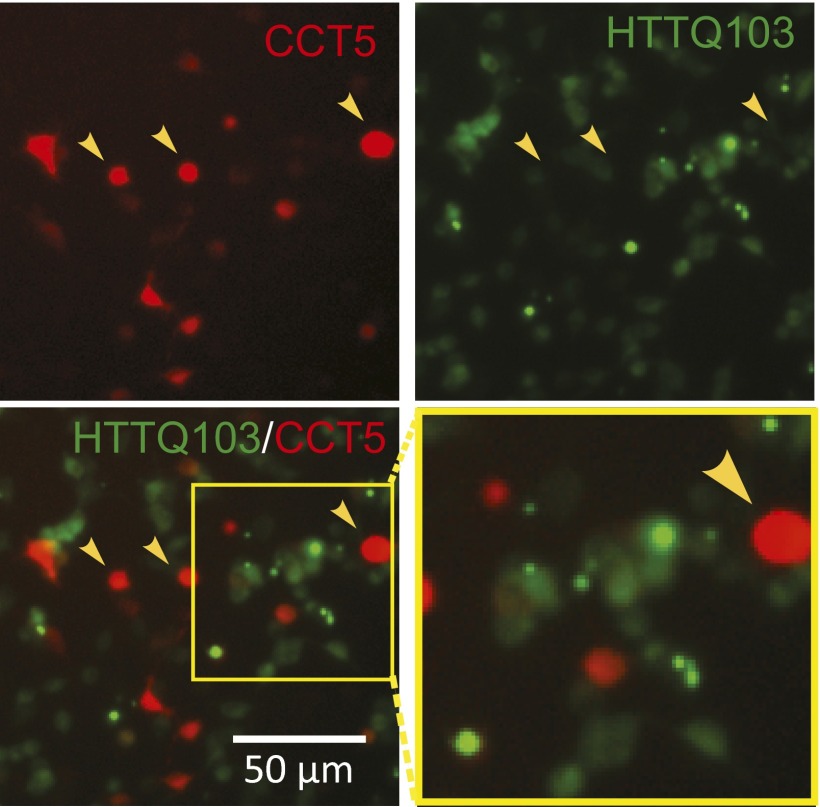
To test if CCT3 had an impact on mHTT aggregation, we expressed CCT3-mCherry for 48 h before induction of mHTTQ103-GFP. In mCherry-expressing cells, there was diffuse green staining, as well as large green puncta (Fig. 6A); the latter marked the presence of mHTTQ103-GFP inclusion bodies (white arrows). They were abundant in mCherry-expressing cells (white arrows); note the overlap of puncta and mCherry signals (Fig. 6A, Upper). In cells expressing CCT3, however, inclusion bodies were much less frequent. CCT3-expressing cells (yellow arrows) are largely devoid of inclusion bodies (Fig. 6A, Lower). CCT5 showed a similar effect (Fig. S9).
Fig. 6.
Expression of CCT3 decreases mHTTQ103 and the number of inclusion bodies in 14A2.6 cells. (A) Live imaging of 14A2.6 cells transfected with CCT3 (red) or mCherry (red) for 48 h and then induced to produce mHTTQ103-GFP (green) using PA. (Upper) White arrows show that mHTTQ103 inclusion bodies were found in the cells that express mCherry. (Lower) Yellow arrows show that many fewer inclusion bodies were present in cells that expressed CCT3. (B) Filter trap assay of SDS-resistant mHTTQ103 aggregates using EM48 antibody in PA-induced 14A2.6 cells that were not transfected, were transfected with mCherry, or were transfected with CCT3. Results are shown as mean ± SD from five independent experiments. *P < 0.05 using Dunnett’s post hoc test of multiple comparisons to the control group. (C) Fluorescence-activated cell sorting (FACS) of 14A2.6 cells that express CCT3-mCherry or mCherry alone. Cells were sorted by fluorescence for Cy5 (due to expression of either mCherry or CCT3-mCherry) and FITC (mHTTQ103-GFP). FSC-A, forward scatter-area; P2, Cy5-positive cells; P3, Cy5-negative cells; PerCP, peridinin-chlorophyll protein. Percentage of FITC mean fluorescence intensity in P2 to P3, normalized by transfection efficiency and expressed relative to the mCherry control. Results are shown as mean ± SD from three independent experiments. *P < 0.05 using Student’s t test.
Fig. S9.
Expression of CCT5 decreased the number of inclusion bodies in 14A2.6 cells. Live imaging of 14A2.6 cells transfected with CCT5 for 48 h and then PA-induced to produce mHTTQ103-GFP is shown. Yellow arrows show that fewer inclusion bodies were present in cells that expressed CCT5.
Next, we quantitated the levels of SDS-resistant Htt inclusion using a filter trap assay. Fig. 6B shows that after induction with PA for 24 h, insoluble mHTTQ103-GFP, as detected with the EM48 antibody (50), was present in the cell lysate (Fig. 6B, Lower); noninduced samples showed no mHTT immunostaining (Fig. 6B, Upper). In cells expressing CCT3, insoluble mHTT-GFP was less than in nontransfected or mCherry-transfected cells (P < 0.05) (Fig. 6B). CCT3 expression thus significantly reduced SDS-insoluble mHTT aggregates.
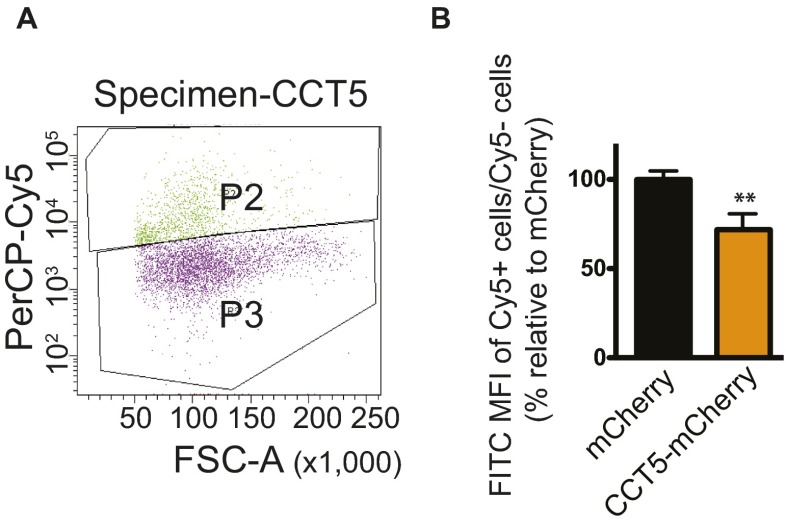
To measure the overall mHTT level in CCT3- or mCherry-expressing cells, transfected 14A2.6 cells were analyzed by fluorescence-activated cell sorting. Cells transfected with CCT3-mCherry or mCherry were induced to produce mHTTQ103-GFP and sorted into two bins: P2 (Cy5-positive, due to either mCherry or CCT3) and P3 (Cy5-negative, nontransfected) (Fig. 6C). The FITC mean fluorescence intensity of P2/P3 represents the intensity of mHTTQ103-GFP as a corrected for transfection efficiency. In CCT3-expressing cells, the mHTTQ103-GFP signal was reduced significantly to 78.8 ± 0.07% of the mCherry control (Fig. 6C). A similar result was found in CCT5-expressing cells, where the mHTT level was reduced to 71.8 ± 0.07% (Fig. S10 A and B). Therefore, CCT3 and CCT5 reduced the overall level of mHTTQ103-GFP in 14A2.6 cells.
Fig. S10.
Expression of CCT5 decreases mHTTQ103 level in 14A2.6 cells. (A) FACS of 14A2.6 cells that expressed CCT5-mCherry. Cells were sorted by fluorescence for Cy5 (due to expression of either mCherry or CCT5-mCherry) and FITC (mHTTQ103-GFP). FSC-A, forward scatter-area; P2, Cy5-positive cells; P3, Cy5-negative cells; PerCP, peridinin-chlorophyll proteins. (B) Percentage of FITC mean fluorescence intensity (MFI) in P2 to P3, normalized by transfection efficiency and expressed relative to the mCherry control. Results are shown as mean ± SD from three independent experiments. **P < 0.01 using Student’s t test.
CCT Subunits Enhanced Degradation of mHTT via the Proteasome.
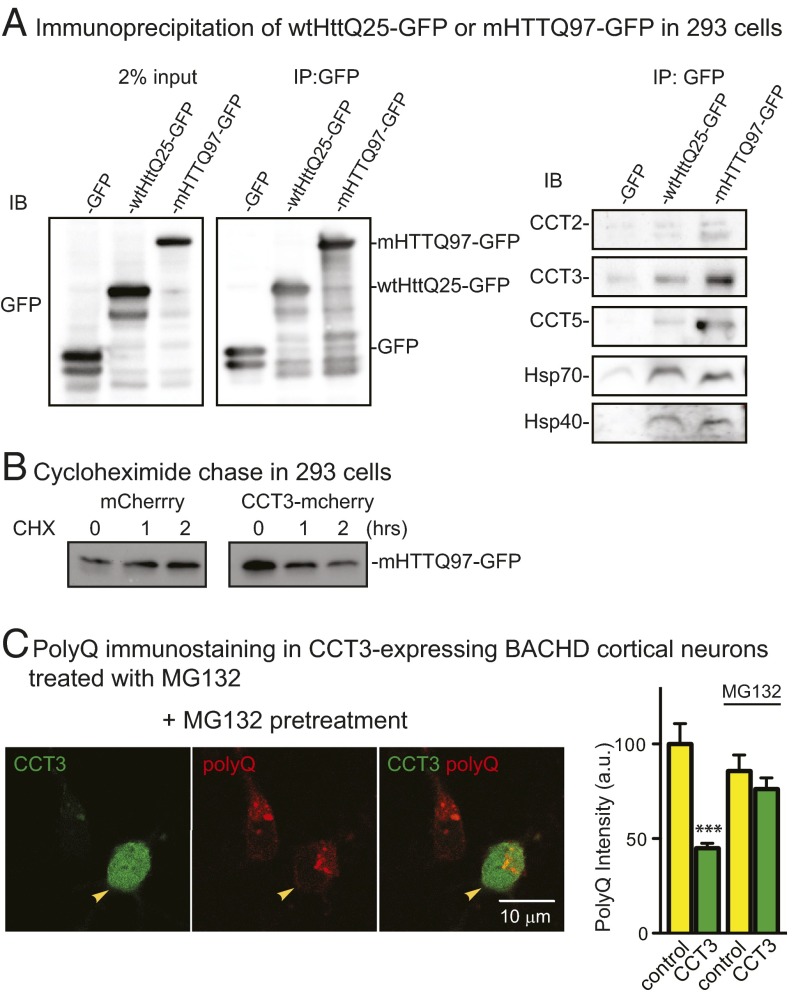
We used immunoprecipitation to test if Htt interacted with TRiC subunits using 293 cells expressing wtHttQ25-GFP, mHTTQ97-GFP, or GFP (Fig. 7A). Both wtHttQ25-GFP and mHTTQ97-GFP interacted with TRiC subunits; in particular, we detected CCT2, CCT3, and CCT5 as well as Hsp70 and Hsp40. There was relatively more CCT2, CCT3, and CCT5 bound to mHTTQ97-GFP.
Fig. 7.
Coimmunoprecipitation of Htt with CCT subunit(s) and the effect of proteasome inhibitor MG132 on mHTT degradation. (A) Immunoprecipitation (IP) of GFP in GFP-, wtHttQ25-GFP–, or mHTTQ97-GFP–transfected 293 cells showed that wtHttQ25 and mHTTQ97 interacted with at least several CCT subunits, Hsp70, and Hsp40. (B) The 293 cells were transfected with CCT3-mCherry or mCherry for 48 h; cycloheximide (CHX) was added for 0, 1, or 2 h. Cell lysates were collected and resolved on SDS/PAGE. (C) Immunostaining with antipolyglutamine antibody MAB1574 (red) of MG132-treated BACHD cortical neurons overexpressing CCT3 (green). Results are mean ± SD from two independent experiments with n = 38 for CCT3-positive cells, and n = 26 for CCT3-negative cells; comparison is with data (first two bars) shown in Fig. 3D. ***P < 0.001 using Dunnett’s post hoc test of multiple comparisons to the control group without MG132.
Next, we asked whether the CCT3 subunit promoted mHTT degradation. We monitored the level of mHTTQ97-GFP in 293 cells expressing either CCT3-mCherry or mCherry alone. Following cycloheximide treatment to inhibit protein synthesis, mHTTQ97-GFP decreased as early as 1 h in cells expressing CCT3-mCherry, whereas mCherry had no effect (Fig. 7B). Thus, CCT3 expression enhanced degradation of mHTTQ97-GFP. To characterize the mechanism, the proteasome inhibitor MG132 was used to treat BACHD neurons that expressed CCT3-mCherry. PolyQ staining of mHTT with MAB1574 was used to quantitate mHTT levels. Expression of CCT3-mCherry resulted in a decrease in mHTT (44.97 ± 2.55%) (Fig. 3 B and D). The impact of CCT3-mCherry was significantly blocked by MG132; the level of mHTT was 76.25% ± 5.84% of the value without CCT3 treatment (Fig. 7C). These results are evidence that overexpression of individual CCT subunits reduced mHTT levels by enhancing proteasomal degradation.
Discussion
HD pathogenesis manifests through derangement of diverse cellular functions (4, 5). Using microfluidic chambers to recreate the corticostriatal circuit, we discovered that BDNF expression in cortical neurons plays a defining role in the trophic status of striatal neurons and the synapses they form with cortical axons. Decreased BDNF release from BACHD cortical neurons was responsible for atrophy of BACHD striatal neurons. Remarkably, overexpressing TRiC subunits or a TRiC subunit domain reduced mHTT levels, countered deficits in BDNF transport, and significantly increased the size of BACHD striatal neurons. Taken together, the findings argue that mHTT-mediated disruption of BDNF anterograde transport is physiologically significant and motivate consideration of TRiC-inspired approaches for reducing mHTT levels to counter HD pathogenesis.
Recreating the corticostriatal circuit provided evidence that (i) the trophic status of striatal neurons features an essential role for BDNF synthesis and anterograde axonal transport in cortical neurons; (ii) mHTT expression in cortical neurons compromises BDNF transport, resulting in striatal neuron atrophy; (iii) mHTT expression has no effect on the size of cortical neurons; and (iv) absent BDNF, mHTT expression has little, if any, effect on the size or BDNF responsivity of striatal neurons. These observations show that mHTT affects the trophic status of cortical and striatal neurons differently. Importantly, in demonstrating that striatal neuron atrophy is due to mHTT expression in cortical neurons, they focus attention on the contributions that cortical neurons make to pathogenesis. mHTT-induced phenotypes likely emerge in both cortical and striatal neurons (51), and striatal cell-autonomous changes have been documented in BACHD mice (52–54). Nevertheless, an important role for cortical afferents was documented in recent studies in which selective deletion of mHTT in cortical afferents partially restored striatal physiological and behavioral phenotypes (55). Thus, although atrophy and loss of striatal neurons precede neuropathological changes in cortex in HD (2) cortical neuron functions, including BDNF transport, may be negatively affected before striatal neuron degeneration.
A role for BDNF in HD is supported by an extensive literature (8–10, 29, 32, 56). Our studies extend these observations by providing evidence that reducing mHTT expression in cortical neurons increased the supply of endogenous BDNF to striatal neurons, significantly improving their trophic status. We used TRiC reagents to rescue BDNF delivery. Suggesting that using TRiC may have an impact on HD pathogenesis, (i) wtHtt was found to interact with >700 cellular proteins, including CCT1 and CCT8 (57), and (ii) a Caenorhabditis elegans screening assay showed that six of eight CCT subunits suppressed mutant huntingtin aggregation (58). A technical challenge for using TRiC is that the TRiC complex consists of eight CCT subunits; introducing all eight subunits posed a daunting task. However, this concern was obviated when Frydman and coworkers (20) showed that a single CCT inhibited mHTT aggregation and reduced Htt-induced toxicity in N2A cells. Additionally, recent studies showed that the apical domain of CCT1 alone effectively reduced mHTT levels (26). We showed that individual CCT subunits reduced mHTTQ97 in PC12 cells and that CCT3 and ApiCCT1 reduced mHTT in BACHD neurons. Targeting the levels of mHTT to reverse salient features of HD pathogenesis has been suggested by others (59–61) and has been supported by elegant studies demonstrating that reducing mHTT expression in BACHD neurons improves HD-relevant phenotypes (6, 55). Further work will be needed to define the mechanism(s) by which mHTT induces HD pathogenesis and what role is played by deficits in BDNF transport and signaling.
The mechanism(s) by which CCT3 reduced mHTT implicates the ubiquitin-proteasome system (UPS), as demonstrated by showing that the proteasome inhibitor MG132 blocked CCT3-mediated degradation of mHTT. The mHTT species engaged by TRiC reagents and the structure(s) of active TRiC species, whether individual subunits or a TRiC complex, are uncertain, however. Given the ability of ApiCCT1 to reduce mHTT levels, it is possible that individual CCTs have TRiC-like activity by presenting a bound target to the proteasome for degradation (62). In any case, our study is evidence that reducing mHTT levels may be sufficient to counter HD pathogenesis.
How mHTT disrupted transport of BDNF-containing organelles is uncertain, but at least two classes were affected: one transported anterogradely containing newly synthesized BDNF and the other a retrogradely transported endosome. These findings are perhaps best understood by noting that Htt interacts with both anterograde and retrograde motor proteins (44–48, 56). Indeed, Htt appears to serve as a scaffolding protein to participate in a complex containing huntingtin-associated protein 1 (HAP1), the anterograde motor kinesin-1, and the dynein/dynactin retrograde motor (45–48). As such, wtHtt is positioned to play a critical role in regulating transport of many types of organelles (63). Moreover, dynein appears to regulate movement of most, if not all, cargoes. That mHTT disrupts the scaffolding function of wtHtt affords a compelling perspective (47, 56). Further insights may come from studies using CCT3 and apiCCT1 to reduce the mHTT levels.
Experimental Procedures
Primary Neuronal Culture and Transfection.
E17.5 primary embryonic mouse cortical and striatal neurons were dissected and plated on poly-l-lysine–coated coverslips or into microfluidic chambers as previously published (38). The experiments were approved by the University of California, San Diego Institutional Animal Care and Use Committee. The cultures were maintained in neurobasal medium with 2 mM GlutaMAX and 2% (vol/vol) B27. Half of the medium was replaced with fresh maintenance medium every 48 h; for studies of BDNF responsivity, the medium was replaced every 2–4 h for 2 d before adding BDNF. For BDNF-eGFP transport studies, Lipofectamine 2000 was used to transfect 0.8 μg of DNA/sample at DIV5.
Imaging of BDNF Transport.
QD-BDNF preparation and BDNF retrograde transport were performed as previously published (38). Microfluidic chambers with 150-μm microgrooves were used for BDNF DIV4 retrograde transport; chambers with 450-μm microgrooves were used for BDNF DIV7 retrograde and anterograde transport. For BDNF anterograde transport, cells were transfected with BDNF-eGFP for 48 h before imaging. For BDNF retrograde transport, cells were incubated with QD-BDNF for 4 h before imaging.
Somal Size Analysis.
Cortical and striatal neurons were live-imaged at DIV7. Neuron soma was traced and analyzed with ImageLab software.
SI Experimental Procedures
Antibodies, Reagents, and Materials.
Antibodies to CCT1 (91A), CCT3 (H300), CCT4 (PK/9/86b), CCT6 (G-06), CCT7 (FR-8), CCT8 (N-18), and GFP (FL) were from Santa Cruz Biotechnologies; CCT2 was from Abcam; CCT5, tubulin, MG132, and ANA-12 were from Sigma-Aldrich; huntingtin antibody (2166 and EM48) and polyglutamine antibody MAB1574 were from Millipore; synaptophysin antibody was from Sysy; PSD95 antibody was from Pierce; antibodies to Hsp70 and Hsp40 were from GenScript USA, Inc.; antibody to pTrkB (pY490) was a generously provided by Moses Chao, New York University, New York City; DsRed antibody was from Clontech; horseradish peroxidase (HRP)-conjugated goat anti-mouse or anti-rabbit IgG was from Jackson ImmunoResearch; and anti-GFP magnetic beads were from Allele. HBSS, neurobasal medium, Opti-MEM, trypsin, B27, GlutaMAX, Hepes, trypsin, penicillin/streptomycin, Lipofectamine 2000, LysoTracker, Qdot 655 streptavidin conjugate, and PA were from Life Technologies. DMEM-high glucose was from Corning. FBS was from Omega Scientific. Poly-l-lysine (PLL) was from Cultrex. Donor equine serum was from HyClone. DNase I and proteasome inhibitor mixture were from Roche. Microfluidic chambers were from XONA Microfluidics LLC. ECL substrate was from Bio-Rad. The cell counting kit was from Biotool.
BACHD Mice Model of HD.
The experiments were approved by the University of California, San Diego Institutional Animal Care and Use Committee. Hemizygote male BACHD mice [FVB/N-Tg(HTT*97Q)IXwy/J] and WT female mice (FVB/NJ) obtained from the Jackson Laboratories were used for mating. WT Htt and mHtt levels were verified with Htt antibody 2166.
Cell Viability Assay.
WT and BACHD cortical neurons were plated in dishes and grown for 7 d. Water-soluble tetrazolium salt WST-8 was added to the culture and incubated at 37 °C for 2 h. Absorbance was measured at 450 nm.
Plasmid Vectors and Lentivirus Production.
CCT-mCherry subunits were cloned with the PCDNA3.1 vector. WtHttQ25-GFP and mHTTQ97-GFP were from Judith Frydman (Stanford University, Stanford, CA). In some cases, Lox-Syn lentivirus vector was used for delivering CCT3 to neurons. This vector contains two separate neuronal-specific synapsin promoters, with one controlling the expression of indicated proteins and the other controlling the GFP expression (64). Lentiviral particles were generated using HEK293T cells cotransfected with the viral packaging plasmids pMD2.G and psPAX2. Viral titers were determined by serial dilution on primary neurons. Concentrated viruses were added to primary neurons at a multiplicity of infection of 5–10 in maintenance media at DIV3 with analysis at DIV7.
ApiCCT1 Detection in Cellular Fractions.
ApiCCT1 was purified as previously described (20, 65). Primary cortical neurons were isolated from E17 FVB mice as previously described (66). Cortical neurons were plated at 13 × 106 cells per dish in PLL-coated, 10-cm dishes in neurobasal medium supplemented with B27, N2, 2 mM GlutaMAX, and streptomycin/amphotericin B (Life Technologies). Cells were treated with 1 μM exogenous, purified human ApiCCT1, or the buffer control, on DIV9 and harvested on DIV11. Cellular fractionation was performed as previously described, and the total (T), cytoplasmic (C), and nuclear (N) fractions were collected and analyzed by SDS/PAGE.
Imaging of Lysosome Transport.
DIV7 neurons were incubated with 50 nM LysoTracker Red DND-99 for 30 min before imaging.
Cell Culture and Transfection.
PC12 cells and 14A2.6 (a PC12 cell line inducibly expressing mHTTQ103) were maintained as described (49, 67). Cells were grown in a 12-well plate to 50–60% confluency prior to transfection. A total of 1 μg of DNA was mixed with 2 μL of Lipofectamine 2000 in 50 μL of Opti-MEM and incubated for 15 min at room temperature before being added dropwise to cells. The 14A.26 cells were induced with 5 μM PA 24 h after transfection. At 48 h after transfection, cells were imaged or collected for Western blotting.
Immunostaining with Synaptic Marker and mHTT.
Neurons on coverslips were fixed in 4% (wt/vol) paraformaldehyde and 4% (vol/vol) glucose in PBS for 30 min at 37 °C and then permeabilized in blocking solution with 5% (vol/vol) goat serum, 3% (wt/vol) BSA, and 0.1% Triton X-100 in PBS for 1 h at room temperature. Cells were then incubated with primary antibodies in blocking solution for 1 h at room temperature or overnight at 4 °C. Alexa-conjugated goat secondary antibodies were added in PBS for 1 h at room temperature. Coverslips were washed and mounted in antifade and sealed using nail polish. Visualization of neurons was on a Leica DMI6000B inverted microscope with a 100× oil objective. ImageJ (NIH) was used to calculate scale bars for each image. Colocalization of pre- and postsynaptic markers was analyzed in Fiji software using the Coloc2 plug-in.
Filter Retardation Assay for SDS-Insoluble mHTT Aggregates.
Filter retardation assays on 14A2.6 cell lysates were performed as previously described (66, 68). Cells were collected, lysed in 2% (wt/vol) SDS, and sonicated for 15 s three times. DNaseI was added to degrade genome DNA, and lysates were boiled for 10 min. Lysates were then filtered through a cellulose acetate membrane (0.2 μm; Whatman) using a Bio-Rad slot-blot filtration manifold, followed by two washes of 0.1% SDS. The membranes were then blocked with 5% (wt/vol) milk in PBS. SDS-insoluble aggregates retained on the membrane were detected by incubation with anti-Htt antibody EM48, followed by a secondary antibody conjugated to HRP, and were visualized using Bio-Rad ChemiDoc.
Flow Cytometry Analysis for mHTT Protein Level.
At 48 h after transfection, cells were collected using 0.25% trypsin; they were then washed with PBS supplemented with 2% (vol/vol) FBS. FITC- and mCherry-positive cells were gated and analyzed by fluorescence-activated cell sorting (FACS) using a CantonTM (BD Biosciences) and BD FACSDiva software 6.0 (BD Biosciences).
SDS/PAGE and Immunoblotting.
Cells were collected and lysed in lysis buffer [50 mM Tris, 150 mM NaCl, 1 mM EDTA (pH 8.0), 1% Nonidet P-40, 0.5% SDS] with a proteasome inhibitor mixture and 50 mM PMSF on ice for 30 min. Then, 5× loading buffer [125 mM Tris⋅HCl (pH 6.8), 10% (wt/vol) SDS, 50% (vol/vol) glycerol, 5% (vol/vol) β-mercaptoethanol, 62.5 mM EDTA, 0.1% bromophenol blue] was added into the lysates to make final lysate in 1× loading buffer. Lysates were incubated at 90 °C for 5 min and centrifuged. Supernatants were loaded onto 7%, 10%, or 12% SDS/PAGE gels. Gels were then run at 100 V until the dye front reached the bottom. Then, gels were transfected to PVDF membranes at 50 V for 2 h. Blots were blocked for 1 h in 5% (wt/vol) milk, probed with primary antibody overnight at 4 °C, and further probed with peroxidase-conjugated secondary antibodies at room temperature for 1 h. Blots were detected using Clarity ECL substrate, developed using the Bio-Rad ChemiDoc system, and quantitated with ImageLab software.
Cycloheximide Chase Assay.
PC12 cells expressing CCT or mCherry for 48 h were treated with 100 μg/mL cycloheximide for 0, 1, or 2 h. Cells were collected and lysed in lysis buffer [50 mM Tris, 150 mM NaCl, 1 mM EDTA (pH 8.0), 1% Nonidet P-40, 0.5% SDS] with a proteasome inhibitor mixture and 50 mM PMSF on ice for 30 min. Lysates were centrifuged, and supernatants were subjected to Western blotting analysis.
Coimmunoprecipitation.
Equal numbers of treated and untreated 293 cells were lysed in 1% Nonidet P-40 lysis buffer (150 mM NaCl, 1% Nonidet P-40) with a proteasome inhibitor mixture and 50 mM PMSF on ice for 30 min. Lysates were centrifuged, and supernatants were incubated with anti-GFP magnetic beads overnight at 4 °C. Beads were washed three times on a magnetic stand with 1% Nonidet P-40 lysis buffer and boiled in 2× SDS/PAGE loading buffer [50 mM Tris⋅HCl (pH 6.8), 4% (wt/vol) SDS, 20% (vol/vol) glycerol, 2% (vol/vol) β-mercaptoethanol, 25 mM EDTA, 0.04% bromophenol blue] for 5 min. After centrifugation, samples were subjected to Western blotting analysis.
Acknowledgments
We thank Dr. Judith Frydman for providing ApiCCT1 protein and Dr. Karen Messer for assistance with data analysis. This research is supported by NI7H Grant PN2EY016525, the Down Syndrome Research and Treatment Foundation (DSRTF), the Larry L. Hillblom Foundation, and the Tau Consortium (W.C.M. and C.W.). S.H.S. was supported by the NIH Nanobiology Training Program (T32EB009379) through the W. M. Keck Center of the Gulf Coast Consortia. J.O. was supported by an NIH Training Program and National Research Service Award grant.
Footnotes
The authors declare no conflict of interest.
This article is a PNAS Direct Submission.
This article contains supporting information online at www.pnas.org/lookup/suppl/doi:10.1073/pnas.1603020113/-/DCSupplemental.
References
- 1.Ross CA, Tabrizi SJ. Huntington’s disease: From molecular pathogenesis to clinical treatment. Lancet Neurol. 2011;10(1):83–98. doi: 10.1016/S1474-4422(10)70245-3. [DOI] [PubMed] [Google Scholar]
- 2.Vonsattel JP, DiFiglia M. Huntington disease. J Neuropathol Exp Neurol. 1998;57(5):369–384. doi: 10.1097/00005072-199805000-00001. [DOI] [PubMed] [Google Scholar]
- 3.Estrada Sánchez AM, Mejía-Toiber J, Massieu L. Excitotoxic neuronal death and the pathogenesis of Huntington’s disease. Arch Med Res. 2008;39(3):265–276. doi: 10.1016/j.arcmed.2007.11.011. [DOI] [PubMed] [Google Scholar]
- 4.Bennett EJ, et al. Global changes to the ubiquitin system in Huntington’s disease. Nature. 2007;448(7154):704–708. doi: 10.1038/nature06022. [DOI] [PubMed] [Google Scholar]
- 5.Browne SE. Mitochondria and Huntington’s disease pathogenesis: Insight from genetic and chemical models. Ann N Y Acad Sci. 2008;1147:358–382. doi: 10.1196/annals.1427.018. [DOI] [PubMed] [Google Scholar]
- 6.Wang N, et al. Neuronal targets for reducing mutant huntingtin expression to ameliorate disease in a mouse model of Huntington’s disease. Nat Med. 2014;20(5):536–541. doi: 10.1038/nm.3514. [DOI] [PMC free article] [PubMed] [Google Scholar]
- 7.Cattaneo E, et al. Loss of normal huntingtin function: New developments in Huntington’s disease research. Trends Neurosci. 2001;24(3):182–188. doi: 10.1016/s0166-2236(00)01721-5. [DOI] [PubMed] [Google Scholar]
- 8.Zuccato C, et al. Progressive loss of BDNF in a mouse model of Huntington’s disease and rescue by BDNF delivery. Pharmacol Res. 2005;52(2):133–139. doi: 10.1016/j.phrs.2005.01.001. [DOI] [PubMed] [Google Scholar]
- 9.Zuccato C, et al. Loss of huntingtin-mediated BDNF gene transcription in Huntington’s disease. Science. 2001;293(5529):493–498. doi: 10.1126/science.1059581. [DOI] [PubMed] [Google Scholar]
- 10.Lu B, Nagappan G, Lu Y. BDNF and synaptic plasticity, cognitive function, and dysfunction. Handbook Exp Pharmacol. 2014;220:223–250. doi: 10.1007/978-3-642-45106-5_9. [DOI] [PubMed] [Google Scholar]
- 11.Altar CA, et al. Anterograde transport of brain-derived neurotrophic factor and its role in the brain. Nature. 1997;389(6653):856–860. doi: 10.1038/39885. [DOI] [PubMed] [Google Scholar]
- 12.Zuccato C, Cattaneo E. Role of brain-derived neurotrophic factor in Huntington’s disease. Prog Neurobiol. 2007;81(5-6):294–330. doi: 10.1016/j.pneurobio.2007.01.003. [DOI] [PubMed] [Google Scholar]
- 13.Ginés S, et al. Reduced expression of the TrkB receptor in Huntington’s disease mouse models and in human brain. Eur J Neurosci. 2006;23(3):649–658. doi: 10.1111/j.1460-9568.2006.04590.x. [DOI] [PubMed] [Google Scholar]
- 14.Strand AD, et al. Expression profiling of Huntington’s disease models suggests that brain-derived neurotrophic factor depletion plays a major role in striatal degeneration. J Neurosci. 2007;27(43):11758–11768. doi: 10.1523/JNEUROSCI.2461-07.2007. [DOI] [PMC free article] [PubMed] [Google Scholar]
- 15.Canals JM, et al. Brain-derived neurotrophic factor regulates the onset and severity of motor dysfunction associated with enkephalinergic neuronal degeneration in Huntington’s disease. J Neurosci. 2004;24(35):7727–7739. doi: 10.1523/JNEUROSCI.1197-04.2004. [DOI] [PMC free article] [PubMed] [Google Scholar]
- 16.Chagoyen M, Carrascosa JL, Pazos F, Valpuesta JM. Molecular determinants of the ATP hydrolysis asymmetry of the CCT chaperonin complex. Proteins. 2014;82(5):703–707. doi: 10.1002/prot.24510. [DOI] [PubMed] [Google Scholar]
- 17.Frydman J. Folding of newly translated proteins in vivo: The role of molecular chaperones. Annu Rev Biochem. 2001;70:603–647. doi: 10.1146/annurev.biochem.70.1.603. [DOI] [PubMed] [Google Scholar]
- 18.Dunn AY, Melville MW, Frydman J. Review: Cellular substrates of the eukaryotic chaperonin TRiC/CCT. J Struct Biol. 2001;135(2):176–184. doi: 10.1006/jsbi.2001.4380. [DOI] [PubMed] [Google Scholar]
- 19.Spiess C, Meyer AS, Reissmann S, Frydman J. Mechanism of the eukaryotic chaperonin: Protein folding in the chamber of secrets. Trends Cell Biol. 2004;14(11):598–604. doi: 10.1016/j.tcb.2004.09.015. [DOI] [PMC free article] [PubMed] [Google Scholar]
- 20.Tam S, Geller R, Spiess C, Frydman J. The chaperonin TRiC controls polyglutamine aggregation and toxicity through subunit-specific interactions. Nat Cell Biol. 2006;8(10):1155–1162. doi: 10.1038/ncb1477. [DOI] [PMC free article] [PubMed] [Google Scholar]
- 21.Kabir MA, et al. Functional subunits of eukaryotic chaperonin CCT/TRiC in protein folding. J Amino Acids. 2011;2011:843206. doi: 10.4061/2011/843206. [DOI] [PMC free article] [PubMed] [Google Scholar]
- 22.Kitamura A, et al. Cytosolic chaperonin prevents polyglutamine toxicity with altering the aggregation state. Nat Cell Biol. 2006;8(10):1163–1170. doi: 10.1038/ncb1478. [DOI] [PubMed] [Google Scholar]
- 23.Jana NR, Tanaka M, Wang Gh, Nukina N. Polyglutamine length-dependent interaction of Hsp40 and Hsp70 family chaperones with truncated N-terminal huntingtin: Their role in suppression of aggregation and cellular toxicity. Hum Mol Genet. 2000;9(13):2009–2018. doi: 10.1093/hmg/9.13.2009. [DOI] [PubMed] [Google Scholar]
- 24.Gunawardena S, et al. Disruption of axonal transport by loss of huntingtin or expression of pathogenic polyQ proteins in Drosophila. Neuron. 2003;40(1):25–40. doi: 10.1016/s0896-6273(03)00594-4. [DOI] [PubMed] [Google Scholar]
- 25.Cong Y, et al. 4.0-A resolution cryo-EM structure of the mammalian chaperonin TRiC/CCT reveals its unique subunit arrangement. Proc Natl Acad Sci USA. 2010;107(11):4967–4972. doi: 10.1073/pnas.0913774107. [DOI] [PMC free article] [PubMed] [Google Scholar]
- 26.Sontag EM, et al. Exogenous delivery of chaperonin subunit fragment ApiCCT1 modulates mutant Huntingtin cellular phenotypes. Proc Natl Acad Sci USA. 2013;110(8):3077–3082. doi: 10.1073/pnas.1222663110. [DOI] [PMC free article] [PubMed] [Google Scholar]
- 27.Darrow MC, et al. Structural mechanisms of mutant huntingtin aggregation suppression by the synthetic chaperonin-like CCT5 complex Explained by cryoelectron tomography. J Biol Chem. 2015;290(28):17451–17461. doi: 10.1074/jbc.M115.655373. [DOI] [PMC free article] [PubMed] [Google Scholar]
- 28.Gray M, et al. Full-length human mutant huntingtin with a stable polyglutamine repeat can elicit progressive and selective neuropathogenesis in BACHD mice. J Neurosci. 2008;28(24):6182–6195. doi: 10.1523/JNEUROSCI.0857-08.2008. [DOI] [PMC free article] [PubMed] [Google Scholar]
- 29.Xie Y, Hayden MR, Xu B. BDNF overexpression in the forebrain rescues Huntington’s disease phenotypes in YAC128 mice. J Neurosci. 2010;30(44):14708–14718. doi: 10.1523/JNEUROSCI.1637-10.2010. [DOI] [PMC free article] [PubMed] [Google Scholar]
- 30.Aylward EH, et al. Onset and rate of striatal atrophy in preclinical Huntington disease. Neurology. 2004;63(1):66–72. doi: 10.1212/01.wnl.0000132965.14653.d1. [DOI] [PubMed] [Google Scholar]
- 31.Baquet ZC, Gorski JA, Jones KR. Early striatal dendrite deficits followed by neuron loss with advanced age in the absence of anterograde cortical brain-derived neurotrophic factor. J Neurosci. 2004;24(17):4250–4258. doi: 10.1523/JNEUROSCI.3920-03.2004. [DOI] [PMC free article] [PubMed] [Google Scholar]
- 32.Li Y, et al. Conditional ablation of brain-derived neurotrophic factor-TrkB signaling impairs striatal neuron development. Proc Natl Acad Sci USA. 2012;109(38):15491–15496. doi: 10.1073/pnas.1212899109. [DOI] [PMC free article] [PubMed] [Google Scholar]
- 33.Gorski JA, Zeiler SR, Tamowski S, Jones KR. Brain-derived neurotrophic factor is required for the maintenance of cortical dendrites. J Neurosci. 2003;23(17):6856–6865. doi: 10.1523/JNEUROSCI.23-17-06856.2003. [DOI] [PMC free article] [PubMed] [Google Scholar]
- 34.Swift DL, et al. The effect of exercise training modality on serum brain derived neurotrophic factor levels in individuals with type 2 diabetes. PLoS One. 2012;7(8):e42785. doi: 10.1371/journal.pone.0042785. [DOI] [PMC free article] [PubMed] [Google Scholar]
- 35.Kolbeck R, Bartke I, Eberle W, Barde YA. Brain-derived neurotrophic factor levels in the nervous system of wild-type and neurotrophin gene mutant mice. J Neurochem. 1999;72(5):1930–1938. doi: 10.1046/j.1471-4159.1999.0721930.x. [DOI] [PubMed] [Google Scholar]
- 36.Matsumoto T, et al. Biosynthesis and processing of endogenous BDNF: CNS neurons store and secrete BDNF, not pro-BDNF. Nat Neurosci. 2008;11(2):131–133. doi: 10.1038/nn2038. [DOI] [PubMed] [Google Scholar]
- 37.Dieni S, et al. BDNF and its pro-peptide are stored in presynaptic dense core vesicles in brain neurons. J Cell Biol. 2012;196(6):775–788. doi: 10.1083/jcb.201201038. [DOI] [PMC free article] [PubMed] [Google Scholar]
- 38.Zhao X, et al. Real-time imaging of axonal transport of quantum dot-labeled BDNF in primary neurons. J Vis Exp. 2014;(91):51899. doi: 10.3791/51899. [DOI] [PMC free article] [PubMed] [Google Scholar]
- 39.Weissmiller AM, et al. A γ-secretase inhibitor, but not a γ-secretase modulator, induced defects in BDNF axonal trafficking and signaling: Evidence for a role for APP. PLoS One. 2015;10(2):e0118379. doi: 10.1371/journal.pone.0118379. [DOI] [PMC free article] [PubMed] [Google Scholar]
- 40.Gu X, et al. Serines 13 and 16 are critical determinants of full-length human mutant huntingtin induced disease pathogenesis in HD mice. Neuron. 2009;64(6):828–840. doi: 10.1016/j.neuron.2009.11.020. [DOI] [PMC free article] [PubMed] [Google Scholar]
- 41.von Bartheld CS. Axonal transport and neuronal transcytosis of trophic factors, tracers, and pathogens. J Neurobiol. 2004;58(2):295–314. doi: 10.1002/neu.10315. [DOI] [PubMed] [Google Scholar]
- 42.Cazorla M, et al. Identification of a low-molecular weight TrkB antagonist with anxiolytic and antidepressant activity in mice. J Clin Invest. 2011;121(5):1846–1857. doi: 10.1172/JCI43992. [DOI] [PMC free article] [PubMed] [Google Scholar]
- 43.Park H, Poo MM. Neurotrophin regulation of neural circuit development and function. Nat Rev Neurosci. 2013;14(1):7–23. doi: 10.1038/nrn3379. [DOI] [PubMed] [Google Scholar]
- 44.Liot G, et al. Mutant Huntingtin alters retrograde transport of TrkB receptors in striatal dendrites. J Neurosci. 2013;33(15):6298–6309. doi: 10.1523/JNEUROSCI.2033-12.2013. [DOI] [PMC free article] [PubMed] [Google Scholar]
- 45.Caviston JP, Ross JL, Antony SM, Tokito M, Holzbaur EL. Huntingtin facilitates dynein/dynactin-mediated vesicle transport. Proc Natl Acad Sci USA. 2007;104(24):10045–10050. doi: 10.1073/pnas.0610628104. [DOI] [PMC free article] [PubMed] [Google Scholar]
- 46.McGuire JR, Rong J, Li SH, Li XJ. Interaction of Huntingtin-associated protein-1 with kinesin light chain: Implications in intracellular trafficking in neurons. J Biol Chem. 2006;281(6):3552–3559. doi: 10.1074/jbc.M509806200. [DOI] [PubMed] [Google Scholar]
- 47.Caviston JP, Holzbaur EL. Huntingtin as an essential integrator of intracellular vesicular trafficking. Trends Cell Biol. 2009;19(4):147–155. doi: 10.1016/j.tcb.2009.01.005. [DOI] [PMC free article] [PubMed] [Google Scholar]
- 48.Caviston JP, Zajac AL, Tokito M, Holzbaur EL. Huntingtin coordinates the dynein-mediated dynamic positioning of endosomes and lysosomes. Mol Biol Cell. 2011;22(4):478–492. doi: 10.1091/mbc.E10-03-0233. [DOI] [PMC free article] [PubMed] [Google Scholar]
- 49.Apostol BL, et al. A cell-based assay for aggregation inhibitors as therapeutics of polyglutamine-repeat disease and validation in Drosophila. Proc Natl Acad Sci USA. 2003;100(10):5950–5955. doi: 10.1073/pnas.2628045100. [DOI] [PMC free article] [PubMed] [Google Scholar]
- 50.Wheeler VC, et al. Long glutamine tracts cause nuclear localization of a novel form of huntingtin in medium spiny striatal neurons in HdhQ92 and HdhQ111 knock-in mice. Hum Mol Genet. 2000;9(4):503–513. doi: 10.1093/hmg/9.4.503. [DOI] [PubMed] [Google Scholar]
- 51.Zuccato C, Valenza M, Cattaneo E. Molecular mechanisms and potential therapeutical targets in Huntington’s disease. Physiol Rev. 2010;90(3):905–981. doi: 10.1152/physrev.00041.2009. [DOI] [PubMed] [Google Scholar]
- 52.Gu X, et al. Pathological cell-cell interactions are necessary for striatal pathogenesis in a conditional mouse model of Huntington’s disease. Mol Neurodegener. 2007;2:8. doi: 10.1186/1750-1326-2-8. [DOI] [PMC free article] [PubMed] [Google Scholar]
- 53.Gu X, et al. Pathological cell-cell interactions elicited by a neuropathogenic form of mutant Huntingtin contribute to cortical pathogenesis in HD mice. Neuron. 2005;46(3):433–444. doi: 10.1016/j.neuron.2005.03.025. [DOI] [PubMed] [Google Scholar]
- 54.Thomas EA, et al. In vivo cell-autonomous transcriptional abnormalities revealed in mice expressing mutant huntingtin in striatal but not cortical neurons. Hum Mol Genet. 2011;20(6):1049–1060. doi: 10.1093/hmg/ddq548. [DOI] [PMC free article] [PubMed] [Google Scholar]
- 55.Estrada-Sánchez AM, et al. Cortical efferents lacking mutant huntingtin improve striatal neuronal activity and behavior in a conditional mouse model of Huntington’s disease. J Neurosci. 2015;35(10):4440–4451. doi: 10.1523/JNEUROSCI.2812-14.2015. [DOI] [PMC free article] [PubMed] [Google Scholar]
- 56.Gauthier LR, et al. Huntingtin controls neurotrophic support and survival of neurons by enhancing BDNF vesicular transport along microtubules. Cell. 2004;118(1):127–138. doi: 10.1016/j.cell.2004.06.018. [DOI] [PubMed] [Google Scholar]
- 57.Shirasaki DI, et al. Network organization of the huntingtin proteomic interactome in mammalian brain. Neuron. 2012;75(1):41–57. doi: 10.1016/j.neuron.2012.05.024. [DOI] [PMC free article] [PubMed] [Google Scholar]
- 58.Teuling E, et al. Modifiers of mutant huntingtin aggregation: Functional conservation of C. elegans-modifiers of polyglutamine aggregation. PLoS Curr. 2011;3:RRN1255. doi: 10.1371/currents.RRN1255. [DOI] [PMC free article] [PubMed] [Google Scholar]
- 59.Kordasiewicz HB, et al. Sustained therapeutic reversal of Huntington’s disease by transient repression of huntingtin synthesis. Neuron. 2012;74(6):1031–1044. doi: 10.1016/j.neuron.2012.05.009. [DOI] [PMC free article] [PubMed] [Google Scholar]
- 60.Yamamoto A, Lucas JJ, Hen R. Reversal of neuropathology and motor dysfunction in a conditional model of Huntington’s disease. Cell. 2000;101(1):57–66. doi: 10.1016/S0092-8674(00)80623-6. [DOI] [PubMed] [Google Scholar]
- 61.Martín-Aparicio E, et al. Proteasomal-dependent aggregate reversal and absence of cell death in a conditional mouse model of Huntington’s disease. J Neurosci. 2001;21(22):8772–8781. doi: 10.1523/JNEUROSCI.21-22-08772.2001. [DOI] [PMC free article] [PubMed] [Google Scholar]
- 62.McClellan AJ, Tam S, Kaganovich D, Frydman J. Protein quality control: Chaperones culling corrupt conformations. Nat Cell Biol. 2005;7(8):736–741. doi: 10.1038/ncb0805-736. [DOI] [PubMed] [Google Scholar]
- 63.Kegel KB, et al. Huntingtin expression stimulates endosomal-lysosomal activity, endosome tubulation, and autophagy. J Neurosci. 2000;20(19):7268–7278. doi: 10.1523/JNEUROSCI.20-19-07268.2000. [DOI] [PMC free article] [PubMed] [Google Scholar]
- 64.Gascón S, Paez-Gomez JA, Díaz-Guerra M, Scheiffele P, Scholl FG. Dual-promoter lentiviral vectors for constitutive and regulated gene expression in neurons. J Neurosci Methods. 2008;168(1):104–112. doi: 10.1016/j.jneumeth.2007.09.023. [DOI] [PubMed] [Google Scholar]
- 65.Tam S, et al. The chaperonin TRiC blocks a huntingtin sequence element that promotes the conformational switch to aggregation. Nat Struct Mol Biol. 2009;16(12):1279–1285. doi: 10.1038/nsmb.1700. [DOI] [PMC free article] [PubMed] [Google Scholar]
- 66.Sontag EM, et al. Methylene blue modulates huntingtin aggregation intermediates and is protective in Huntington’s disease models. J Neurosci. 2012;32(32):11109–11119. doi: 10.1523/JNEUROSCI.0895-12.2012. [DOI] [PMC free article] [PubMed] [Google Scholar]
- 67.Wu C, Lai CF, Mobley WC. Nerve growth factor activates persistent Rap1 signaling in endosomes. J Neurosci. 2001;21(15):5406–5416. doi: 10.1523/JNEUROSCI.21-15-05406.2001. [DOI] [PMC free article] [PubMed] [Google Scholar]
- 68.Scherzinger E, et al. Huntingtin-encoded polyglutamine expansions form amyloid-like protein aggregates in vitro and in vivo. Cell. 1997;90(3):549–558. doi: 10.1016/s0092-8674(00)80514-0. [DOI] [PubMed] [Google Scholar]


