Significance
Upon activation and proliferation, CD8+ T cells uniformly differentiate first into an early effector cell stage. This is followed by divergent differentiation into a mix of memory precursor and terminal effector cells. The contributing factors to the fate decisions during the early effector cell stage continue to be deciphered. Here we report the critical role of the de novo DNA methyltransferase 3a (DNMT3a) in restricting the development of memory precursor cells and allowing normal terminal effector cell differentiation. Importantly, the effects of DNMT3a-mediated DNA methylation occur during the early effector cell stage of CD8+ T-cell differentiation.
Keywords: T cells, DNA methylation, cell differentiation, memory, gene regulation
Abstract
DNMT3a is a de novo DNA methyltransferase expressed robustly after T-cell activation that regulates plasticity of CD4+ T-cell cytokine expression. Here we show that DNMT3a is critical for directing early CD8+ T-cell effector and memory fate decisions. Whereas effector function of DNMT3a knockout T cells is normal, they develop more memory precursor and fewer terminal effector cells in a T-cell intrinsic manner compared with wild-type animals. Rather than increasing plasticity of differentiated effector CD8+ T cells, loss of DNMT3a biases differentiation of early effector cells into memory precursor cells. This is attributed in part to ineffective repression of Tcf1 expression in knockout T cells, as DNMT3a localizes to the Tcf7 promoter and catalyzes its de novo methylation in early effector WT CD8+ T cells. These data identify DNMT3a as a crucial regulator of CD8+ early effector cell differentiation and effector versus memory fate decisions.
During normal CD8+ T-cell adaptive immune responses, an antigen-specific T-cell clone undergoes massive proliferation and clonal expansion, generating a heterogeneous population of daughter cells (1). Shortly after activation, CD8+ T cells down-regulate CD62L and CD127 and have been termed early effector cells. These further divide and differentiate into CD127− killer cell lectin-like receptor G1 (KLRG1)+ terminal effector and CD127+KLRG1− memory precursor cells (2–4). Several factors have been identified that influence the differentiation and polarization of early effector cells toward either terminal effector cells or memory precursor cells. The initial CD8+ T-cell clonal frequency (5, 6), inflammatory signals driving transcription factor expression (2, 7), cytokine stimulation (8, 9), and transcription factor expression levels (10, 11) all impact the fate of early effector CD8+ T cells. As these T cells are genetically identical, cellular processes of epigenetic regulation would also be predicted to play a key role in determining and perpetuating the fate decisions of individual CD8+ T cells.
Epigenetic gene regulation encompasses the heritable covalent DNA and histone posttranslational modifications made in individual cells at specific gene loci that function to regulate the accessibility of these genes within chromatin to transcriptional activation (recently reviewed in ref. 12). Epigenetic regulation within T cells has been studied in detail for individual genes (13, 14) and more recently on the whole genome scale (15–17). These studies have identified patterns of histone marks and DNA methylation that differ across the genome between naïve, activated, and memory T cells and correlate with patterns of gene expression.
DNA methylation on the cytosine of CpG dinucleotides in gene promoter regions is associated with silencing gene expression. Of the DNA methyltransferases, only DNA methyltransferase 3a (DNMT3a) and 3b (DNMT3b) are capable of adding de novo CpG methylation marks and thus may dynamically regulate gene silencing. We and others have previously shown that DNMT3a is the dominant DNA methyltransferase active in T cells (18, 19). In CD4+ T cells, DNMT3a plays a key role in lineage stability and restricting plasticity. DNMT3a mediates CpG DNA methylation and silencing of the Ifng promoter during Th2 differentiation (20) and the Il13 promoter in an asthma model (19). In both of these models, DNMT3a functions in CD4+ T cells to control the stability, but not the acquisition, of the differentiated state.
Here we report a critical role for DNMT3a in effector CD8+ T-cell fate. Using T-cell–specific DNMT3a knockout (KO) models, we found that DNMT3a was critical for restraining the number of memory precursor effector cells and limiting long-term T-cell memory. Interestingly, the effect of DNMT3a on memory precursor cells was observed at the early effector stage generated within a few days of T-cell activation and was not due to altered plasticity of more differentiated CD8+ T-cell subsets. Mechanistically, DNMT3a expression is necessary for methylation of the T cell specific transcription factor 7 (Tcf7) gene promoter in early effector cells to restrict the frequency of Tcf1hi memory precursor cells.
Results
DNMT3a Is Required for Normal CD127+KLRG1− Memory Precursor Cell and CD127−KLRG1+ Terminal Effector Cell Differentiation Following Viral Infection.
To assess the role of DNMT3a in CD8+ T cells, we used T-cell conditional DNMT3a KO mice generated as described below, referred to as DNMT3a KO mice and DNMT3a KO T cells throughout the rest of this report. DNMT3a is deleted at or slightly before the double positive stage or very late at the double positive stage of T-cell thymic development in CD4-Cre (21) and distal Lck (dLck)-Cre mice (22), respectively. Thus, in both models, peripheral T cells lack DNMT3a in both CD4+ and CD8+ T cells. As described previously, 6- to 8-wk-old T-cell conditional DNMT3a KO mice have normal numbers of thymocytes and normal numbers of peripheral CD4+ and CD8+ single positive T cells (18).
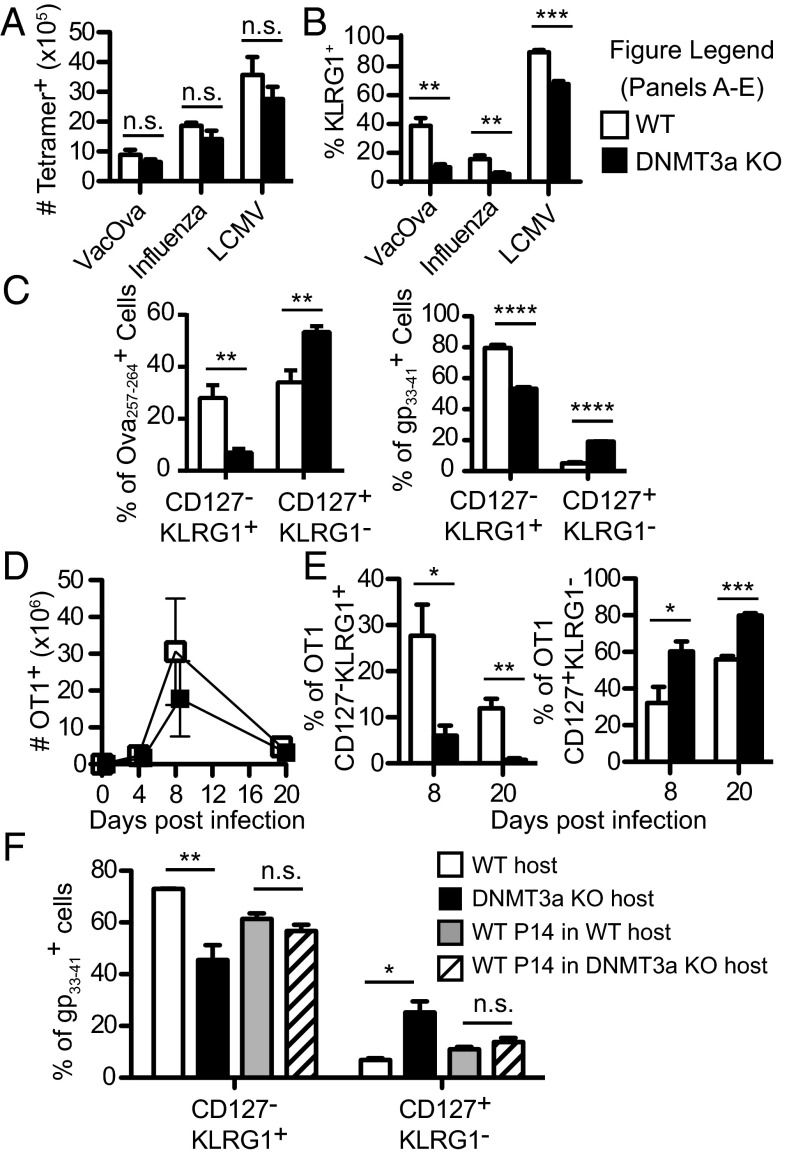
Three different acute viral infection models: recombinant vaccinia virus expressing ovalbumin (VacOva) (23), influenza (PR8 strain), and lymphocytic choriomeningitis virus (LCMV Armstrong strain), were used to assess the CD8+ T-cell virus-specific responses in WT and DNMT3a KO mice. Mice were infected with virus and immunodominant CD8+ T-cell responses were assessed by MHC I viral epitope-tetramer staining: H-2Kb–restricted Ova257–264, H-2Db–restricted influenza nucleoprotein366–374, and H-2Db–restricted LCMV gp33–41. At the peak of the CD8+ T-cell response to each type of infection (VacOva = day 7, influenza and LCMV = day 10), no significant differences in the absolute numbers of CD8+-tetramer+ cells were noted between WT and DNMT3a KO mice (Fig. 1A and Fig. S1A).
Fig. 1.
DNMT3a is required for normal CD127+KLRG1− memory precursor cell versus CD127−KLRG1+ terminal effector cell differentiation. (A) Absolute number of tetramer+CD8+ splenocytes in DNMT3a KO mice and WT littermates after VacOva (day 7), influenza (day 10), or LCMV (day 10) infections. Bar graph (mean ± SEM) compares WT (n = 4) and DNMT3a KO (n = 4) mice. (B) Splenocytes from A were stained for KLRG1. Bar graphs (mean ± SEM) depict the percent of tetramer+CD8+ that are KLRG1+. (C) Bar graphs (mean ± SEM) depict populations defined by CD127 and KLRG1 surface staining gated on CD8+ Ova257–264-tetramer+ cells 7 d after VacOva infection (Left) or gp33–41-tetramer+CD8+ T cells day 10 post-LCMV infection (Right) from WT (n = 4) and DNMT3a KO (n = 4) mice. (D) Absolute numbers of splenic OT1 DNMT3a WT or KO T cells recovered postinfection. Data points depict mean ± SD. WT (n = 4) and DNMT3a KO (n = 4) OT1 for each time point. (E) Percent of CD127−KLRG1+ terminal effector cells (Left) and the percent of CD127+KLRG1− memory precursor cells (Right) gated on WT or DNMT3a KO OT1 T cells after adoptive transfer and VacOva infection. Bar graphs (mean ± SEM) compare WT (n = 4) and DNMT3a KO (n = 4) mice for each time point. (F) Adoptive transfer of WT P14 CD8+ T cells into WT or DNMT3a KO congenic hosts followed by LCMV infection. Host gp33–41-specific CD8+ T cells and P14 transferred cells were phenotyped 10 d after infection. Bar graphs (mean ± SEM) compare WT gp33–41-specific host, DNMT3a KO gp33–41-specific host, WT P14 CD8+ T cells in WT host, and WT P14 CD8+ T cells in DNMT3a KO host (n = 3 mice per group). All experiments in A–F were performed at least three times with similar results. For all panels, n.s. P > 0.05, *P < 0.05, **P < 0.01, ***P < 0.0005, ****P < 0.0001 (unpaired two-tailed Student’s t test).
Fig. S1.
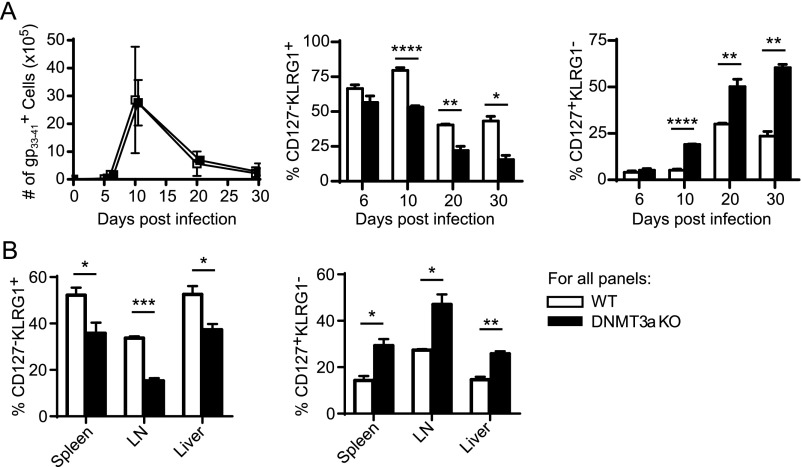
Differences in CD127+KLRG1− memory precursor cell versus CD127−KLRG1+ terminal effector cell differentiation persist throughout the contraction phase of the immune response and are independent of the tissue examined. Cohorts of WT and DNMT3a KO mice were infected with LCMV and killed at different times as indicated and antigen-specific T cells identified by gp33–41-tetramer staining. (A) Analysis of splenocytes on different days postinfection. (Left) Absolute number of antigen-specific T cells per spleen (each data point = mean ± SD). (Center) Percent of CD127−KLRG1+ antigen-specific CD8+ terminal effector cells. (Right) Percent of CD127+KLRG1− antigen-specific CD8+ memory precursor cells versus time postinfection. Bar graphs (mean ± SEM) compare WT (n = 4) and DNMT3a KO (n = 4) mice for each time point. The experiment was performed three times with similar results. (B) Different tissues were isolated and stained independently from mice killed day 10 postinfection. (Left) Percent of CD127−KLRG1+ antigen-specific CD8+ terminal effector cells. (Right) Percent of CD127+KLRG1− antigen-specific CD8+ memory precursor cells in each tissue. Bar graphs (mean ± SEM) compare WT (n = 3) and DNMT3a KO (n = 3) mice. This experiment was performed three times with similar results. For all panels, *P < 0.05, **P < 0.01, ***P < 0.0005, ****P < 0.0001 (unpaired two-tailed Student’s t test).
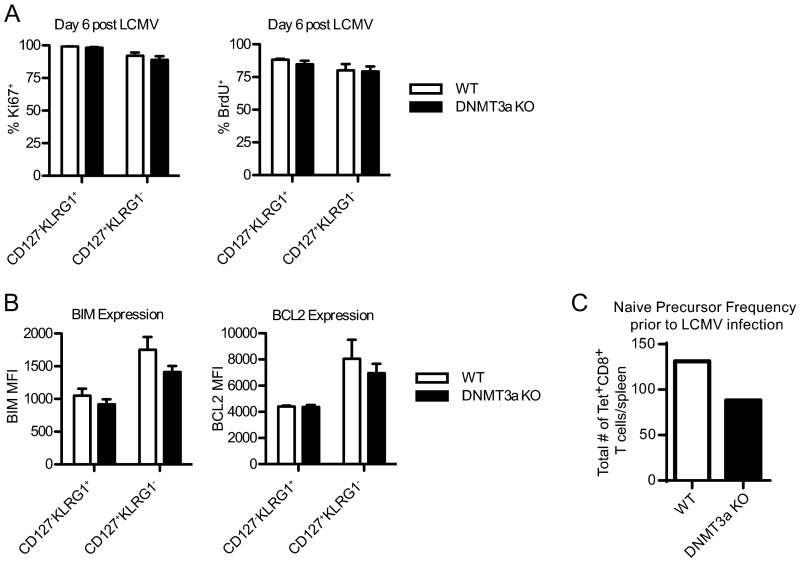
Strikingly, at the peak of the antiviral responses, we observed significant differences in the phenotype of the antigen-specific effector cells with significantly fewer KLRG1+ terminal effector cells (Fig. 1B) and increased CD127+KLRG1− memory precursor cells (Fig. 1C) in the absence of DNMT3a. Independent of the type of viral infection, the mice all showed the same pattern of differentiation: an increased frequency of CD127+KLRG1− cells and a decreased frequency of CD127−KLRG1+ cells in DNMT3a KO mice compared with WT. The increased proportion of CD127+KLRG1− memory precursor cells persisted during the contraction phase following LCMV infection (Fig. S1A) and was independent of the tissue analyzed (Fig. S1B). Importantly, the increased CD127+KLRG1− population in DNMT3a KO mice was not explained by enhanced proliferation (as assessed by Ki-67 stain and BrdU incorporation) (Fig. S2A) nor by differences in expression of pro- or antiapoptotic proteins (BIM and BCL-2) (Fig. S2B). Also, the increase in the memory precursor population could not be explained by a higher initial T-cell precursor frequency in DNMT3a KO mice as assessed by tetramer-enrichment analysis (Fig. S2C).
Fig. S2.
DNMT3a loss does not affect CD8+ T-cell proliferation, survival, or precursor frequency. (A and B) WT or DNMT3a KO littermate mice were infected with LCMV and splenocytes were isolated 6 d later. Some mice were administered BrdU in their drinking water for 1 d before being killed. Antigen-specific gp33–41-specific CD8+ T cells were detected by H-2Db gp33–41-tetramer and surface stained for CD127 and KLRG1 along with intracellular Ki67 (A, Left) and anti-BrdU (A, Right), BIM (B, Left), or BCL2 (B, Right). All bar graphs display mean ± SEM, n = 4 mice per group. No differences are statistically significant. This experiment was performed three times with similar results. (C) Naïve gp33–41-specific CD8+ T-cell number before LCMV infection was determined by staining pooled lymphocytes from the spleens and lymph nodes of naïve WT or DNMT3a KO mice with H-2Db gp33–41-tetramer-PE. Tetramer+ T cells were enriched by magnetic separation following incubation with anti-PE microbeads. No increase in number of naïve gp33–41-specific CD8+ T cells was seen in DNMT3a KO mice.
Differentiation Effects Following Loss of DNMT3a Expression Are Intrinsic to CD8+ T Cells.
To determine whether the effects of DNMT3a are intrinsic to CD8+ T cells, we performed adoptive transfer experiments using T-cell receptor transgenic (TCR-Tg) mice. OT1 (TCR specific for Ova257–264) DNMT3a KO CD8+ T cells were compared with Cre-negative littermate control WT OT1 T cells following adoptive transfer into congenic WT mice. We adoptively transferred 500 DNMT3a KO or WT OT1 T cells to simulate the frequency of the endogenous T-cell repertoire (6) and to avoid the nonphysiologic effects on effector differentiation observed using transfer of large numbers of TCR-Tg T cells (5). Following VacOva infection, there was no difference in absolute number of DNMT3a KO OT1 T cells compared with WT OT1 T cells during early expansion (day 4), at the peak of T-cell expansion (day 8), and during the contraction phase (day 20) (Fig. 1D). However, a significantly greater proportion of the KO OT1 T cells were CD127+KLRG1− memory precursor cells and significantly fewer were CD127−KLRG1+ terminal effector cells at Day 8 and Day 20 (Fig. 1E). Conversely, when WT P14 TCR-Tg cells (specific to LCMV gp33–41) were transferred into a WT or DNTM3a KO host, the P14 effector/memory precursor balance developed normally (Fig. 1F). Meanwhile, the endogenous host CD8+ gp33–41-specific T cells in recipient DNMT3a KO mice showed the consistent increase in the CD127+KLRG1− memory precursor cells and decrease in the CD127−KLRG1+ terminal effector cell population seen in the absence of WT P14 adoptive transfer (Fig. 1F). Taken together, these data provide strong evidence for a cell intrinsic effect of DNMT3a on effector/memory precursor development.
DNMT3a KO Mice Clear Acute Infections and Have Evidence of Improved CD8+ T-Cell Memory.
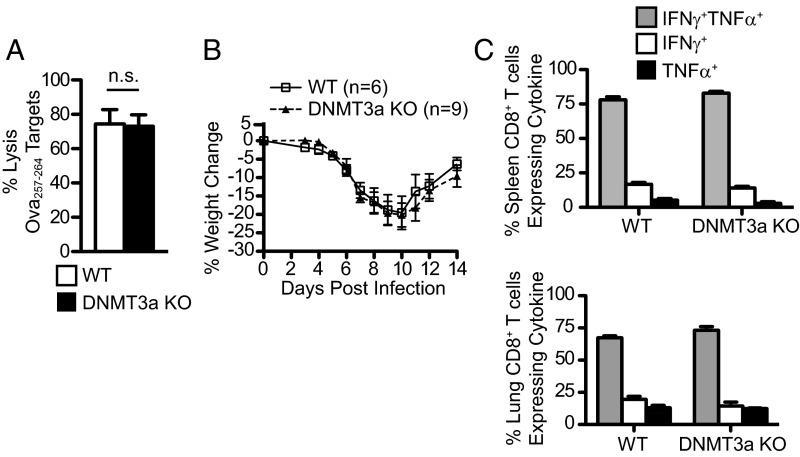
As effector CD8+ T-cell differentiation can be influenced by antigen load and inflammation, we determined whether DNMT3a deficiency affected CD8+ T-cell effector function and viral clearance. T-cell lytic function, measured by in vivo cytotoxic T lymphocyte (CTL) assay 7 d after VacOva infection, demonstrated no difference in specific target lysis between WT and DNMT3a KO mice (Fig. S3A). Additionally, intranasal influenza infection with a dose sublethal to WT mice resulted in no differences in weight loss between WT and DNMT3a KO mice (Fig. S3B) and elicited similar influenza NP366–374 peptide-specific cytokine production from CD8+ T cells isolated from spleen and lungs (Fig. S3C). Thus, loss of DNMT3a expression in T cells does not significantly impair acute functional responses to viral infection.
Fig. S3.
DNMT3a expression is dispensable for acute CD8+ T-cell function in response to viral infection. (A) Cohorts of DNMT3a WT or KO mice were infected with VacOva and T-cell lytic function was measured 7 d later by in vivo lysis of adoptively transferred eFluor 450high-labeled Ova257–264-pulsed splenocytes and eFluor 450low-labeled control splenocytes. Bar graph (mean ± SEM) compares specific lysis in WT (n = 10) and DNMT3a KO (n = 6) mice. This experiment was performed three times with similar results. (B) WT and DNMT3a KO mice were infected with influenza PR8 intranasally and followed for weight loss and survival. Mean ± SEM weight versus day postinfection is shown. This experiment was performed two times with similar results. (C) Cytokine production (mean ± SEM) 10 d postinfluenza PR8 infection from lung-resident lymphocytes measured by intracellular cytokine staining 6 h after stimulation with T2-Db cells presenting NP366–374-peptide. N = 5 mice per group. This experiment was performed three times with similar results. n.s. = P > 0.05 (unpaired two-tailed Student’s t test).
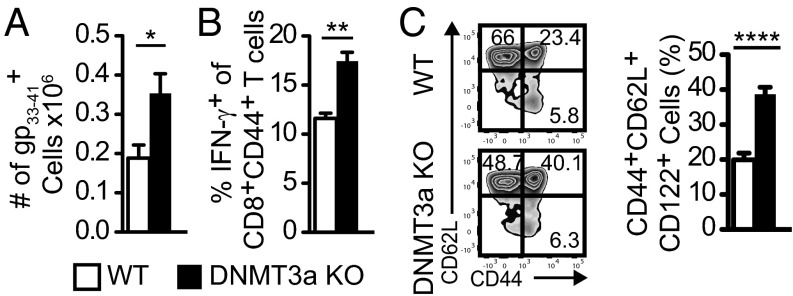
We next determined if the increase of CD127+KLRG1− memory precursor cells during the acute infection resulted in increased T-cell memory responses. LCMV-infected WT and DNMT3a KO mice were assessed for their CD8+ T-cell memory response 60 d after infection. Indeed, DNMT3a KO mice had increased numbers of gp33–41-specific CD8+ T cells compared with WT mice as assessed by tetramer staining (Fig. 2A) and cytokine secretion (Fig. 2B). We also compared endogenous spontaneous arising memory cells from aged WT and KO mice that had not been subject to experimental infection. Splenocytes from DNMT3a KO mice greater than 6 mo old had a significantly greater proportion of CD8+ T cells with a central memory phenotype compared with age-matched WT mice (Fig. 2C). Together, these data show that DNMT3a-deficient T cells expand normally, acquire effector function normally, but have a significant enhancement of cells with a prememory phenotype at the expense of those having a terminal effector phenotype.
Fig. 2.
DNMT3a KO mice have evidence of improved CD8+ T-cell memory. (A) Absolute number of gp33–41-tetramer+CD8+ T cells in the spleen of WT or DNMT3a KO littermate mice 60 d post-LCMV infection. Bar graphs (mean ± SEM) compare WT (n = 4) and DNMT3a KO (n = 4) mice. (B) IFN-γ production after ex vivo gp33–41 peptide stimulation from splenocytes from day 60 LCMV-infected mice. Bar graphs (mean ± SEM) compare WT (n = 4) and DNMT3a KO (n = 4) mice. (C) Splenocytes from 6-mo-old littermate WT or DNMT3a KO mice were stained for markers of central memory T cells. Representative plots of CD62L versus CD44 are gated on CD8+ T cells. Bar graph (mean ± SEM) compares WT (n = 9) and DNMT3a KO (n = 13) mice. All experiments in A–C were performed three times with similar results. For all panels, *P < 0.05, **P < 0.01, ****P < 0.0001 (unpaired two-tailed Student’s t test).
DNMT3a Controls the CD127−KLRG1− Early Effector Cell Transition to CD127+KLRG1− Memory Precursor Cells or CD127−KLRG1+ Terminal Effector Cells.
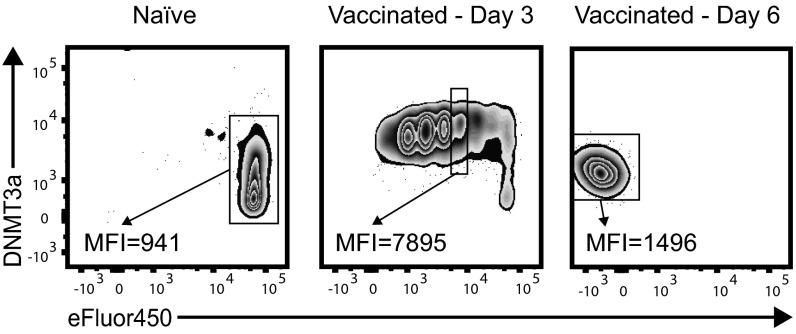
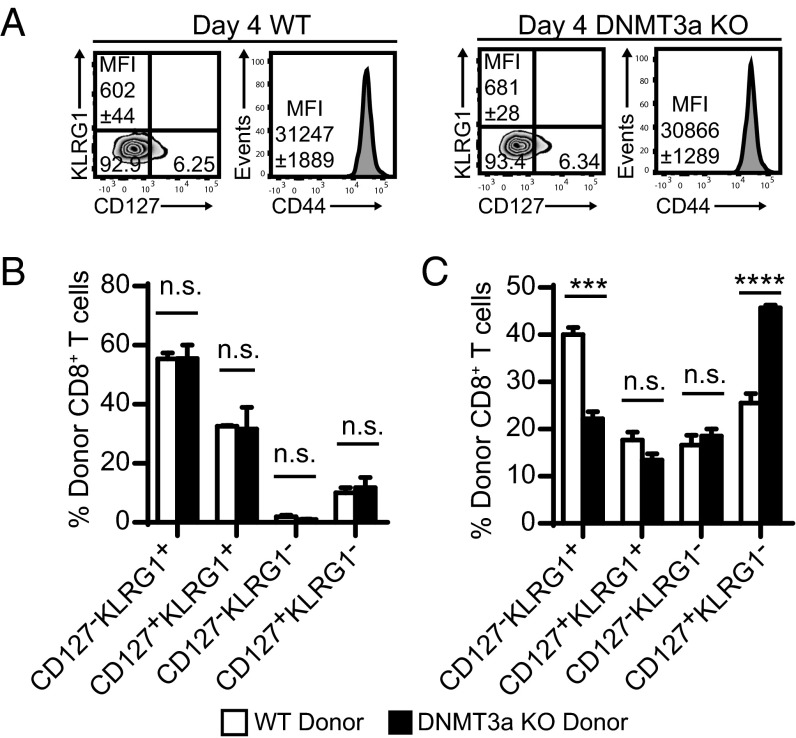
The primary factor regulating DNMT3a expression in CD8+ T cells is TCR stimulation (18). CD8+ T cells have very low DNMT3a expression in naïve cells with up-regulation upon stimulation that peaks during early activation (Fig. S4). Based on this expression pattern, we hypothesized that the predisposition toward becoming a CD127+KLRG1− memory precursor cell could be manifest early following activation in DNMT3a KO mice. Upon activation, naïve CD8+ cells proceed from a CD127+ state to become early effector cells that are CD127−. Using OT1 adoptive transfer, day 4 early effector CD8+ T cells from both WT and DNMT3a KO T cells equally down-regulate CD127 and up-regulate CD44 (Fig. 3A). Thus, no difference in the transition from naïve to early effector CD8+ T cells was noted between WT and DNMT3a KO T cells.
Fig. S4.
Kinetics of DNMT3a expression after activation. WT OT1 CD8+ T cells were adoptively transferred into congenic hosts. Splenocytes were isolated 3 or 6 d after infection with VacOva. Representative plots are gated on CD8+Thy1.1+ T cells from uninfected (Left) or VacOva-infected (Middle and Right) mice. MFI, DNMT3a mean fluorescence intensity in transferred OT1 T cells that were either naïve and undivided, in the third division 3 d postinfection, or had undergone multiple divisions 6 d postinfection. n = 3 mice per group. This experiment was performed three times with similar results.
Fig. 3.
DNMT3a controls the CD127−KLRG1− early effector cell transition to CD127+KLRG1− memory precursor or CD127−KLRG1+ terminal effector cell. (A) Representative flow plots of CD127 and KLRG1 staining and CD44 staining gated on WT OT1 or DNMT3a KO OT1 CD8+ T cells 4 d following adoptive transfer and VacOva infection. Mean fluorescence intensity (MFI) of CD127 expression and CD44 expression is noted on the respective plots. Plots are representative of four mice per group. (B) Phenotype of WT or DNMT3a KO gp33–41-specific CD127−KLRG1+ terminal effector cells 7 d after adoptive transfer into congenic hosts. Bar graphs (mean ± SEM) compare WT (n = 4) and DNMT3a KO (n = 3). (C) Phenotype of WT or DNMT3a KO gp33–41-specific CD127−KLRG1− early effector cells 4 d after adoptive transfer into synchronously infected WT hosts. Bar graphs (mean ± SEM) compare WT (n = 4) and DNMT3a KO (n = 4). All experiments in A–C were performed three times with similar results. n.s. P > 0.05, ***P < 0.0005, ****P < 0.0001 (unpaired two-tailed Student’s t test).
Importantly, and in contrast to the role of DNMT3a in stabilizing the phenotype and limiting the plasticity of CD4+ Th2 cells (20), DNMT3a KO CD127−KLRG1+ terminal effector cells did not show increased plasticity. Sorted gp33–41-specific CD127−KLRG1+ terminal effector cells from WT and DNMT3a KO mice 7 d post-LCMV infection were adoptively transferred into timed-infected recipient animals. There was no difference in the phenotype of WT versus DNMT3a KO donor cells in recipient animals 1 wk after transfer (Fig. 3B). Thus, DNMT3a is not required to maintain the terminal effector phenotype of emerging CD8+ T cells.
Next, we reasoned that DNMT3a may exert its critical role in CD127−KLRG1− early effector cells as they differentiate into either CD127+KLRG1− memory precursor cells or CD127−KLRG1+ terminal effector cells (2, 3). To test this possibility, we sorted gp33–41-specific CD127−KLRG1− early effector cells from day 6 LCMV-infected WT or DNMT3a KO donor mice, adoptively transferred them into synchronously infected host WT mice, and assessed their differentiation in vivo 4 d later. The proportion of CD127+KLRG1− memory precursor cells increased significantly with a commensurate decrease in the CD127−KLRG1+ terminal effector cell population comparing DNMT3a KO T cells to WT T cells (Fig. 3C). These experiments demonstrate a critical function of DNMT3a in regulating the transition from CD127−KLRG1− early effector cells to CD127+KLRG1− memory precursor cells or CD127−KLRG1+ terminal effector cells.
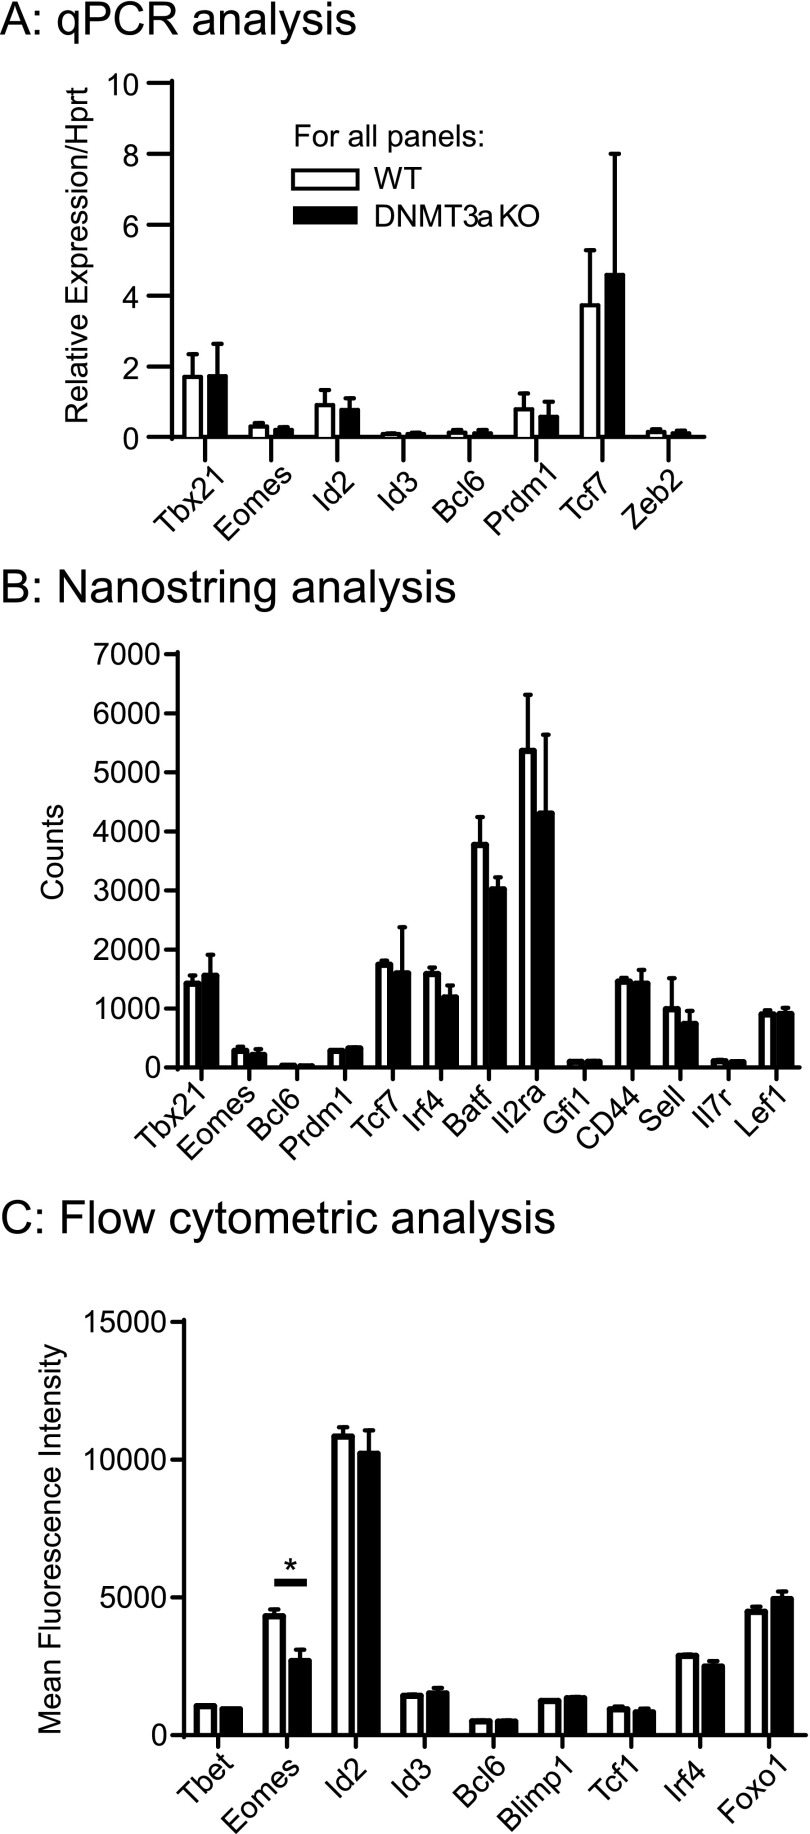
Many transcription factors have functions in the generation of memory precursor or terminal effector CD8+ T cells, including Id2, Id3, Tcf1, Tbet, Eomes, Blimp1, Zeb2, Bcl6, Irf4, Batf, Gfi1, and Foxo1 (24–26). We sorted CD127−KLRG1− early effector cells from VacOva- and LCMV-infected WT and DNMT3a KO mice and assessed expression of these transcription factors using nanoString, quantitative PCR (qPCR), and/or flow cytometry. A small 1.6-fold increase in Eomes protein expression was noted by flow cytometry in WT T cells (Fig. S5C), but this was not related to differences in Eomes transcription between WT and DNMT3a KO T cells. We observed no other significant differences in expression among the T-cell transcription factors we examined (Fig. S5). As IL-2 signaling can impact CD127−KLRG1+ terminal effector cell differentiation (10, 27), we also measured Il2ra transcript expression and saw no difference between WT and DNMT3a KO T cells (Fig. S5B). A broader analysis of 547 immune-related genes using nanoString technology resulted in 18 genes with significantly different expression; however, 17 of these were less than 2-fold different. Only CD79b had 2.47-fold higher expression in DNMT3a KO T cells (Dataset S1). These findings indicate DNMT3a expression is dispensable for early signaling-related changes in transcription following T-cell activation. It also suggests a model where DNA methylation mediated by DNMT3a and generated as a result of early signaling influences later time points in the differentiation of effector and memory CD8+ T cells.
Fig. S5.
DNMT3a loss does not affect CD8+ early effector cell expression of critical transcription factors or IL2ra. Expression of indicated transcription factors/key genes was measured by: (A) Quantitative PCR of cDNA from adoptively transferred OT1 DNMT3a WT and KO early effector cells sorted 4 d after VacOVA infection, normalized to Hprt expression. Bar graphs show the mean ± SD of expression from cells sorted from individual mice. (WT n = 10, DNMT3a KO n = 9 individual mice). No significant differences were seen between the groups. (B) Nanostring analysis of RNA from adoptively transferred WT and DNMT3a KO OT1 early effector cells sorted 4 d after VacOva infection (mean ± SD, n = 3 individual mice per group). No signficant differences were observed between the groups. (C) Flow cytometry gated on CD8+ gp33–41-specific CD127−KLRG1− early effector cells from WT and DNMT3a KO mice 5 d following LCMV infection. Indicated proteins were detected by intracellular staining after fixation and permeabilization. (MFI ± SEM, n = 3 mice per group). *P < 0.05.
Seeking insight into the genes potentially regulated by DNMT3a-mediated DNA methylation, we performed a whole genome methylation analysis using methyl-CpG binding domain sequencing (MBD-seq). This uses recombinant MBD protein to selectively enrich for genomic DNA fragments containing methylcytosine and identifies them using high throughput sequencing (28). Methylation analysis was performed on four sorted populations of CD8+ OT1 T cells: naïve CD62L+CD44− OT1 cells from WT and DNMT3a KO mice and activated WT and DNMT3a KO OT1 cells isolated 8 d after adoptive transfer and VacOva infection. We identified between 86,988 and 95,051 regions of genomic DNA methylation in each sample; however, the vast majority of these were common to all samples. We filtered the list to include methylation sites present only in WT day 8 T cells but not in WT naïve, DNMT3a KO naïve, or DNMT3a KO day 8 T cells, thus, leaving only activation-induced, DNMT3a-dependent de novo methylation sites. This filtering yielded 8,600 regions (Dataset S2), including 1,134 regions in gene promoters (defined as within 5 kb upstream or 2 kb downstream of transcription start sites) (Dataset S3). We examined the intersection of this subset with a list of genes whose expression is acutely down-regulated with T-cell activation (4); a short list of 19 genes with expression potentially inhibited by gene promoter DNA methylation was identified. Notably this list includes the critical T-cell memory gene Tcf7 (Dataset S4).
DNMT3a Establishes a CpG DNA Methylation “Signature” of Terminal Effector Cells During the Early Effector Cell Stage in the Tcf7 Promoter.
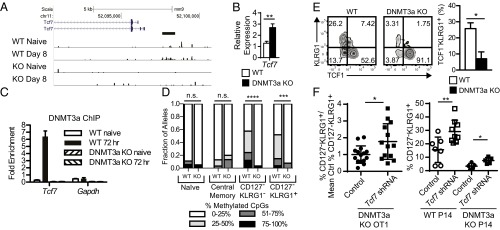
As shown above, the initial transcriptional regulation of key regulators of CD127−KLRG1− early effector cell differentiation is not dependent on DNMT3a. However, we hypothesized that DNMT3a-mediated methylation of some genes suppressed during early activation may be critical to prevent their reexpression, which could shape the cell’s capacity to acquire a terminal effector phenotype. Tcf7, which encodes the Tcf1 protein, has high expression in naïve CD8+ T cells and drops quickly following activation, resulting in low Tcf1 expression in CD127−KLRG1+ terminal effector cells (29, 30). Memory T cells regain high expression of Tcf1, similar to naïve T cells (11). Furthermore, T cells lacking all Tcf1 expression are impaired in memory T-cell differentiation (11, 31, 32). Based on our MBD-seq results (Fig. 4A), we hypothesized that the Tcf7 gene is one of the targets of selective de novo DNA methylation in early effector T cells. Defective Tcf7 silencing in DNMT3a KO CD8+ T cells could generate more CD127+KLRG1− memory precursor cells with fewer CD127−KLRG1+ terminal effector cells.
Fig. 4.
DNMT3a establishes a CpG DNA methylation signature of terminal effector cells during the early effector cell stage in the Tcf7 promoter. (A) Tracks depicting MBD-seq reads from indicated samples are plotted at the Tcf7 promoter in the University of California Santa Cruz genome browser. A region of differential methylation is indicated below the Tcf7 promoter as a horizontal bar. (B) Relative qPCR expression of Tcf7 transcripts from sorted Ova257–264-specific CD8+ T cells post VacOva infection. Bar graphs (mean ± SEM) show the relative expression (normalized to 18s RNA expression) from individual mice (n = 4 per group). This experiment was performed three times with similar results. (C) ChIP of DNMT3a from WT or DNMT3a KO CD8+ T cells that were freshly isolated naïve cells or activated 72 h in vitro. Bar graphs (mean ± SD) compare WT and DNMT3a KO, naïve and 72-h stimulated samples (n = 3 replicates per qPCR) and depict fold-enrichment compared with control IP for indicated gene targets. The experiment was performed three times with similar results. (D) Tcf7 promoter methylation determined by bisulfite sequencing in sorted polyclonal naïve and central memory CD8+ T cells and day 6 post-VacOva CD127−KLRG1− and CD127−KLRG1+ CD8+ WT or DNMT3a KO OT1 T cells. Bar graphs depict fraction of alleles with indicated frequency of methylated CpG sites of the 18 possible per clone. Number of unique alleles sequenced per sample was between 15 and 33. Distributions were compared by Mann–Whitney test. ***P < 0.0005, ****P < 0.0001. The experiment was performed two times with similar results. (E) Representative plots of KLRG1 surface and Tcf1 intracellular staining of adoptively transferred WT or DNMT3a KO OT1 CD8+ T cells 10 d post-VacOva infection. Numbers indicate percentage in each quadrant. (Right) Bar graphs (mean ± SEM) compare WT (n = 4) and DNMT3a KO (n = 4). The experiment was performed three times with similar results. (F) Normalized frequency of CD127−KLRG1+ DNMT3a KO OT1 T cells (%CD127−KLRG1+/mean of control % CD127−KLRG1+ from an individual experiment) transduced with the indicated lentivirus constructs 7 d after adoptive transfer into recipients infected with VacOva. Normalized frequencies from individual mice, mean, and SD are shown; control (n = 15) and Tcf7 shRNA (n = 13) are pooled from three independent experiments (Left). Frequency of CD127−KLRG1+ WT or DNMT3a KO P14 T cells transduced with the indicated lentivirus constructs 7 d after adoptive transfer into recipients infected with LCMV (Right). *P < 0.05, **P < 0.01 (unpaired two-tailed Student’s t test).
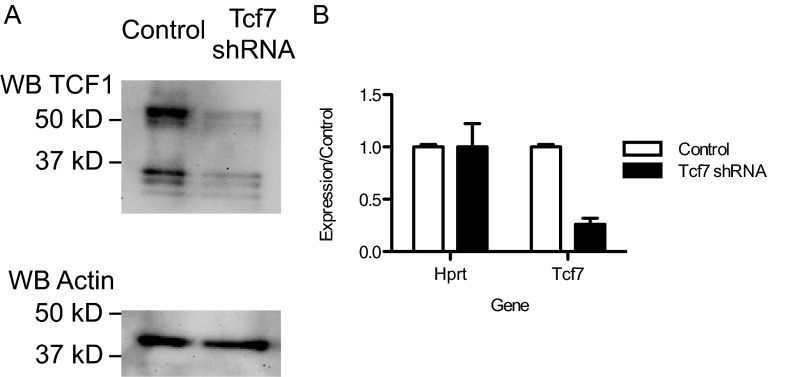
Consistent with defective Tcf7 silencing, experiments showed increased Tcf7 transcript in sorted Ova257–264-tetramer+ T cells from DNMT3a KO mice 8 d after VacOva infection compared with those from WT mice (Fig. 4B). Next, we demonstrated DNMT3a localization to the Tcf7 promoter by ChIP following T-cell activation. DNMT3a was not bound to the Tcf7 promoter region in naïve WT or DNMT3a KO T cells but binding was seen in activated WT but not in activated DNMT3a KO CD8+ T cells (Fig. 4C). No enrichment of DNMT3a was observed at the highly expressed Gapdh gene promoter. To determine if DNMT3a is functional at the Tcf7 promoter in the activated WT CD8+ T cells, we compared CpG methylation in the Tcf7 promoter via bisulfite sequencing from sorted WT and DNMT3a KO T-cell populations: CD62L+CD44− naïve, CD62L+CD44+ central memory (both of which have high Tcf1 expression), CD127−KLRG1− early effector cells (mix of high and low Tcf1 expression), and CD127−KLRG1+ terminal effector cells (low Tcf1 expression) isolated 6 d post-VacOva infection. Very few CD127+KLRG1− memory precursor cells are present at this time following infection. Minimal CpG DNA methylation was observed in both naïve and central memory CD8+ T cells from WT or DNMT3a KO mice, correlating with high Tcf1 expression in these populations. In contrast, WT CD127−KLRG1− early effector cells and WT CD127−KLRG1+ terminal effector cells showed significantly increased Tcf7 promoter CpG methylation compared with naïve T cells or DNMT3a KO T cells (Fig. 4D). The increased Tcf7 promoter methylation inversely correlates with Tcf1 protein expression in CD8+ T cells. Notably, after OT1 transfer and VacOva infection, DNMT3a KO CD8+ T cells have a smaller proportion of cells that are Tcf1loKLRG1+ compared with WT (Fig. 4E). In addition, knockdown of Tcf7 expression using lentivirus expressing shRNA (Fig. S6) in activated DNMT3a KO OT1 T cells or in DNMT3a KO P14 T cells partially reverted their phenotype, resulting in an increased percentage of CD127−KLRG1+ terminal effector cells following adoptive transfer and either VacOva or LCMV infection, respectively (Fig. 4F). These data provide strong evidence that DNMT3a mediates a de novo methylation signature in a key memory-associated gene during the CD127−KLRG1− early effector cell stage, and that such a signature persists in terminal effector cells but is not present in memory T cells.
Fig. S6.
Tcf7 shRNA specifically decreases expression of Tcf1 protein and Tcf7 mRNA. (A) The murine lymphoma line EL4, which constitutively expresses high levels of Tcf1 protein, was transduced with control lentivirus or lentivirus expressing Tcf7 shRNA. Transduced GFP+ cells were isolated by FACS sorting and whole cell lysates were prepared, separated by SDS/PAGE, and transferred to PVDF membranes. Tcf1 expression was detected by Western blot, and then the membrane was stripped and reprobed to measure Actin expression. One of three experimental replicates with representative results is shown. (B) DNMT3a KO OT1 T cells were activated in vivo by VacOva infection, isolated after 48 h, and transduced with control or Tcf7 shRNA expressing lentivirus in vitro. GFP+ transduced cells were isolated by FACS sorting after 48 h and RNA was extracted and converted to cDNA. Expression of Hprt and Tcf7 transcripts was measured by Taqman qPCR using 18S RNA expression to normalize input. Target gene expression is normalized to that of control transduced cells. Plots depict mean ± SD of triplicate technical replicates.
Discussion
We have sought to determine the role DNMT3a-mediated de novo methylation plays in CD8+ T cells following activation and during differentiation. Our findings support a model where DNMT3a expression peaks early following CD8+ T-cell activation and establishes de novo CpG methylation in gene regulatory regions that influence cell fate decisions. Whereas this de novo methylation does not appear to control early changes in expression of key transcription factors, it does contribute to later transcription factor expression patterns that influence the proportion of CD8+ T cells destined to become CD127+KLRG1− memory precursor cells or CD127−KLRG1+ terminal effector cells. This process is illustrated by the DNMT3a-mediated de novo methylation of the Tcf7 promoter during the early effector cell stage. DNMT3a establishes a methylation signature found in terminal effector cells which maintain low Tcf1 expression and is not found in memory T cells that reexpress Tcf1 at high levels. The resulting phenotype is consistent across three different models of viral infection and in experiments performed independently in two different laboratories.
In contrast to the role of DNMT3a reported for CD4+ T cells (19, 20), we did not find evidence of increased plasticity or instability of cell phenotype in differentiated CD8+ T cells. We and others have shown that DNMT3a is required to stably silence expression of cytokines with polarized expression such as IFN-γ in CD4+ Th2 cells and IL-13 in Th1 cells (19, 20). Whereas not specifically attributed to DNMT3a, differential methylation patterns are also observed between CD4+ naïve and CD4+Th17 T cells at the Il17a locus (33). These features in CD4+ T cells suggest DNMT3a’s role is to maintain polarization/differentiation established via other epigenetic mechanisms, e.g., histone modifications. In the experiments we report here with CD8+ T cells, DNMT3a expression is required to develop normal proportions of effector and memory precursor phenotypes. However, when DNMT3a KO T cells differentiate into terminal effector cells, their fate appears to be “locked in” based on our adoptive transfer experiments. Interestingly, the DNMT3a-mediated effects localize to the early effector cell stage when CD8+ T cells remain susceptible to alteration of their potential fates depending on their current inflammatory milieu (2).
Whereas our data provide important insights into the role DNMT3a plays in the CD8+ T-cell differentiation process, other epigenetic regulatory mechanisms appear to function normally in the DNMT3a KO T cells. The paucity of gene expression differences between WT and DNMT3a KO early effector cells supports this, as does the ability of DNMT3a KO T cells to generate some (although fewer) CD127−KLRG1+ terminal effector cells. Our observations are consistent with a mechanism described in other cell types in which histone modifications are established first, followed by DNA methylation (34). How the processes of DNA methylation and repressive histone modifications are linked in T cells remains a subject of active investigation.
We detail an epigenetic signature established by DNTM3a in the Tcf7 promoter. Scharer et al. reported global methylation patterns observed in CD8+ T cells comparing naïve and day 8 effector T cells (17). Our data provide strong evidence that DNMT3a mediates these de novo methylation changes in T cells. Their extensive analysis indicates multiple genes that are modified by methylation following activation, one of which was Tcf7. We focused our analysis by restricting target genes to those undergoing de novo promoter DNA methylation following activation, however we expect that many other gene targets are regulated by de novo DNA methylation in nonpromoter regions such as intragenic enhancers. Analysis of such targets is ongoing.
Finally, little is known in T cells about what targets DNMT3a to regions of DNA that become de novo methylated. As key genes such as Tcf7 appear to be regulated in part by DNA CpG methylation, we hypothesize that transcriptional repressors may complex with DNMT3a directly or indirectly to target its activity to specific genes. One possible binding partner is G9a (Ehmt2), which catalyzes the repressive H3K9me2 histone mark and has been shown to complex with DNMT3a in stem cells and direct DNA de novo methylation (34). G9a has also been shown to complex with transcriptional repressors in T cells—specifically Blimp1 (35) and Gfi1 (36) along with other epigenetic-modifying enzymes such as HDAC1. As described by Scharer et al. (17), particular transcription factor motifs are also more frequently found in methylated regions of DNA in CD8+ T cells. It remains to be shown if any such transcription factors directly form complexes with DNMT3a and the DNA methylation machinery following T-cell activation, as has been suggested by in vitro studies of recombinant DNMT3a (37).
In summary, our work provides important first insights into the role of DNMT3a in mediating key differentiation pathways in CD8+ T cells following activation. Specifically, DNA methylation events occur during the early effector cell stage and influence the formation of daughter memory precursor or terminal effector cells. This effect on CD8+ T-cell differentiation contrasts with its reported role in CD4+ T cells where loss of DNMT3a expression results in more plasticity in polarized populations. An important area of inquiry for the future is to identify mechanisms that target DNMT3a to particular genomic locations in response to T-cell activation.
Materials and Methods
Mice.
All mouse experiments were performed according to protocols approved by the Institutional Animal Care and Use Committees of Johns Hopkins University (Baltimore) and Cincinnati Children’s Hospital Research Foundation (Cincinnati, OH). Detailed mouse strain information is provided in SI Materials and Methods.
Flow Cytometry.
Cell processing techniques and a complete list of antibodies used for staining is provided in SI Materials and Methods.
Gene Expression Analysis.
Specified T-cell populations from individual mice were directly sorted into RLT lysis buffer (Qiagen) for subsequent RNA purification. Purified RNA was converted to cDNA and analyzed using qPCR with specified Taqman primer/probe sets (Applied Biosystems). Additional experimental details are provided in SI Materials and Methods.
ChIP Analysis.
DNMT3a ChIP was performed as previously described (20). Primer sequences are provided in SI Materials and Methods.
DNA Methylation Analysis.
Samples used for MBD-seq were processed as previously described (38) with additional experimental details in SI Materials and Methods. For bisulfite sequencing, DNA was bisulfite treated using the EpiTect bisulfite kit (Qiagen). Bisulfite-specific primer sequences are provided in SI Materials and Methods. The PCR product was purified and cloned using TOPO TA cloning vector kit (Life Technologies). Sequences of 30–40 individual clones per sample were compared with published genomic sequence using BiQAnalyzer (39). Only unique clones were retained for final analysis.
Statistical Analysis.
Data were analyzed using GraphPad Prism software. Student’s t test was used to compare WT and DNMT3a populations. The Mann–Whitney test was used to compare CpG methylation data.
SI Materials and Methods
Mice.
Wild-type C57BL/6 mice were purchased from The Jackson Laboratory. DNMT3a2loxp/2loxp mice (generously provided by E. Li; Novartis Pharmaceuticals, Basel, Switzerland) were backcrossed more than 12 generations with C57BL/6 mice. C57BL/6 T-cell conditional DNMT3a KO mice (18) were generated by crossing homozygous DNMT3a2loxp/2loxp mice with C57BL/6 mice expressing Cre-recombinase under the control of the CD4 promoter (21) or the dLck promoter (22) (The Jackson Laboratory). Experiments compare littermate Cre-negative WT mice with Cre-positive DNMT3a KO mice. Thy1.1+ C57BL/6 TCR transgenic mice expressing the OT1 TCR (specific to the H-2Kb-restricted Ova257–264 peptide from chicken ovalbumin, The Jackson Laboratory) or CD45.2 C57BL/6 mice expressing the P14 TCR (specific to the H-2Db-restricted LCMV gp33–41 peptide, a gift from Michael Jordan, Cincinnati Children’s Research Foundation, Cincinnati, OH) were crossed with the DNMT3a KO mice.
Viral Infection Models.
Ova-expressing vaccinia virus (VacOva) is a recombinant attenuated vaccinia virus strain expressing full-length chicken ovalbumin (23) given in a dose of 106 pfu i.v. by retroorbital injection. Mice infected with lymphocytic choriomeningitis virus (LCMV Armstrong strain) were administered 2 × 10⁵ pfu intraperitoneally. Influenza-infected mice were given intranasal inoculation with 5 × 10⁴ egg-infective dose influenza strain PR8 (Charles River). Mice were weighed daily and killed if weight loss was >30% of baseline.
Flow Cytometry.
Single cell suspensions were made from spleens by mechanical disruption through a 70-µm cell filter. Single cells from lungs were obtained by perfusing lungs with 10 mL of HBSS, harvesting lungs and digesting for 30 min with Collagenase IV (Roche)/DNase (Roche) digest solution. Cells were incubated with anti-mouse CD16/CD32 to block Fc receptors (eBioscience) and viability stain was performed using eFluor 780 fixable live/dead stain (eBioscience). Antibodies specific to the following antigens were used for cell surface staining: (from BD Biosciences) CD44 (clone IM7), CD62L (clone MEL-14), Thy1.1 (clone HIS51), CD45.2 (clone 104), CD45.1 (clone A20), and CD122 (clone TM-β1); (from eBioscience) CD127 (clone A7R34), KLRG1 (clone 2F1); and (from BioLegend) CD8α (clone 53–6.7). Intracellular staining used TNF-α (clone MP6-XT22; BD Biosciences), IFN-γ (clone XMG1.2; BD Biosciences), BIM (clone C34C5; Cell Signaling Technology), BCL-2 (grown in-house), Ki-67 (clone SolA15; eBioscience), DNMT3a (H-295; Santa Cruz Biotechnology), TCF1 (clone C63D9; Cell Signaling Technology), Id2 (polyclonal ab85990; Abcam), Id3 (clone D16D10; Cell Signaling Technology), Bcl-6 (clone K112-91; BD Biosciences), Irf4 (clone 3E4; eBioscience), Foxo1 (clone C29H4; Cell Signaling Technology), Tbet (clone 4B10; BioLegend), Eomes (clone Dan11mag; eBioscience), and Blimp1(clone C14A4; Cell Signaling Technology). Goat anti-rabbit IgG Alexa Fluor 488 (Life Technologies) was used as secondary antibody to stain for DNMT3a and TCF1. In vivo proliferation was assessed by first staining cells with the proliferation dye eFluor 450 (eBiosciences). MHC I tetramer staining was performed using streptavidin-conjugated H-2Kb-Ova257–264 (MBL International), H-2Db-influenza nucleoprotein366–374 (NIH Tetramer Core), and H-2Db-LCMV gp33–41 (produced in-house). Intracellular cytokine staining was performed using the Fixation/Permeabilization Solution Kit (BD Biosciences). Intracellular protein stain was performed using the Foxp3/Transcription Factor staining buffer set (eBiosciences). Naïve and memory T-cell populations were defined as: naïve (CD8+CD62L+CD44−CD127+), central memory (CD8+CD62L+CD44+CD122+), and effector memory (CD8+CD62L−CD44+). Data were acquired using a BD LSR2 or BD Fortessa multicolor flow cytometer. Data were analyzed using FACSDiva (BD Biosciences) and FloJo software.
Functional Studies.
For in vivo CTL assay, congenic Thy1.2 splenocytes were isolated and incubated with the H-2Kb-restricted Ova257–264 peptide or no peptide. After incubation, peptide-pulsed splenocytes were differentially labeled with the eFluor 450 dye (eFluor450lo cells = Ova257–264 peptide-pulsed, eFluor450hi cells = no peptide control) and injected into control or VacOva-infected mice. After 8 h, mice were killed and analyzed by flow cytometry collecting >5,000 eFluor 450hi cells. The percent-specific lysis was calculated using the following formula: % specific lysis = 1 − [rnaive/rinfected] × 100 where r = (% eFluor450lo cells) ÷ (% eFluor450hi cells). Peptide-specific in vitro cytokine production was assessed following a 4- to 6-h incubation of isolated immune cells with designated peptides in the presence of brefeldin A (BD Biosciences).
Tetramer Enrichment of Naïve T Cells.
The 3 × 10⁸ splenocytes from pooled WT or DNMT3a KO mice (n = 5–6 per group) were Fc blocked and stained with PE-conjugated H-2Db-LCMV gp33–41-tetramer for 60 min at 4 °C. Cells were washed and stained with anti-PE coupled MACS MicroBeads (Miltenyi Biotec) for 30 min with occasional shaking at 4 °C. Cells were then washed and the tetramer-bound cells enriched on a magnetized MACS column (Miltenyi Biotec). After elution of the positive fraction from the column, cells were stained for markers used to enhance gating of tetramer+ CD8+ T cells (CD8 and CD3 as a positive gate; B220, CD4, CD11b, and CD11c to exclude false positives), and to determine activation status (CD44, CD49d, CD122, and Ly6C). A total of 6 million events per group were collected by flow cytometry. Total tetramer+ cells per spleen were extrapolated based on initial cell counts.
Primer Sequences.
For ChIP experiments: primers used for SYBR Green quantitative PCR were Gapdh primers: forward 5′-CCTATCAGTTCGGAGCCCA-3′, reverse 5′-GCCCTGCTTATCCAGTCCTA and Tcf7 primers: forward 5′-CTGGCGGAGGATCAAAGAGA-3′, reverse 5′-AGGGCGCTGATAGGATCTGA-3′.
For DNA quantitation, a standard curve was generated by dilution of standardized purified mouse DNA.
For bisulfite sequencing, a 345-bp region of the Tcf7 promoter containing 18 CpG motifs located 950 bp proximal to the transcription start site was amplified by PCR using the following bisulfite-treated DNA primers: forward 5′-GTAAGGTTTGGTTTTTTTGATTTTT-3′, reverse 5′-TCTTCAATAACATCTCCTTAACACC-3′.
The nanoString Gene Expression Analysis.
RNA was purified from individual mice that had received WT or DNMT3a KO T-cells before infection (n = 3 per group). Purified RNA was checked for purity and quality and all samples had RNA integrity number (RIN) score of >9.5. RNA was hybridized and data acquired for gene expression using the nanoString nCounter mouse immunology code set by the Johns Hopkins Deep Sequencing and Microarray Core Facility. Expression data were analyzed using nSolver v2.6 software available from nanoString. Data were normalized by using as a correction factor of the geometric mean of the top 100 expressed genes. Genes whose expression was below 15 counts were not included in downstream analysis.
Gene Expression Analysis by qPCR.
Purified RNA was converted to cDNA using the SuperScript III Reverse Transcriptase (ThermoFisher Scientific). qPCR was performed by standard techniques with specified Taqman primer/probe sets (Applied Biosystems). We quantified relative gene expression levels standardized to expression levels of Hprt in each sample using the ΔCT method.
MBD-Seq Data and Analysis.
Splenocytes from DNMT3a WT and KO OT1 mice were stained for CD8, CD62L, and CD44 and naïve cells were sorted as CD8+CD62LhighCD44low. DNMT3a WT and KO OT1 cells were isolated 8 d after adoptive transfer and VacOva infection in WT Thy1.2 congenic hosts by staining splenocytes and flow sorting for CD8+Thy1.1+ cells. Genomic DNA was isolated from sorted T cells using the DNEasy kit (Qiagen) and submitted for MBD-seq analysis by the Next Generation Sequencing Center at the Sidney Kimmel Comprehensive Cancer Center at Johns Hopkins University. Details of the protocol have been previously published (38). DNA libraries were constructed using the NEBNext DNA Library Prep Set (New England Biolabs). Methylated regions were affinity enriched using 6xHis-MBD2-MBD protein immobilized on magnetic beads. The methylation-enriched fraction was amplified using 10–12 cycles using the NEBNext amplification module, and a nonenriched input fraction underwent 4–6 cycles of amplification. Samples were sequenced using a 5500xl Wildfire Genetic Analyzer. XSQ Tools was used to convert XSQ to CSFASTA+QUAL files using default parameters. SOLiD BioScope Software (Applied Biosystems) was used to align sequences to the mouse mm9 reference genome using default parameters. MACS-1.4.1 was used to identify peaks of methylation comparing sequence reads from enriched versus input libraries using the default P < 10−5 as a cutoff. BEDTools as implemented in the Galaxy platform was used to filter MACS peaks unique to the WT day 8 samples using the intersect function (Dataset S2). BEDTools intersect was also used to determine MACS peaks found in gene promoter regions (Dataset S3) using promoter genomic coordinates downloaded from University of California Santa Cruz genome browser and expanded 5,000 bp upstream and 2,000 bp downstream of transcription start sites using the slop function in BEDTools.
Published Gene Expression Data to Determine Down-Regulated Genes.
We analyzed the gene expression data previously published by Sarkar et al. (4), which is publically available in the GEO Database, series GSE10239. We compared expression between CD8 P14 naïve cells 1 and 2 (GSM257826 and GSM257827) and CD8 P14 d 4.5 postinfection KLRG1 Intermediate (Int)-sorted cells 1, 2, and 3 (GSM257832, GSM257833, and GSM257834). In the publication, the KLRG1 Int cells are analogous to the CD127−KLRG1− early effector cells we are describing. The gene list was sorted based on genes whose expression was down-regulated more than threefold from naïve cells to the day 4.5 cells. A total of 576 genes fit these criteria. This gene list was used to determine the 19 genes whose expression was down-regulated in CD127−KLRG1− early effector cells and whose promoter was de novo methylated (Dataset S4).
Tcf7 Knockdown by Lentiviral Transduction of T Cells with Tcf7 shRNA.
The pLKO.1 plasmid construct containing shRNA construct TRCN0000012678 targeting Tcf7 generated by the Broad Institute’s Genetic Perturbation Program was obtained from the Johns Hopkins University ChemCORE. It encodes the hairpin sequence 5′-CCGG-GCCACAAGTCTAAACAATAAT-CTCGAG-ATTATTGTTTAGACTTGTGGC-TTTTT-3′, which target the 3′-UTR of the Tcf7 transcript under the control of the hU6 promoter. We replaced the puromycin resistance gene in the plasmid with GFP to facilitate isolating T cells transduced with the lentivirus by FACS sorting. A control vector encoded GFP and a stuffer sequence driven by the hU6 promoter. Lentivirus was produced using 293T cells (ATCC) cotransfected with the pLKO.1 shRNA plasmid, the lentiviral packaging plasmid pCMV-deltaR8.91, and envelope plasmid pMD2.G using Lipofectamine 2000 (Life Technologies). Cell culture media containing lentiviral particles were collected at 24 and 48 h, pooled, and stored at −80 °C. Viral titers were calculated following spinfection of diluted aliquots onto cultured 293T cells and measuring the frequency of GFP+ cells by flow cytometry.
In vivo-activated T cells for transduction were obtained by isolating CD8+ T cells using the Miltenyi mouse CD8 negative isolation kit from the spleens and lymph nodes of OT1 or P14 TCR-Tg mice that were infected with VacOva or LCMV 48 h before harvest. CD8+ T cells were spinfected with lentivirus at a goal multiplicity of infection of 6, according to standard procedures including polybrene and IL-2 and IL-12 (for OT1 T cells) or IL-2 alone (for P14 cells). At 48 h after transduction, GFP+ cells were sorted and 10,000–30,000 cells were transferred into congenic virus-infected hosts. By gating on congenic markers, transferred cells were analyzed for CD127 and KLRG1 expression 7 d after adoptive transfer.
Supplementary Material
Acknowledgments
We acknowledge Dr. Srinivasan Yegnasubramanian, Dr. Sarah Wheelan, and the Johns Hopkins Next Generation Sequencing Center for technical assistance with the MBD-seq data collection and interpretation. Grant support was provided by Alex’s Lemonade Stand Foundation for Childhood Cancer (to B.H.L.), St. Baldrick’s Foundation Fellow Award (to B.H.L.), St. Baldrick’s Foundation Scholar Award (to C.J.G.), NIH Grant 5K08HL108346-03 (to C.J.G.), NIH Grant P30 CA006973 (the Sidney Kimmel Comprehensive Cancer Core Grant), NIH Grant R01AI057753 (to D.A.H.), Grant R01AI109810 (to D.A.H.), and Giant Food Children’s Cancer Research Fund (to C.J.G. and B.H.L.). This work was also supported in part by Public Health Service Grant P30 DK078392 (Research Flow Cytometry Core) of the Digestive Disease Research Core Center and Grant P30 DK090971 of the Hematology Center of Excellence in Cincinnati.
Footnotes
The authors declare no conflict of interest.
This article is a PNAS Direct Submission. S.M.K. is a Guest Editor invited by the Editorial Board.
Data deposition: The MBD-seq data reported in this paper have been deposited in the Gene Expression Omnibus (GEO) database, www.ncbi.nlm.nih.gov/geo (accession no. GSE85823).
This article contains supporting information online at www.pnas.org/lookup/suppl/doi:10.1073/pnas.1524490113/-/DCSupplemental.
References
- 1.Stemberger C, et al. A single naive CD8+ T cell precursor can develop into diverse effector and memory subsets. Immunity. 2007;27(6):985–997. doi: 10.1016/j.immuni.2007.10.012. [DOI] [PubMed] [Google Scholar]
- 2.Plumlee CR, et al. Early effector CD8 T cells display plasticity in populating the short-lived effector and memory-precursor pools following bacterial or viral infection. Sci Rep. 2015;5:12264. doi: 10.1038/srep12264. [DOI] [PMC free article] [PubMed] [Google Scholar]
- 3.Obar JJ, et al. Pathogen-induced inflammatory environment controls effector and memory CD8+ T cell differentiation. J Immunol. 2011;187(10):4967–4978. doi: 10.4049/jimmunol.1102335. [DOI] [PMC free article] [PubMed] [Google Scholar]
- 4.Sarkar S, et al. Functional and genomic profiling of effector CD8 T cell subsets with distinct memory fates. J Exp Med. 2008;205(3):625–640. doi: 10.1084/jem.20071641. [DOI] [PMC free article] [PubMed] [Google Scholar]
- 5.Badovinac VP, Haring JS, Harty JT. Initial T cell receptor transgenic cell precursor frequency dictates critical aspects of the CD8(+) T cell response to infection. Immunity. 2007;26(6):827–841. doi: 10.1016/j.immuni.2007.04.013. [DOI] [PMC free article] [PubMed] [Google Scholar]
- 6.Obar JJ, Khanna KM, Lefrançois L. Endogenous naive CD8+ T cell precursor frequency regulates primary and memory responses to infection. Immunity. 2008;28(6):859–869. doi: 10.1016/j.immuni.2008.04.010. [DOI] [PMC free article] [PubMed] [Google Scholar]
- 7.Joshi NS, et al. Inflammation directs memory precursor and short-lived effector CD8(+) T cell fates via the graded expression of T-bet transcription factor. Immunity. 2007;27(2):281–295. doi: 10.1016/j.immuni.2007.07.010. [DOI] [PMC free article] [PubMed] [Google Scholar]
- 8.Cui W, Joshi NS, Jiang A, Kaech SM. Effects of Signal 3 during CD8 T cell priming: Bystander production of IL-12 enhances effector T cell expansion but promotes terminal differentiation. Vaccine. 2009;27(15):2177–2187. doi: 10.1016/j.vaccine.2009.01.088. [DOI] [PMC free article] [PubMed] [Google Scholar]
- 9.Kalia V, et al. Prolonged interleukin-2Ralpha expression on virus-specific CD8+ T cells favors terminal-effector differentiation in vivo. Immunity. 2010;32(1):91–103. doi: 10.1016/j.immuni.2009.11.010. [DOI] [PubMed] [Google Scholar]
- 10.Boulet S, Daudelin J-F, Labrecque N. IL-2 induction of Blimp-1 is a key in vivo signal for CD8+ short-lived effector T cell differentiation. J Immunol. 2014;193(4):1847–1854. doi: 10.4049/jimmunol.1302365. [DOI] [PubMed] [Google Scholar]
- 11.Tiemessen MM, et al. T Cell factor 1 represses CD8+ effector T cell formation and function. J Immunol. 2014;193(11):5480–5487. doi: 10.4049/jimmunol.1303417. [DOI] [PubMed] [Google Scholar]
- 12.Nguyen MLT, Jones SA, Prier JE, Russ BE. Transcriptional enhancers in the regulation of T cell differentiation. Front Immunol. 2015;6:462. doi: 10.3389/fimmu.2015.00462. [DOI] [PMC free article] [PubMed] [Google Scholar]
- 13.Ansel KM, Lee DU, Rao A. An epigenetic view of helper T cell differentiation. Nat Immunol. 2003;4(7):616–623. doi: 10.1038/ni0703-616. [DOI] [PubMed] [Google Scholar]
- 14.Chang S, Aune TM. Dynamic changes in histone-methylation ‘marks’ across the locus encoding interferon-gamma during the differentiation of T helper type 2 cells. Nat Immunol. 2007;8(7):723–731. doi: 10.1038/ni1473. [DOI] [PubMed] [Google Scholar]
- 15.Araki Y, et al. Genome-wide analysis of histone methylation reveals chromatin state-based regulation of gene transcription and function of memory CD8+ T cells. Immunity. 2009;30(6):912–925. doi: 10.1016/j.immuni.2009.05.006. [DOI] [PMC free article] [PubMed] [Google Scholar]
- 16.Russ BE, et al. Distinct epigenetic signatures delineate transcriptional programs during virus-specific CD8(+) T cell differentiation. Immunity. 2014;41(5):853–865. doi: 10.1016/j.immuni.2014.11.001. [DOI] [PMC free article] [PubMed] [Google Scholar]
- 17.Scharer CD, Barwick BG, Youngblood BA, Ahmed R, Boss JM. Global DNA methylation remodeling accompanies CD8 T cell effector function. J Immunol. 2013;191(6):3419–3429. doi: 10.4049/jimmunol.1301395. [DOI] [PMC free article] [PubMed] [Google Scholar]
- 18.Gamper CJ, Agoston AT, Nelson WG, Powell JD. Identification of DNA methyltransferase 3a as a T cell receptor-induced regulator of Th1 and Th2 differentiation. J Immunol. 2009;183(4):2267–2276. doi: 10.4049/jimmunol.0802960. [DOI] [PMC free article] [PubMed] [Google Scholar]
- 19.Yu Q, et al. DNA methyltransferase 3a limits the expression of interleukin-13 in T helper 2 cells and allergic airway inflammation. Proc Natl Acad Sci USA. 2012;109(2):541–546. doi: 10.1073/pnas.1103803109. [DOI] [PMC free article] [PubMed] [Google Scholar]
- 20.Thomas RM, Gamper CJ, Ladle BH, Powell JD, Wells AD. De novo DNA methylation is required to restrict T helper lineage plasticity. J Biol Chem. 2012;287(27):22900–22909. doi: 10.1074/jbc.M111.312785. [DOI] [PMC free article] [PubMed] [Google Scholar]
- 21.Wolfer A, et al. Inactivation of Notch 1 in immature thymocytes does not perturb CD4 or CD8T cell development. Nat Immunol. 2001;2(3):235–241. doi: 10.1038/85294. [DOI] [PubMed] [Google Scholar]
- 22.Zhang DJ, et al. Selective expression of the Cre recombinase in late-stage thymocytes using the distal promoter of the Lck gene. J Immunol. 2005;174(11):6725–6731. doi: 10.4049/jimmunol.174.11.6725. [DOI] [PubMed] [Google Scholar]
- 23.Restifo NP, et al. Antigen processing in vivo and the elicitation of primary CTL responses. J Immunol. 1995;154(9):4414–4422. [PMC free article] [PubMed] [Google Scholar]
- 24.Arsenio J, et al. Early specification of CD8+ T lymphocyte fates during adaptive immunity revealed by single-cell gene-expression analyses. Nat Immunol. 2014;15(4):365–372. doi: 10.1038/ni.2842. [DOI] [PMC free article] [PubMed] [Google Scholar]
- 25.Kaech SM, Cui W. Transcriptional control of effector and memory CD8+ T cell differentiation. Nat Rev Immunol. 2012;12(11):749–761. doi: 10.1038/nri3307. [DOI] [PMC free article] [PubMed] [Google Scholar]
- 26.Kurachi M, et al. The transcription factor BATF operates as an essential differentiation checkpoint in early effector CD8+ T cells. Nat Immunol. 2014;15(4):373–383. doi: 10.1038/ni.2834. [DOI] [PMC free article] [PubMed] [Google Scholar]
- 27.Xin A, et al. A molecular threshold for effector CD8(+) T cell differentiation controlled by transcription factors Blimp-1 and T-bet. Nat Immunol. 2016;17(4):422–432. doi: 10.1038/ni.3410. [DOI] [PMC free article] [PubMed] [Google Scholar]
- 28.Serre D, Lee BH, Ting AH. MBD-isolated genome sequencing provides a high-throughput and comprehensive survey of DNA methylation in the human genome. Nucleic Acids Res. 2010;38(2):391–399. doi: 10.1093/nar/gkp992. [DOI] [PMC free article] [PubMed] [Google Scholar]
- 29.Zhao D-M, et al. Constitutive activation of Wnt signaling favors generation of memory CD8 T cells. J Immunol. 2010;184(3):1191–1199. doi: 10.4049/jimmunol.0901199. [DOI] [PMC free article] [PubMed] [Google Scholar]
- 30.Willinger T, et al. Human naive CD8 T cells down-regulate expression of the WNT pathway transcription factors lymphoid enhancer binding factor 1 and transcription factor 7 (T cell factor-1) following antigen encounter in vitro and in vivo. J Immunol. 2006;176(3):1439–1446. doi: 10.4049/jimmunol.176.3.1439. [DOI] [PubMed] [Google Scholar]
- 31.Jeannet G, et al. Essential role of the Wnt pathway effector Tcf-1 for the establishment of functional CD8 T cell memory. Proc Natl Acad Sci USA. 2010;107(21):9777–9782. doi: 10.1073/pnas.0914127107. [DOI] [PMC free article] [PubMed] [Google Scholar]
- 32.Zhou X, et al. Differentiation and persistence of memory CD8(+) T cells depend on T cell factor 1. Immunity. 2010;33(2):229–240. doi: 10.1016/j.immuni.2010.08.002. [DOI] [PMC free article] [PubMed] [Google Scholar]
- 33.Yang B-H, et al. Development of a unique epigenetic signature during in vivo Th17 differentiation. Nucleic Acids Res. 2015;43(3):1537–1548. doi: 10.1093/nar/gkv014. [DOI] [PMC free article] [PubMed] [Google Scholar]
- 34.Epsztejn-Litman S, et al. De novo DNA methylation promoted by G9a prevents reprogramming of embryonically silenced genes. Nat Struct Mol Biol. 2008;15(11):1176–1183. doi: 10.1038/nsmb.1476. [DOI] [PMC free article] [PubMed] [Google Scholar]
- 35.Shin HM, et al. Epigenetic modifications induced by Blimp-1 regulate CD8⁺ T cell memory progression during acute virus infection. Immunity. 2013;39(4):661–675. doi: 10.1016/j.immuni.2013.08.032. [DOI] [PMC free article] [PubMed] [Google Scholar]
- 36.Duan Z, Zarebski A, Montoya-Durango D, Grimes HL, Horwitz M. Gfi1 coordinates epigenetic repression of p21Cip/WAF1 by recruitment of histone lysine methyltransferase G9a and histone deacetylase 1. Mol Cell Biol. 2005;25(23):10338–10351. doi: 10.1128/MCB.25.23.10338-10351.2005. [DOI] [PMC free article] [PubMed] [Google Scholar]
- 37.Hervouet E, Vallette FM, Cartron P-F. Dnmt3/transcription factor interactions as crucial players in targeted DNA methylation. Epigenetics. 2009;4(7):487–499. doi: 10.4161/epi.4.7.9883. [DOI] [PubMed] [Google Scholar]
- 38.Guerrero-Preston R, et al. Key tumor suppressor genes inactivated by “greater promoter” methylation and somatic mutations in head and neck cancer. Epigenetics. 2014;9(7):1031–1046. doi: 10.4161/epi.29025. [DOI] [PMC free article] [PubMed] [Google Scholar]
- 39.Bock C, et al. BiQ Analyzer: Visualization and quality control for DNA methylation data from bisulfite sequencing. Bioinformatics. 2005;21(21):4067–4068. doi: 10.1093/bioinformatics/bti652. [DOI] [PubMed] [Google Scholar]
Associated Data
This section collects any data citations, data availability statements, or supplementary materials included in this article.


