Significance
Neurotransmitters are stored in synaptic vesicles (SVs) depending on the energy provided by an H+ gradient. The inhibitory transmitter GABA is critical for coordinated neuronal activity of the brain, and vesicular transport of GABA is essential for its release. However, the transport process has been characterized primarily in isolated or reconstituted vesicle preparations, and we know little about its properties at functional synapses. Here, by monitoring the pH of SVs in GABAergic neurons apart from excitatory glutamatergic neurons, we show that GABA transport into SVs is tightly coupled to SV alkalization in living neurons, which occurs at an unexpectedly slow rate, suggesting a possible contribution of incompletely filled vesicles during sustained stimulation at GABAergic synapses.
Keywords: synaptic vesicle, VGAT, inhibitory neuron
Abstract
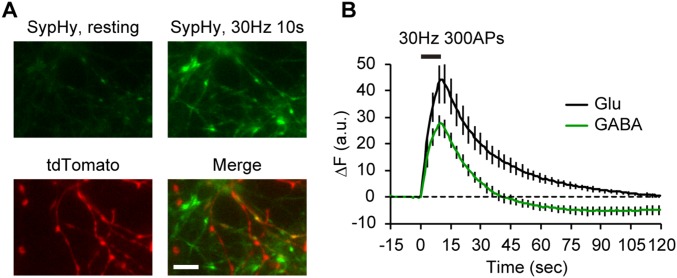
GABA acts as the major inhibitory neurotransmitter in the mammalian brain, shaping neuronal and circuit activity. For sustained synaptic transmission, synaptic vesicles (SVs) are required to be recycled and refilled with neurotransmitters using an H+ electrochemical gradient. However, neither the mechanism underlying vesicular GABA uptake nor the kinetics of GABA loading in living neurons have been fully elucidated. To characterize the process of GABA uptake into SVs in functional synapses, we monitored luminal pH of GABAergic SVs separately from that of excitatory glutamatergic SVs in cultured hippocampal neurons. By using a pH sensor optimal for the SV lumen, we found that GABAergic SVs exhibited an unexpectedly higher resting pH (∼6.4) than glutamatergic SVs (pH ∼5.8). Moreover, unlike glutamatergic SVs, GABAergic SVs displayed unique pH dynamics after endocytosis that involved initial overacidification and subsequent alkalization that restored their resting pH. GABAergic SVs that lacked the vesicular GABA transporter (VGAT) did not show the pH overshoot and acidified further to ∼6.0. Comparison of luminal pH dynamics in the presence or absence of VGAT showed that VGAT operates as a GABA/H+ exchanger, which is continuously required to offset GABA leakage. Furthermore, the kinetics of GABA transport was slower (τ > 20 s at physiological temperature) than that of glutamate uptake and may exceed the time required for reuse of exocytosed SVs, allowing reuse of incompletely filled vesicles in the presence of high demand for inhibitory transmission.
Synaptic transmission is mediated by quantal release of neurotransmitters stored in synaptic vesicles (SVs) that are locally recycled at the presynaptic terminals (1). Because vesicular transport of classical transmitters depends on an H+ electrochemical gradient (ΔµH+) generated by the vacuolar-type H+ ATPase (V-ATPase), the rate and extent of ΔµH+ formation can influence quantal size (2). Recent characterization of net proton influx into excitatory glutamatergic SVs in cultured neurons (3) revealed kinetics similar to that of glutamate uptake (4) and thus, highlighted possible temporal coupling between luminal proton dynamics and transmitter uptake. However, how H+ accumulates and how much accumulates in inhibitory GABAergic SVs remain unknown.
Because the molecular composition of inhibitory SVs is almost identical to that of excitatory SVs, except for the respective vesicular neurotransmitter transporters (5, 6), any differences in luminal [H+] could be explained, in part, by differences in the H+ coupling to their respective vesicular neurotransmitter transport. Indeed, biochemical studies using SVs isolated from brains have indicated that the contribution of ΔµH+ on uptake differs substantially (2). Vesicular glutamate transport predominantly relies on the electrical gradient (Δψ) and results in an enhanced chemical gradient ΔpH (7, 8). In comparison, vesicular GABA transport is equally dependent on both Δψ and ΔpH, which is thought to result from a concomitant H+ exchange (9, 10). However, a study using proteoliposomes reconstituted with vesicular GABA transporter (VGAT) (11, 12) proposed that VGAT operates a Δψ-driven GABA/2Cl– cotransporter without the need for ΔpH (13). Clarification of the enigmatic GABA transport mechanism was recently provided by Farsi et al. (14), who imaged the pH-sensitive superecliptic pHluorin in isolated single SVs and found evidence that VGAT functions through a GABA/H+ antiport mechanism. However, no evidence has been obtained that shows any changes in luminal [H+] associated with V-ATPase–dependent GABA uptake. In addition, acidification of isolated or reconstituted vesicles does not necessarily reflect the situation in SVs in living neurons, particularly because the ionic composition in isolated vesicles is altered during the isolation procedure (15). Therefore, to gain a more accurate understanding of the vesicular loading mechanism for GABA, examination of luminal pH dynamics linked to GABA uptake in functional synapses is important.
Molecules that are pH sensitive, such as pHluorin and CypHer, have been targeted to the SV lumen and used to track vesicle exo-/endocytosis in culture preparations (16, 17). To date, no diversity in SV acidity across neurotransmitter phenotypes has been reported. These pH sensors, however, have a pKa > 7, which has likely hindered the detection of differences in SV pH, particularly in a minor population, such as GABAergic terminals. Here, by expressing mOrange2 (18) fused to the luminal region of synaptophysin (syp-mOr; pKa = 6.5) in cultured neurons derived from VGAT-Venus transgenic (Tg) mice (19), we compared the properties of luminal acidity between GABAergic and glutamatergic SVs. We show that luminal pH and its dynamics during SV recycling in GABAergic SVs markedly differ from those in glutamatergic SVs. By analyzing VGAT-deficient neurons, we further show that the unique behavior of luminal pH in GABAergic SVs can be accounted for by H+ efflux coupled to GABA uptake.
Results
High Luminal pH of GABAergic SVs.
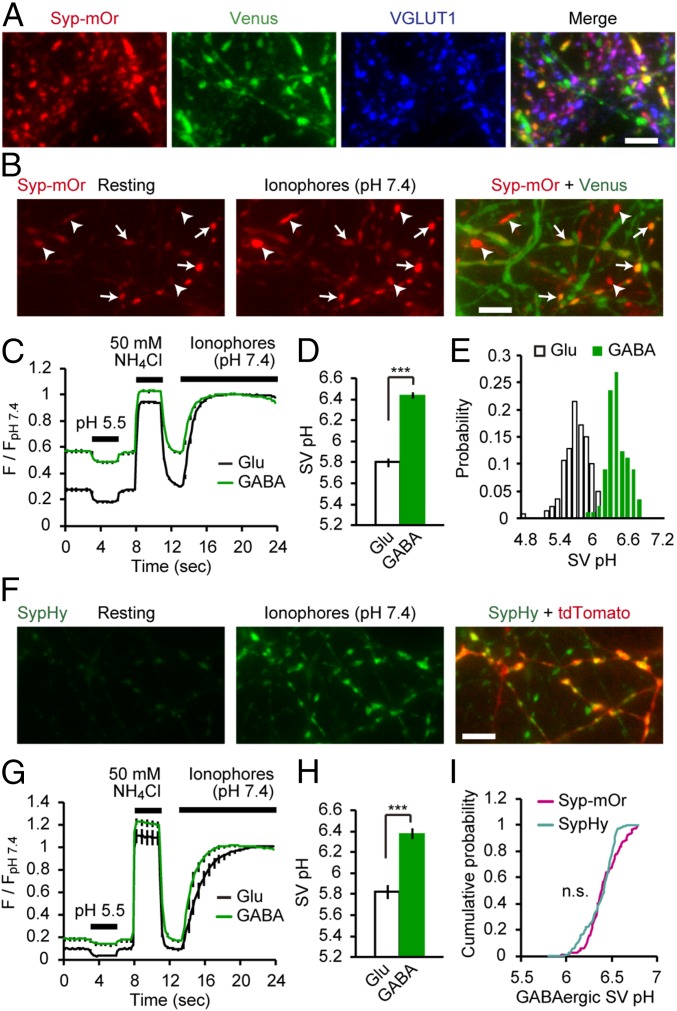
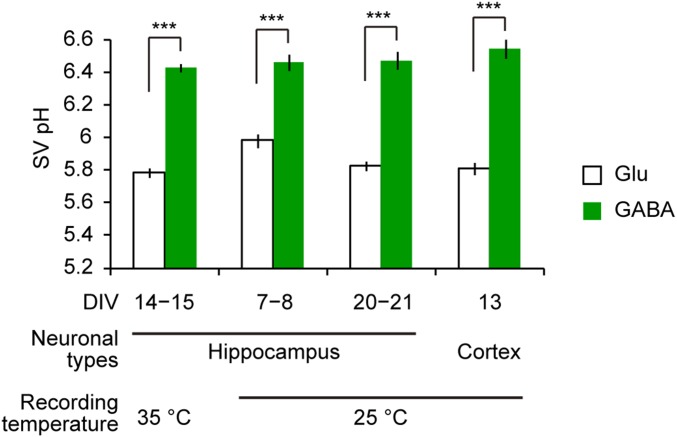
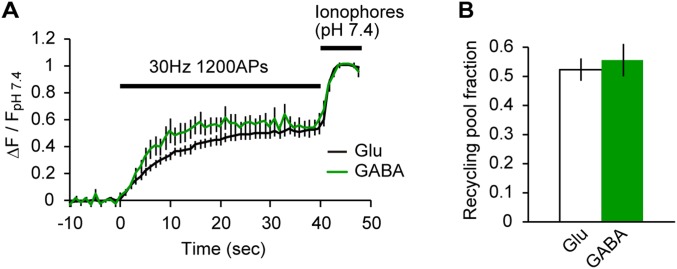
As we have previously shown, syp-mOr enables accurate measurement of the entire range of SV pH (3). To express syp-mOr in a neuron-specific manner, we used two lentiviral vectors with a Tet-inducible system (20). When expressed in cultured hippocampal neurons prepared from VGAT-Venus Tg mice, the majority of syp-mOr puncta colocalized with Venus-negative boutons that were immunoreactive for the glutamatergic presynaptic marker, vesicular glutamate transporter 1 (VGLUT1) (21, 22). In comparison, a minor fraction of syp-mOr puncta colocalized with Venus-positive GABAergic terminals (Fig. 1A). With live imaging, we realized that some of the syp-mOr puncta were much brighter than others and often corresponded to Venus-positive boutons (Fig. 1B), suggesting that GABAergic SVs had a higher pH than glutamatergic SVs. To quantify SV pH, surface probes were quenched with an acidic buffer (pH 5.5), and the total fluorescence at pH 7.4 was measured after the application of an ionophore mixture (Fig. 1C). The analysis revealed that the pH of GABAergic SVs was 6.44 ± 0.03, remarkably higher than that of glutamatergic SVs (pH 5.80 ± 0.04) (Fig. 1D). The distributions of SV pH measured from individual boutons revealed a single peak for both groups and were clearly separated (Fig. 1E). We also confirmed the high resting pH of GABAergic SVs at near physiological temperature (35 °C), at different stages in culture, and in cultured cortical neurons (Fig. S1). We were concerned that a considerable fraction of syp-mOr in GABAergic boutons may have been mislocalized to non-SV organelles, such as early/recycling endosomes, which have luminal pH of ∼6–6.5 (23). However, probe fractions that can be released by prolonged electrical stimulation were not different between the two synapse types (Fig. S2) (56 ± 6% in GABAergic boutons and 52 ± 4% in glutamatergic boutons). These values are consistent with that reported previously with a pHluorin-based probe (24). Thus, the possibility that the syp-mOr signal in GABAergic boutons was strongly biased by mislocalization to non-SV organelles was unlikely.
Fig. 1.
High luminal pH of GABAergic SVs. (A) Fluorescence images of syp-mOr and Venus. syp-mOr fluorescence (red) colocalized with either Venus fluorescence (GABAergic; green) or VGLUT1 immunoreactivity (glutamatergic; blue). (Scale bar: 5 µm.) (B) Live fluorescence image of syp-mOr (average of five consecutive images) at rest (Left) and on addition of a mixture of ionophores at pH 7.4 (Center). Venus fluorescence is merged in Right. Venus-positive spots (arrows) were often bright in the resting condition. Note that Venus-negative spots (arrowheads) exhibited robust increases in fluorescence after application of ionophores. (Scale bar: 5 µm.) (C) Normalized syp-mOr fluorescence in response to an acidic solution (pH 5.5), NH4Cl (50 mM), and ionophores at pH 7.4 in glutamatergic (black; n = 16; 140 boutons) and GABAergic (green; n = 14; 89 boutons) boutons. (D) SV pH of glutamatergic and GABAergic SVs quantified from the syp-mOr fluorescence shown in C. ***P < 0.001, unpaired t test. (E) Histogram of SV pH recorded from individual glutamatergic (white) and GABAergic (green) boutons. (F) Live image of sypHy fluorescence (average of five consecutive images) at rest (Left) and on addition of ionophores at pH 7.4 (Center). tdTomato fluorescence, specifically expressed in GABAergic neurons is merged in Right. (Scale bar: 5 µm.) (G) Normalized sypHy fluorescence changes in response to an acidic solution (pH 5.5), NH4Cl (50 mM), and ionophores at pH 7.4 in glutamatergic (black; n = 9; 95 boutons) and GABAergic (green; n = 9; 139 boutons) boutons. (H) SV pH of glutamatergic and GABAergic SVs quantified from the sypHy fluorescence shown in G. ***P < 0.001, unpaired t test. (I) Cumulative distribution of GABAergic SV pH recorded from individual boutons with syp-mOr (magenta) and sypHy (cyan). Profiles of GABAergic SV pH monitored with two different probes were not significantly different (P = 0.06, Kolmogorov–Smirnov test). Error bars indicate SEM.
Fig. S1.
Higher pH of GABAergic SVs compared with glutamatergic SVs was observed irrespective of recording temperature, developmental stages in culture, and neuronal types. First set of bars: pH of glutamatergic (white; n = 7, including 99 boutons) and GABAergic (green; n = 7, including 105 boutons) SVs was measured in cultured hippocampal neurons at 14–15 d in vitro (DIV) at 35 °C. Second set of bars: pH of glutamatergic (n = 15, including 115 boutons) and GABAergic (n = 12, including 100 boutons) SVs was measured in cultured hippocampal neurons at 7–8 DIV at 25 °C. Third set of bars: pH of glutamatergic (n = 11, including 147 boutons) and GABAergic (n = 11, including 101 boutons) SVs was measured in cultured hippocampal neurons at 20–21 DIV at 25 °C. Fourth set of bars: pH of glutamatergic (n = 12, including 120 boutons) and GABAergic (n = 9, including 110 boutons) SVs was measured in cultured cortical neurons at 13 DIV at 25 °C. In all cases tested, the resting SV pH of GABAergic boutons was significantly higher than that of glutamatergic boutons. ***P < 0.001, unpaired t test.
Fig. S2.
Recycling pool fraction measured with syp-mOr did not differ between glutamatergic and GABAergic synapses. (A) Average change in syp-mOr fluorescence during a protocol to visualize the total releasable fraction of SVs at glutamatergic (black; n = 10, including 132 boutons) and GABAergic (green; n = 10, including 103 boutons) boutons. Neurons were treated with 1–2 μM bafilomycin A1 for 60–90 s and then, stimulated with 1,200 action potentials (APs) at 30 Hz. Fluorescence changes were normalized to that obtained by subsequently applied ionophores (pH 7.4). (B) Releasable vesicle pool fractions were estimated as the normalized fluorescence increase at the end of stimulation shown in A. No significant difference was found between glutamatergic and GABAergic synapses (52 ± 4% in glutamatergic boutons and 56 ± 6% in GABAergic boutons; P = 0.64, unpaired t test).
The difference in resting pH of glutamatergic (5.8) and GABAergic (6.4) SVs seemed large enough to be detected with pHluorin (pKa = 7.1) (25). To further validate our findings with syp-mOr, we performed the same SV pH measurements using pHluorin fused to the luminal region of synaptophysin (sypHy) (26). sypHy was virally expressed in cultured hippocampal neurons prepared from VGAT-floxed STOP-tdTomato, Nestin-Cre double-Tg mice (27, 28), in which inhibitory neurons specifically express the red fluorescent protein tdTomato (Fig. 1F). Compared with syp-mOr fluorescence (Fig. 1C), the baseline fluorescence of sypHy exhibited only a slight difference between glutamatergic and GABAergic boutons (Fig. 1G), which was expected from the relatively higher pKa of pHluorin. Despite this difference, the calculated SV pH was identical to that obtained with syp-mOr in both glutamatergic (pH 5.82 ± 0.07) and GABAergic (pH 6.38 ± 0.05) boutons (Fig. 1H). We note that estimation of SV pH from individual glutamatergic boutons was difficult in our sypHy imaging, because the fluorescence during acid application sometimes became negative because of the very low signal to noise ratio. In contrast, SV pH was reliably measured at individual GABAergic boutons using sypHy, and their distribution was not significantly different from that measured with syp-mOr (Fig. 1I).
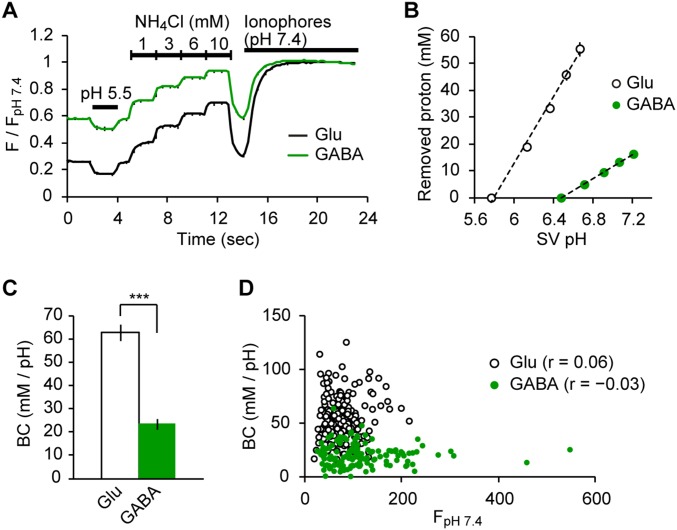
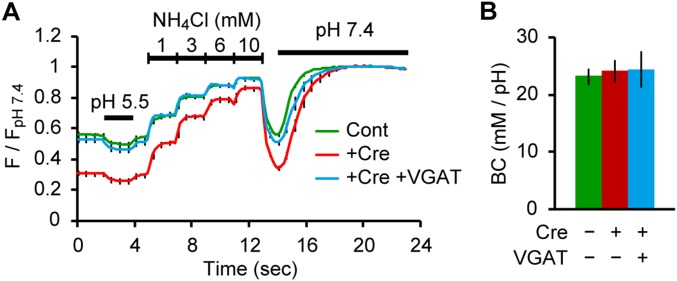
We asked if the strikingly higher resting pH of GABAergic SVs compared with that of glutamatergic SVs resulted from a higher buffering capacity (BC) of GABAergic SVs, which may limit acidification of organelles in general (29). In fact, responses to 50 mM NH4+ differed between the two SV types (Fig. 1 C and G), indicative of distinct BCs. More precise measurements revealed that the BC of GABAergic SVs was ∼2.5-fold lower than that of glutamatergic SVs (Fig. S3). Thus, other factors must account for the higher pH of GABAergic SVs.
Fig. S3.
Measurement of luminal BC in glutamatergic SVs and GABAergic SVs. (A) syp-mOr fluorescence changes on application of acid solution (pH 5.5), varying concentrations of NH4Cl (1, 3, 6, and 10 mM), and ionophores at pH 7.4 in glutamatergic (black; n = 16, including 140 boutons) and GABAergic (green; n = 14, including 89 boutons) boutons. syp-mOr fluorescence was normalized to that at pH 7.4. (B) Relationship between luminal [NH4+] (plotted as removed protons in millimolar) and the resulting SV pH by NH4Cl applications in glutamatergic (black) and GABAergic (green) SVs. We found a linear correlation between the two parameters, indicating that BCs of both SV groups are constant, irrespective of luminal pH in this range. (C) BC of glutamatergic (63 ± 4 mM/pH) and GABAergic (24 ± 2 mM/pH) SVs quantified as a slope of line fits from B. ***P < 0.001, unpaired t test. (D) Correlation between the luminal BC of individual boutons and fluorescence during treatment with ionophores (FpH 7.4) representing total expression of syp-mOr. No significant correlation was found for either glutamatergic SVs (white circles; r = 0.06; P = 0.40, Pearson r test) or GABAergic SVs (green circles; r = −0.03; P = 0.74, Pearson r test). Although probe molecules potentially contributed to the BC, the expression level of syp-mOr in our experiment did not substantially affect the luminal BC. Error bars indicate SEM. The analysis showed that the luminal BC of GABAergic SVs was remarkably lower (∼2.5-fold) than that of glutamatergic SVs. We reason that the difference in BC results from the amount of fixed buffers present within intrinsic membrane proteins on the luminal surface of SVs. Notably, a recent semiquantitative MS-based analysis of glutamatergic SVs and GABAergic SVs suggested that glutamatergic SVs contain roughly twice as much synaptophysin and synaptotagmin (considering all detected isoforms) as GABAergic SVs (6). Therefore, it is conceivable that the relative density of membrane proteins on each of the respective SV types may differ substantially. The contribution of mobile buffers, namely their neurotransmitter content (glutamate and GABA), to their distinct BCs seems unlikely because of their low effective pKa (both are ∼4.1). For instance, theoretical considerations indicate that only ∼2% (1/101.7) of glutamate is protonated at pH 5.8. Assuming that an SV contains 100 mM glutamate, the contribution of glutamate to the BC is ∼2 mM, which cannot explain the difference in BCs between the two types of SVs (∼40 mM). A subtle contribution of GABA content to the BC of GABAergic SVs was also confirmed by results shown in Fig. S7, in which the deletion of VGAT did not reduce the luminal BC. Therefore, the neurotransmitter content likely does not act as “powerful” buffers in the pH range concerned. Given the pH gradients generated during reacidification and their BCs (which are defined as the acid or base required to produce a shift of one pH unit), net H+ accumulations in a glutamatergic SV and a GABAergic SV are calculated to be ∼1,200 and ∼260, respectively.
pH Overshoot in GABAergic SVs After Endocytosis.
To further explore the properties of luminal pH in GABAergic SVs, we next examined the response of syp-mOr fluorescence during SV recycling. After field stimulation (300 pulses at 30 Hz), syp-mOr fluorescence increased in both glutamatergic and GABAergic boutons. Intriguingly, unlike glutamatergic boutons, the fluorescence in GABAergic boutons decreased beyond baseline and barely recovered during the period of our recordings (Fig. 2A). This fluorescence overshoot in GABAergic boutons was also observed with the sypHy probe, although its magnitude was much smaller than that seen with syp-mOr (Fig. S4). The fluorescence overshoot after stimulation raised at least three possibilities: lateral diffusion of the probe out of the synapses, concomitant excessive endocytosis of the surface probes, or overacidification below the resting SV pH. To test the first possibility, the same recordings were performed after treatment with the V-ATPase inhibitor bafilomycin A1 (Fig. 2B). After stimulation, the increase in fluorescence was sustained for both types of synapses, indicating negligible probe diffusion out of the synapses. To clarify the latter two possibilities, we applied an acidic buffer (pH 5.5) before and 90 s after the stimulation to compare fluorescence intensities from the vesicle pools at rest with those near completion of endocytosis. As shown in Fig. 2C, the second acid application resulted in the same degree of quenching in both types of synapses, arguing against excessive endocytosis of syp-mOr selectively at GABAergic boutons. Furthermore, the fluorescence remaining within GABAergic boutons during the second acid application, which should reflect the pH of the SV pool, was significantly weaker than during the first acid treatment. This result was different from glutamatergic boutons and indicates that the fluorescence overshoot after stimulation resulted from overacidification of GABAergic SVs. When we performed the same recordings at 35 °C to accelerate all of the SV recycling processes (3, 4, 30), we observed gradual recovery from the overshoot to the initial baseline at GABAergic boutons (Fig. 2D).
Fig. 2.
Transient overacidification of GABAergic SVs during vesicle recycling. (A) syp-mOr fluorescence in response to 300 action potentials (APs) at 30 Hz. (Left) Representative fluorescence trace at glutamatergic and GABAergic boutons recorded in the same experiment. A mixture of ionophores was applied at the end of the recording to determine the total fluorescence at pH 7.4. (Right) Average change in fluorescence at glutamatergic (black; n = 10; 175 boutons) and GABAergic (green; n = 11; 126 boutons) boutons. Dashed line indicates the baseline. (B) syp-mOr fluorescence in response to field stimulation after treatment with bafilomycin A1 (2 µM; 90 s) in glutamatergic (black; n = 8; 105 boutons) and GABAergic (green; n = 8, 69 boutons) boutons. Fluorescence was normalized to the value at the peak after stimulation. (C) syp-mOr fluorescence in response to an acidic solution (pH 5.5) before and 90 s after stimulation in glutamatergic (black; n = 11; 169 boutons) and GABAergic (green; n = 10; 148 boutons) boutons. Fluorescence during prestimulus acid application was set as the baseline, and the fluorescence change from this baseline was expressed as ΔF. (D) syp-mOr fluorescence in response to field stimulation measured at 35 °C in glutamatergic (black; n = 13; 112 boutons) and GABAergic (green; n = 13; 145 boutons) boutons. Error bars indicate SEM.
Fig. S4.
sypHy fluorescence was also overshot after endocytosis at GABAergic boutons. (A) Live fluorescence image (average of five consecutive images) of sypHy expressed in cultured hippocampal neurons in which tdTomato was expressed under control of the VGAT promoter. sypHy images taken before (resting) and immediately after a train of 300 action potentials (APs) at 30 Hz are shown in Upper. tdTomato fluorescence is merged in Lower. (Scale bar: 5 µm.) (B) sypHy fluorescence in response to field stimulation measured at 25 °C in glutamatergic (black; n = 7, including 136 boutons) and GABAergic (green; n = 7, including 107 boutons) boutons. Error bars indicate SEM.
Vesicular GABA Transport Alkalizes the SV Lumen.
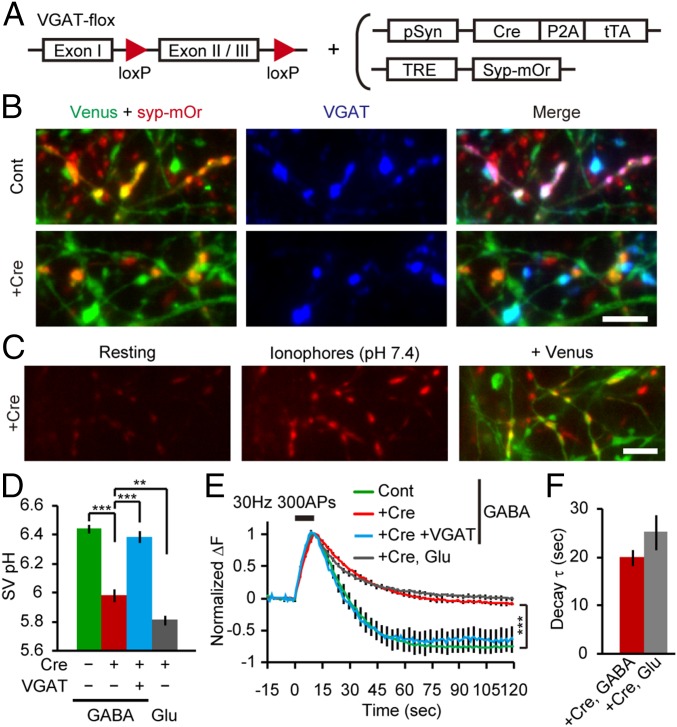
The pH overshoot and the subsequent recovery of endocytosed GABAergic SVs suggest that a mechanism is present that alkalizes the lumen after SV reacidification. We hypothesized that SV refilling with GABA, which has been proposed to occur through a GABA/H+ exchange (9) (ref. 13 shows an alternative model), may underlie the observed SV alkalization. To address this hypothesis, we monitored the pH of SVs from VGAT-deficient neurons. Hippocampal neurons prepared from VGAT-VenusTg/+, VGATflox/flox (31) double-Tg mice were infected with two lentiviruses linking Cre recombinase (Cre) expression to Tet-inducible syp-mOr expression (Fig. 3A), so that GABAergic neurons expressing syp-mOr were converted to VGAT−/−. As a control, we used a lentivirus lacking Cre. Indeed, Venus-positive boutons expressing syp-mOr lacked VGAT immunoreactivity only when Cre was incorporated (Fig. 3B). Using electrophysiological approaches, we also found impaired vesicular GABA release in neurons converted to VGAT−/− (Fig. S5). In neurons in which VGAT was deleted, the brighter syp-mOr fluorescence in Venus-positive boutons was not obvious at rest and became equally bright on application of ionophores at pH 7.4 (Fig. 3C). Quantification revealed that the pH in VGAT-deficient GABAergic SVs was reduced to 5.98 ± 0.04, which was rescued to 6.39 ± 0.04 by overexpression of VGAT (Fig. 3D and Fig. S6). BC did not differ significantly among all conditions tested (Fig. S7). Furthermore, syp-mOr fluorescence in VGAT-deficient GABAergic boutons did not overshoot after stimulation and declined close to baseline (Fig. 3E). Again, overexpression of VGAT in VGAT-deficient GABAergic neurons recapitulated the fluorescence overshoot observed in control GABAergic SVs. The fluorescence decay kinetics in VGAT-deficient GABAergic boutons (τ = 20 ± 2 s) was not significantly different from that in glutamatergic boutons recorded from the same preparations (τ = 25 ± 4 s) (Fig. 3F). These observations clearly show that vesicular GABA transport was responsible for both high resting SV pH and the pH overshoot after endocytosis in GABAergic SVs.
Fig. 3.
Reduced luminal pH in VGAT-deficient GABAergic SVs. (A) Schematic strategy for syp-mOr expression linked to Cre-mediated VGAT deletion. (B) Expression of syp-mOr in cultured neurons prepared from VGAT-VenusTg/+/VGATflox/flox mice. syp-mOr fluorescence (red) in Venus-positive boutons (green) colocalized with VGAT immunoreactivity (blue) in control neurons where Cre was not expressed (Cont) but did not colocalize in neurons expressing Cre (+Cre). (Scale bar: 5 µm.) (C) Fluorescence images of syp-mOr (average of five consecutive images) in Cre-expressing VGAT-VenusTg/+/VGATflox/flox neurons at rest (Left) and on addition of ionophores at pH 7.4 (Center). Venus fluorescence is merged in Right. (Scale bar: 5 µm.) (D) SV pH of GABAergic SVs from control (green; n = 17; 282 boutons), Cre-expressing (red; n = 12; 187 boutons), and Cre+VGAT-expressing (blue; n = 11; 166 boutons) VGATflox/flox neurons. SV pH of glutamatergic SVs from Cre-expressing VGATflox/flox neurons is also shown (gray; n = 13; 215 boutons). **P < 0.01, one-way ANOVA followed by Bonferroni's test; ***P < 0.001, one-way ANOVA followed by Bonferroni's test. (E) syp-mOr fluorescence in response to field stimulation within GABAergic boutons from control (green; n = 12; 196 boutons), Cre-expressing (red; n = 11; 167 boutons), and Cre+VGAT-expressing (blue; n = 17; 199 boutons) VGATflox/flox neurons and glutamatergic boutons from Cre-expressing VGATflox/flox neurons (gray; n = 12; 205 boutons). Fluorescence of GABAergic boutons from Cre-expressing neurons remained close to baseline even 120 s after stimulation, which was significantly higher than that from control neurons. ***P < 0.001, unpaired t test. (F) Decay time constant of syp-mOr fluorescence in glutamatergic and GABAergic boutons from Cre-expressing neurons (P = 0.20, unpaired t test). Error bars indicate SEM.
Fig. S5.
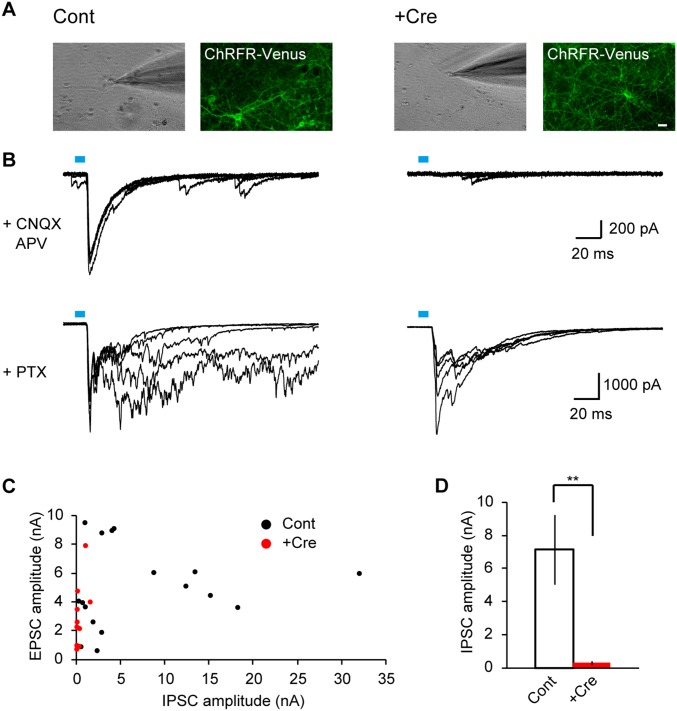
Vesicular release of GABA was impaired in VGATflox/flox neurons expressing Cre recombinase. To validate the effective knockout of VGAT in VGATflox/flox neurons infected with a lentivirus that bicistronically expresses Cre and tetracycline transactivator (tTA) (Fig. 3A), electrophysiological recordings were performed. To selectively activate Cre-expressing neurons, cultures were coinfected with a lentivirus that expresses a Venus-tagged chimeric ChRFR (ChRFR-Venus) in a tTA-dependent manner. Control cultures were infected with a pair of lentiviruses carrying either tTA or ChRFR-Venus. (A) Bright field image of a recorded neuron and a fluorescence image of ChRFR-Venus of the same field of view. Whole-cell recordings were performed from ChRFR-Venus–negative neurons. Left was obtained from cultures in which the Cre recombinase was not expressed (Cont), and Right was obtained from those expressing Cre recombinase (+Cre). (Scale bar: 20 µm.) (B) Representative traces of light-evoked inhibitory postsynaptic currents (IPSCs) (Upper) recorded in the presence of ionotropic glutamate receptor antagonists 6-cyano-7-nitroquinoxaline-2,3-dione (CNQX) and d-2-amino-5-phosphonovaleric acid (d-APV) (+CNQX APV) and excitatory postsynaptic currents (EPSCs) (Lower) recorded in the presence of the GABAA receptor antagonist picrotoxin (PTX; +PTX). Five consecutive traces were overlaid. Light pulses of ∼10-ms duration at 0.1 Hz were applied through a 470-nm bandpass filter with an 11-nm bandwidth. Both IPSCs and EPSCs were recorded in the control culture (Left), whereas IPSCs were selectively impaired in the Cre-expressing culture (Right). (C) Summary plots showing amplitudes of IPSCs and EPSCs recorded from control (black; n = 17 cells) and Cre-expressing (red; n = 14 cells) cultures. EPSC amplitudes were quantified by measuring the initial peak. Most of the neurons in Cre-expressing cultures showed almost no IPSCs, although in 2 of 14 preparations, small IPSCs were detected. (D) Average amplitude of IPSCs recorded from control and Cre-expressing cultures. Cre expression significantly reduced IPSC amplitude. These results were consistent with a previous study of conventional VGAT−/− mice (50), and they confirmed that VGAT was reliably knocked out in our system. Error bars indicate SEM. **P < 0.01, unpaired t test.
Fig. S6.
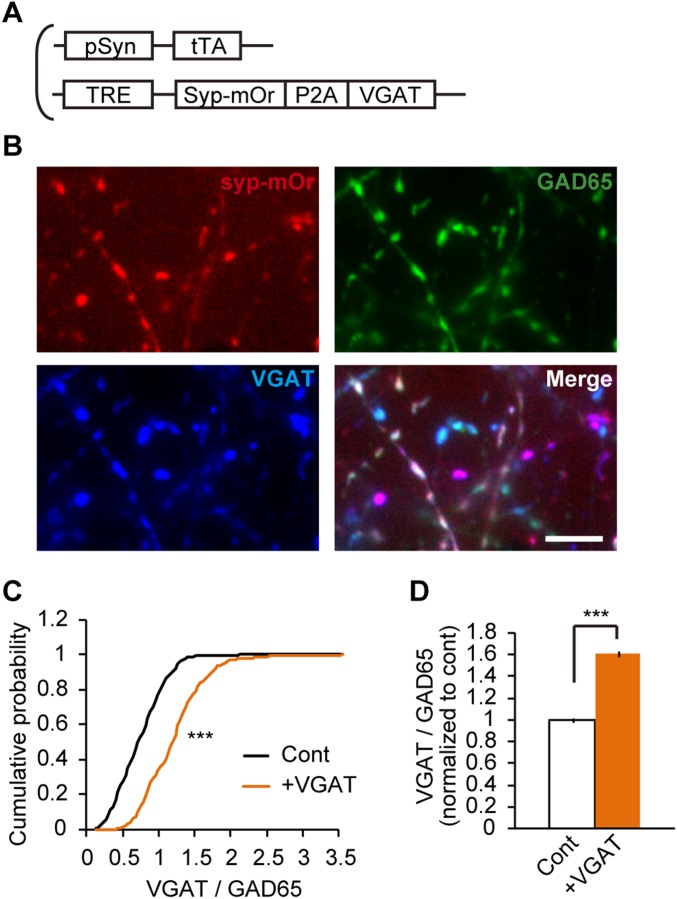
VGAT overexpression using lentivirus that bicistronically expressed syp-mOr and VGAT. (A) Schematic illustration of two lentiviruses that induced syp-mOr expression linked to VGAT overexpression. (B) Cultured neurons infected with lentiviruses shown in A were immunostained with anti-GAD65 and anti-VGAT antibodies. Note that syp-mOr fluorescence (red) was colocalized with VGAT immunoreactivity (blue), even in the bouton devoid of GAD65 immunoreactivity (green). (C) Cumulative probability of the expression level of VGAT relative to GAD65 in control (459 boutons) and VGAT-overexpressing (470 boutons) GABAergic (GAD65-positive) boutons. Control denotes syp-mOr–negative boutons (Cont), and +VGAT denotes syp-mOr–positive boutons. ***P < 0.001, Kolmogorov–Smirnov test. (D) Average increase in the ratio of VGAT immunoreactivity to GAD65 immunoreactivity in VGAT-overexpressing GABAergic boutons. ***P < 0.001, unpaired t test.
Fig. S7.
BC of VGAT-deleted and -rescued GABAergic SVs. (A) syp-mOr fluorescence in response to an NH4+ jump at GABAergic boutons from control (green; n = 17; 282 boutons), Cre-expressing (red; n = 12; 187 boutons), and Cre+VGAT-expressing (blue; n = 11; 166 boutons) VGATflox/flox neurons. (B) BC quantified from traces shown in A. We found no significant difference (P = 0.90, one-way ANOVA). The resting SV pH values were estimated from F/FpH 7.4 during acid application and are shown in Fig. 3D. Error bars indicate SEM.
Kinetics of GABA Uptake-Associated SV Alkalization.
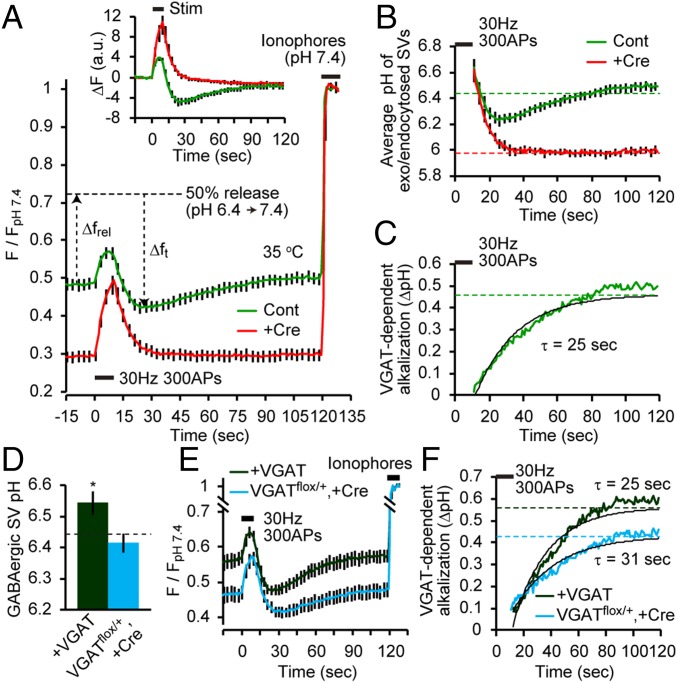
Finally, we attempted to estimate the rate of GABA uptake-associated alkalization. For this purpose, we recorded syp-mOr fluorescence in response to 300 stimuli at 35 °C in both control and VGAT-deficient GABAergic boutons (Fig. 4A, Inset). At this temperature, again, syp-mOr fluorescence in control boutons exhibited the characteristic overshoot and subsequent recovery, whereas boutons that lacked VGAT did not show the overshoot. Presumably, the rate of fluorescence change after cessation of stimulation in these two traces differs only in the presence of VGAT-dependent alkalization. Thus, when we convert the fluorescence decay of both traces to average changes in pH of exo-/endocytosed SVs and subtract one from the other, the kinetics of VGAT-dependent alkalization could be obtained. To this end, syp-mOr fluorescence traces were normalized to those during subsequently applied ionophores at pH 7.4 (Fig. 4A). Because differences in resting luminal pH can lead to differential photobleaching rates, the effect of photobleaching was corrected. To convert the fluorescence to an average pH of exo-/endocytosed SVs, a fraction of exocytosed vesicles during the stimulus must be estimated. As shown in Fig. S2, ∼50% of the vesicle fraction was exocytosed during stimulation at 25 °C. Because the rate and extent of vesicle release are independent of the recording temperature (30), we considered the observed fluorescence changes as those derived from the pH change in 50% of the total vesicle pool. We first calculated the maximal fluorescence increase that occurred when 50% of the vesicles were exocytosed (Δfrel) as follows:
where Frest and FpH 7.4 are the total fluorescence predicted when all probe molecules in a terminal are exposed to resting SV pH and pH 7.4, respectively. According to the Henderson–Hasselbalch equation, Frest/FpH 7.4 was given as follows:
where the resting SV pH values of control and VGAT-deficient GABAergic SVs were 6.42 and 5.98, respectively (Fig. 3D). The fluorescence from the released fraction was subsequently quenched because of vesicle acidification after endocytosis. The quenched fluorescence at a given time point (Δft) was similarly described using the average pH of exo-/endocytosed SVs at this time point (pHt) and the total fluorescence at pHt (FpHt):
Therefore, pHt was calculated as follows:
In Fig. 4B, time courses of pHt in the presence or absence of GABA uptake were illustrated. The subtraction of these two curves revealed the kinetics of GABA uptake-associated alkalization that followed exo-/endocytosis of 50% of the vesicles (Fig. 4C). The alkalization was fitted well by a single exponential function with a time constant of 25 s.
Fig. 4.
Kinetics of GABA uptake-associated SV alkalization. (A) syp-mOr fluorescence of GABAergic boutons from control (green; n = 12; 191 boutons) and Cre-expressing (red; n = 12; 154 boutons) VGATflox/flox neurons in response to field stimulation recorded at 35 °C. Signals were corrected for photobleaching and normalized to those during subsequently applied ionophores (pH 7.4). The maximal fluorescence increase caused by exocytosis of 50% of vesicles (Δfrel) and the quenched fraction caused by SV reacidification at a given time point (Δft) are indicated in the control trace by the up and down arrows, respectively. (Inset) syp-mOr fluorescence of the same datasets before correction for photobleaching was differentially normalized to the respective F0 and expressed as ΔF. (B) Average changes in SV pH of the exocytosed fraction from control (green) and VGAT-deficient (red) GABAergic boutons. Dashed lines indicate the resting SV pH values. Note that vesicular pH values of exo-/endocytosed SVs in both groups were calculated to be ∼6.6 at the cessation of the stimulus, because some SVs had been endocytosed and became partially acidified during the stimulus. (C) Kinetics of VGAT-dependent SV alkalization, which was obtained as the difference between the two average curves shown in B. A single exponential fitting yielded a time constant of 25 s. (D) GABAergic SV pH of VGAT-overexpressing VGATflox/flox neurons (dark green; n = 18; 256 boutons) and Cre-expressing VGATflox/+ neurons (blue; n = 11; 153 boutons). pH values of control GABAergic SVs, which are shown in Fig. 3D, are indicated by the dashed line and were compared with each group. *P < 0.05, unpaired t test. (E) syp-mOr fluorescence of GABAergic boutons from VGAT-overexpressing VGATflox/flox neurons (dark green; n = 14; 144 boutons) and Cre-expressing VGATflox/+ neurons (blue; n = 11; 122 boutons) in response to field stimulation recorded at 35 °C. Signals were corrected for photobleaching and normalized to those during subsequently applied ionophores (pH 7.4). (F) Kinetics of VGAT-dependent SV alkalization in VGAT-overexpressing and VGAT-heterozygous GABAergic SVs was calculated from the traces shown in D using a similar method. Note that the large ΔpH with an unaltered time constant in VGAT-overexpressing GABAergic SVs indicated an increased rate of alkalization. Error bars indicate SEM.
To validate our method to estimate the kinetics of SV alkalization associated with GABA transport, we examined neurons with modified VGAT expression levels. In the case of VGAT-heterozygous neurons (VGATflox/++Cre), alkalization was slower than the control (τ ∼ 31 s), whereas the resting pH was not altered (Fig. 4 D–F). In contrast, overexpression of VGAT increased the vesicular pH to 6.54 ± 0.04 and resulted in SV alkalization with an identical time constant as the control (Fig. 4 D–F), collectively indicating a faster alkalization rate. These results were consistent with the hypotheses that overexpression of vesicular neurotransmitter transporters would result in increased neurotransmitter content (32–34) with a faster transport rate and that a reduction in the transporter level would slow down the rate of transport.
Discussion
By using mOrange2, which has a pKa that is more suitable for monitoring the entire range of SV pH, we showed hitherto unrecognized features of luminal pH of GABAergic SVs in synapses in living neurons. The resting pH of 6.4 in GABAergic SVs is remarkably higher than that of glutamatergic SVs (5.8), which is considered to be a typical luminal pH of SVs and other secretory organelles (23). In addition, the pH dynamics of GABAergic SVs after endocytosis exhibited unique behavior involving an initial overacidification and subsequent recovery. In a previous study, cypHer5E, a pH-sensitive fluorescent dye (pKa = 7.1), was conjugated to an anti-VGAT C-terminal antibody and used to monitor GABAergic SV recycling, but no fluorescence overshoot after stimulation was apparent (17). One possible explanation is that its relatively high pKa may have somewhat obscured the phenomenon that reflects a pH change below ∼6.4. Indeed, in our pH imaging with sypHy, which has pKa that is similar to cypHer5E, the fluorescence overshoot in GABAergic terminals was not as prominent as that seen in syp-mOr imaging. Moreover, cypHer5E fluorescence, which is maximal at acidic pH, is not as photostable, and thus, photobleaching itself or the procedure to correct for photobleaching may have further masked the fluorescence overshoot and subsequent recovery.
Analysis of VGAT-deficient neurons revealed that a striking difference in the resting pH between glutamatergic SVs and GABAergic SVs as well as their pH dynamics after endocytosis largely resulted from the presence of GABA transport. The remainder of the pH difference (∼0.2 pH units) remains elusive, but it may be because of vesicle acidification as a result of glutamate transport (7) or the Cl– conductance that is intrinsic to VGLUTs (22, 35–37). Therefore, our results support the notion that, despite the similarity in molecular composition between glutamatergic and GABAergic SVs, SVs acquire unique properties because of the expression of their respective neurotransmitter transporters (5, 6, 21).
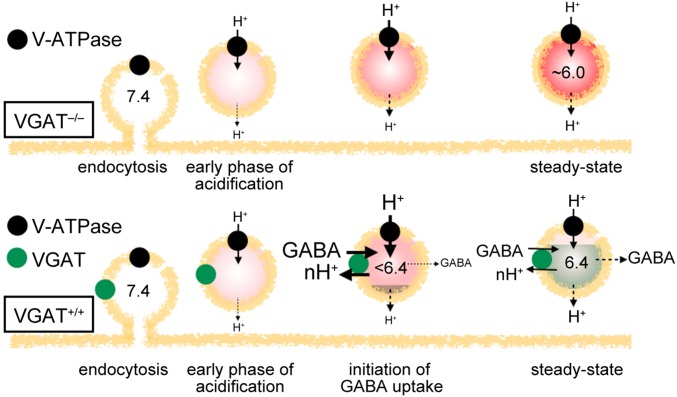
The unique biphasic pH dynamics observed in GABAergic SVs, which diminished in VGAT-deficient neurons, provides a number of insights into the proton-driven GABA transport mechanism. First, the observed VGAT-dependent alkalization of SVs after the transient overacidification strongly indicates that VGAT operates as a GABA/H+ exchanger (Fig. S8). In addition, acidification of GABAergic SVs must precede GABA uptake (i.e., protonation of the luminal side of VGAT is required for its activation). Such observations are in good agreement with earlier biochemical studies of GABA uptake into isolated SVs (9) that suggested a pivotal contribution of ΔpH on GABA transport and argue against an alternative model of ΔΨ-driven GABA/2Cl– cotransport (13). The latter mode of coupling seems unlikely in intact SVs, because Cl– entry coupled to GABA transport would promote acidification by dissipating ΔΨ (38). These conclusions are highly consistent with a recent investigation of isolated single SVs (14).
Fig. S8.
Mechanisms of the H+-coupled GABA transport revealed by pH dynamics in GABAergic SVs. (Upper) Without GABA transport (VGAT−/−), acidification by the V-ATPase (black circles) proceeds in the presence of low-level intrinsic H+ leakage, resulting in an SV pH of ∼6.0. (Lower) In contrast, in the presence of VGAT (green circles; VGAT+/+), H+ efflux coupled to GABA transport operates in addition to the intrinsic H+ leakage. At the initial phase when the pH is too high to activate VGAT, H+ influx exceeds the H+ leakage, leading to acidification. At some point, H+ efflux associated with GABA transport sums with the intrinsic H+ leakage and exceeds H+ influx, resulting in alkalization of SVs. At the steady state, substantial GABA transport occurs to offset nonspecific leakage of GABA. Concomitant H+ efflux coupled to GABA transport serves as an additional H+ efflux route. This mechanism shifts the equilibrium of H+, resulting in a higher SV pH of ∼6.4. For simplicity, other factors influencing SV pH and ΔΨ, such as Cl– channels and cation/H+ exchangers, are omitted because of the assumption that those factors are unaltered in VGAT-deficient SVs. Red symbolizes the acidification state ([H+]), and green indicates GABA levels.
Second, given that H+ efflux seems to be coupled to GABA transport, the higher steady-state pH of GABAergic SVs indicates that GABA transport produces a shift in the H+ equilibrium. This pH shift can be explained by the presence of substantial GABA leakage, requiring continuous H+-coupled GABA transport, even at steady state (Fig. S8). Such features seem in contrast to vesicular transport of cationic transmitters, such as dopamine and ACh. Although both transporters are coupled to exchange with H+ (39), the SV steady-state pH was measured at ∼5.6 (40, 41). The relatively lower pH of dopamine- and ACh-containing SVs may result from the impermeability of the charged cationic transmitters through the anionic phospholipid bilayer, and thus, ΔpH is not continuously consumed after SVs are packaged. In support of this view, a study of peripheral cholinergic synapses indicated that inhibition of the vesicular ACh transporter did not reduce vesicular content in the absence of stimulation (42). In contrast, at glycine/GABA coreleasing interneuron varicosities, the vesicular GABA content is depleted by blocking cytosolic GABA synthesis, independent of exocytosis (43). This leaky nature of GABA through the lipid bilayer was also shown in proteoliposomes (10). Thus, we conclude that continuous H+-coupled GABA transport is absolutely required to offset leakage and maintain the vesicular GABA content.
We estimated the kinetics of GABA uptake-associated alkalization as τ = 25 s at 35 °C. We reasonably assume that GABA transport is stoichiometrically coupled to H+ efflux and therefore, that refilling of GABA into SVs occurs on the order of several tens of seconds. Although the kinetics that we report represents the time required to load ∼50% of vesicles (almost all recycling pool vesicles), the rate of GABA uptake into SVs estimated here in living synapses is substantially faster than that measured previously using isolated SVs in vitro (τ is approximately several minutes) (44). However, the rate of GABA uptake is much slower than that of glutamate uptake measured at calyx of the Held synapses, which occurs with τ = 7 s at 35 °C (4). Consistent with the relatively fast kinetics of glutamate uptake compared with vesicle reuse (45), release of partially filled vesicles was not detected, even after high-frequency stimulation at glutamatergic synapses (46). However, whether GABAergic quantal size can be altered by high-frequency firing remains unknown. Our results allow the possibility that refilling of GABAergic vesicles fails to keep up with sustained transmission.
Materials and Methods
Additional information is in SI Materials and Methods.
Neuronal Cultures.
Primary hippocampal cultures were prepared from 0- to 1-d-old mice as described previously (3). Cultures were infected with a pair of lentiviruses to express syp-mOr or sypHy at 6–7 d in vitro (DIV) and imaged at 13–16 DIV unless otherwise noted. To conditionally delete VGAT in cultures prepared from VGATflox/flox mice, cultures were infected with the “regulator” lentivirus vector carrying either Cre-P2A-advanced tetracycline transactivator (tTAad) or tTAad alone at 0 DIV and the “response” vector at 7 DIV. All animal experiments were conducted with the approval of the Institutional Animal Care and Use Committee at Doshisha University.
Live Imaging and Analysis.
Cells cultured on a 27-mm-diameter glass-bottomed dish were placed in a custom-made imaging chamber on a movable stage and continuously perfused with standard extracellular solution containing 140 mM NaCl, 2.4 mM KCl, 10 mM Hepes, 10 mM glucose, 2 mM CaCl2, 1 mM MgCl2, 0.02 mM 6-cyano-7-nitroquinoxaline-2,3-dione (CNQX), and 0.025 mM d-2-amino-5-phosphonovaleric acid (d-APV) (pH 7.4). Solutions used during image acquisition were applied directly onto the area of interest with a combination of a fast flow exchange microperfusion device and a bulb controller, both of which were controlled by Clampex 10.2. For acid quenching of surface probes, MES-buffered (pKa = 6.1; 10 mM) solution at pH 5.5 was applied. During the experiments using acid quenching, 2 mM Ca2+ was replaced with 2 mM Mg2+, except during electrical stimulation, when a standard extracellular solution was applied. For field electrical stimulation, 1-ms constant voltage pulses (50 V) were delivered via bipolar platinum electrodes. A mixture of ionophores was composed of 20 µM carbonyl cyanide-p-trifluoromethoxyphenylhydrazone (FCCP), 10 µM valinomycin, 10 µM nigericin, and 0.02% Triton X-100 in K+-rich solution, in which 120 mM NaCl was replaced with 120 mM KCl and puff applied onto target boutons using a pulse pressure device.
Fluorescence imaging was carried out on an inverted microscope (Olympus) equipped with a 60× (1.35 N.A.) oil immersion objective and 75-W Xenon lamp. Live imaging was performed at room temperature (∼25 °C) unless otherwise noted. Images (600 × 900 pixels) were acquired with a scientific complementary–metal–oxide semiconductor (cMOS) camera (ANDOR) in a streaming mode at a 5-Hz sampling rate for measuring SV pH and BC or a time-lapse mode at 1 Hz for measuring the fluorescence response to field stimuli. Venus and sypHy were imaged with 459- to 481-nm excitation and 499- to 529-nm emission filters, respectively. syp-mOr and tdTomato were imaged with 546- to 566-nm excitation and 575- to 625-nm emission filters, respectively. Although the fluorescent spectra of Venus and mOrange are relatively close, above filter sets effectively separate them at the expense of signal intensities, and no bleed through was observed.
Acquired images were analyzed using MetaMorph software. Circular regions of interest (ROIs; 2.26-µm diameter) were manually positioned at the center of fluorescent puncta. Another five ROIs of the same size were positioned at regions where no cell structures were visible, and their average fluorescence was subtracted as a background signal. Data for <20 boutons from a single experiment were averaged and counted as an n of 1. Data were collected from at least three different dishes.
SI Materials and Methods
Molecular Biology.
syp-mOr and sypHy were expressed in a neuron-specific manner by using lentivirus-based vectors in combination with the Tet-Off system (20). Two vectors were used, a regulator vector expressing a tTAad under the control of the human synapsin1 promoter and a response vector that expressed syp-mOr or sypHy under the control of a modified tetracycline response element composite promoter. To conditionally knockout VGAT in neurons derived from floxed VGAT mice, the regulatory vector was modified to bicistronically express Cre and tTAad. We synthesized a DNA fragment encoding a self-cleaving P2A peptide (47) after Cre, with codon use that was optimized for use in mammalian cells. This Cre-P2A sequence was cloned between the synapsin promoter and tTAad sequence of the backbone plasmid (pLenti6PW) for the regulator vector.
Mice.
Generation of VGAT-Venus and floxed VGAT mice has been described previously (19, 31). Floxed VGAT mice were repeatedly crossed with VGAT-Venus mice to obtain VGAT-VenusTg/+, VGATflox/flox double-Tg mice, which were used to measure the luminal pH of VGAT-deficient GABAergic SVs using syp-mOr. To discriminate GABAergic boutons from glutamatergic boutons in neurons expressing sypHy, we generated VGAT-floxed STOP-tdTomato Tg mice, in which GABAergic neurons specifically express the red fluorescence protein tdTomato in the presence of Cre. The VGAT-floxed STOP-tdTomato Tg mice were generated by insertion of the floxedSTOP sequence and tdTomato cDNA with a rabbit β-globin polyadenylation signal under the control of VGAT BAC (clone 160L22 from a 129SV mouse genomic BAC library; Genome System) (27). The generation and expression analysis of VGAT-floxed STOP-tdTomato Tg mice will be described in detail elsewhere. To induce Cre-mediated tdTomato expression in GABAergic neurons throughout the whole brain, VGAT-floxed STOP-tdTomato Tg mice were crossed with Nestin-Cre Tg mice that specifically express Cre in neuronal and glial precursor cells (28). Pups of VGAT-floxed STOP-tdTomatoTg/+, Nestin-CreTg/+ double-Tg mice were identified by visualizing the tdTomato fluorescence through the skull, and their hippocampi were used for experiments. Animals were treated according to our institutional guidelines for the care and use of animals.
Genotyping.
Genotyping of VGAT-Venus, floxed VGAT, and Nestin-Cre mice was described previously (19, 28, 31). For genotyping of VGAT-Venus and floxed VGAT double-Tg mice, primers designed for genotyping of the floxed VGAT mice (31) cannot be used, because the transgene in VGAT-Venus mice contains an untranslated VGAT gene fragment that is identical to the WT VGAT allele, except for the presence of the Venus-poly(A) sequence in the 5′ region of exon 1. Thus, we performed two PCR steps to discriminate VGAT-VenusTg/+, VGATflox/flox mice from VGAT-VenusTg/+, VGATflox/+ mice. The first PCR was carried out using the following oligonucleotides: primer 1 (5′-GACCCTTCTGTCCTTTTCTCCCG-3′) and primer 2 (5′-GTAGACACAGGGTCTTGGGGAAC-3′), which correspond to exon 1 of VGAT gene. Primers 1 and 2 amplified ∼2.9-kb fragments for the VGAT-Venus transgene and ∼2.1-kb fragments for both WT and floxed VGAT alleles. Although the PCR products amplified from the WT and floxed VGAT alleles were slightly different in length, they were indistinguishable in agarose gel electrophoresis. Thus, the ∼2.1-kb fragments were extracted and subjected to the second PCR using primers 2 and 3 (5′-CTTTTGGCCCTCCCCTCTCCTCAG-3′), which correspond to the 5′ flanking region of VGAT. Primers 2 and 3 amplified 218-bp fragments for the WT allele and 267-bp fragments for the floxed allele.
For genotyping of VGAT-floxed STOP-tdTomato mice, PCR using the following oligonucleotides was performed: primer 4 (5′-AAGAGATTGCATGGACCTTGG-3′), primer 5 (5′-TCCAGCATATAACAGCACCAG-3′), and primer 6 (5′-TCATCGCTCTGGAGTGAATACC-3′). Primers 4 and 5 amplify 668-bp fragments for the WT allele. Primers 5 and 6 amplify 399-bp fragments for the VGAT-floxed STOP-tdTomato transgene.
Lentivirus Production.
The lentiviruses were produced in HEK 293T cells as described previously (3). HEK 293T cells were transfected with 15 µg lentiviral backbone vector and helper plasmids (10 µg pCAG-kGP1, 5 µg pCAG4-RTR2, and 5 µg pCAG-VSVG) using a calcium phosphate transfection method; 10–16 h after transfection, culture medium was replaced with fresh Neurobasal A medium (Gibco) supplemented with 2% (vol/vol) B27 (Gibco) and 0.5 mM glutamine. Supernatants were collected 48 h after transfection and filtered to remove cell debris. Aliquots were flash frozen in liquid nitrogen and stored at −80 °C until use. Viral titer was estimated using the Lenti-X qRT-PCR Titration Kit (Clontech) according to the manufacturer’s instructions. Primary neuronal cultures were infected with 20–60 µL viral solution (0.1–10 × 105 copies per 1 µL).
Immunostaining.
Neural cultures were fixed with 4% (wt/vol) paraformaldehyde in phosphate buffer (Wako) for up to 1 h at room temperature (RT) or overnight at 4 °C. After washing with PBS containing 137 mM NaCl, 2.7 mM KCl, 10 mM Na2HPO4, and 1.76 mM KH2PO4 (pH ∼7.3), permeabilization and blocking of nonspecific binding were done by incubating cells with PBS containing 5% (vol/vol) FBS and 0.1% Triton X-100 for 20 min at RT. Cells were incubated with the following primary antibodies for 3 h at RT: rabbit anti-VGLUT1 (48) (1:2,000), mouse anti-VGAT (1:1,000; 117G4; Synaptic Systems), rabbit anti-VGAT (49) (1:1,000), or mouse anti-GAD65 (1:1,000; MAB351; Millipore). Cells were rinsed three times with PBS for 5 min and incubated with the following secondary antibodies for 1 h at RT: Alexa-647– or Alexa-488–conjugated anti-rabbit or -mouse IgG (1:1,000; Invitrogen). Fluorescence of Alexa-647 was acquired with 604- to 644-nm excitation and 672- to 712-nm emission filters, respectively.
Electrophysiological Recordings and Optogenetic Stimulation.
Primary hippocampal cultures prepared from VGATflox/flox mice, in which some neurons virally expressed channelrhodopsin (ChRFR)-Venus with or without Cre, were used for electrophysiological recordings at 13–15 DIV. Whole-cell voltage clamp recordings at a holding potential of −70 mV were performed in ChRFR-Venus–negative cells at RT (∼25 °C) using a Multiclamp 700B Amplifier (Molecular Devices) under the control of Clampex 10.2 (Molecular Devices). Neurons were continuously perfused with extracellular solution containing 140 mM NaCl, 2.4 mM KCl, 10 mM Hepes, 4 mM CaCl2, 4 mM MgCl2, and 10 mM d-glucose (pH 7.3–7.4; 300–310 mOsm). The patch pipette internal solution contained 136 mM KCl, 17.8 mM Hepes, 1 mM EGTA, 0.6 mM MgCl2, 4 mM ATP-Mg, 0.3 mM GTP-Na, 5 mM QX-314, 12 mM phosphocreatine, and 50 U/mL phosphocreatine kinase (pH 7.3–7.4; 290–300 mOsm). To activate ChRFR, a brief flash of light (∼10 ms), passing through a 470-/22-nm bandpass filter, was delivered through the objective. Light from a 75-W xenon lamp was gated with a Lambda 10–3 Shutter (Sutter Instruments) under the control of Clampex 10.2. Inhibitory postsynaptic currents (IPSCs) were isolated by blocking excitatory transmission with 20 µM CNQX and 25 µM d-APV. Excitatory postsynaptic currents (EPSCs) were isolated by blocking inhibitory transmission with 100 μM picrotoxin. Data were digitized at 10 kHz and low pass filtered at 3 kHz. Series resistance was compensated for by at least 70%. Recordings with series resistance <15 MΩ were analyzed using Clampfit 10.2 (Molecular Devices).
Image Analysis.
Acquired images were analyzed using MetaMorph software. Circular ROIs (2.26-µm diameter) were manually positioned at the center of fluorescent puncta. Another five ROIs of the same size were positioned at regions where no cell structures were visible, and their average fluorescence was subtracted as a background signal. For experiments monitoring the syp-mOr response to field stimulation, active synapses were selected based on changes in live measurements of syp-mOr fluorescence. Changes in fluorescence were quantified by subtracting the average of five consecutive images taken during an initial baseline period from the average of five consecutive images taken just after electrical stimulation. For experiments measuring the recycling pool size, however, puncta were randomly selected. For SV pH and BC measurements, we selected puncta that showed stable signals during treatment with the ionophore mixture. For experiments in which the rate of VGAT-dependent alkalization was deduced (Fig. 4), the effect of photobleaching was corrected. Before each experiment, the extent of photobleaching was quantified at each bouton using the same image acquisition protocol without any experimental manipulation. The averaged decay in F/F0 was fitted with a double exponential, which was used to correct the signal from the subsequent recording. Data for <20 boutons from a single experiment were averaged and counted as an n of one. Data were collected from at least three different dishes.
Estimation of SV pH.
Resting SV pH and the surface fraction of the probe were estimated as described previously (3). Briefly, syp-mOr or sypHy fluorescence during acid quenching (FQ) and during subsequent application of the mixture of ionophores (FpH 7.4) was measured. The observed fluorescence in a given terminal is thought to be the sum of the fluorescence derived from the surface fraction (S) that experiences extracellular pH and from the vesicular fraction (1 − S) that experiences SV pH (pHv). The fluorescence during the baseline period (F0) and the fluorescence during FQ were expressed as
| [S1] |
and
| [S2] |
where FpH 5.5 and FpHv are the total fluorescence values predicted when all probe molecules in a terminal are exposed to pH 5.5 and pHv, respectively. By solving Eqs. S1 and S2, S and FpHv/FpH 7.4 were calculated as follows:
and
According to the Henderson–Hasselbalch equation, FpH 5.5/FpH 7.4 was given as follows:
where the pKa values of syp-mOr and sypHy were 6.5 and 7.1, respectively, and the nH values (Hill coefficients) of syp-mOr and sypHy were 1.0 and 1.35, respectively, as reported previously (3). SV pH (pHv) was then calculated as follows:
Calculation of the BC.
The BC of the SV lumen was estimated using the ammonium pulse method described previously (3). syp-mOr fluorescence was measured during application of various concentrations of NH4Cl. BC was defined as the amount of acid or base required to shift the pH by one unit and was calculated as
where Δ[NH4+]v is the change in ammonium ion concentration inside the SV lumen, and ΔpHv is the change in vesicular pH.
Vesicular pH (pHv) during each NH4Cl step was calculated using the same method for estimating the resting vesicular pH (see above). [NH4+]v was equivalent to the amount of protons removed from SVs and calculated as follows:
where [NH4+]tot is the applied NH4Cl concentration, [H+]v is the vesicular proton concentration, [H+]ex is the extracellular proton concentration, and Ka is the dissociation constant of NH4+. Removed proton concentrations were plotted against resulting vesicular pH values in Fig. S3B and showed a linear relationship. BC was estimated as the slope of the linear fit.
Statistics.
All data are shown as the means ± SEM. The unpaired t test was applied to compare means of two experimental groups. For comparison of three or more groups, one-way ANOVA followed by Bonferroni’s test was applied. To compare the distribution of two groups, the Kolmogorov–Smirnov test was applied. All statistical tests were two-tailed, and the level of statistical significance is indicated by asterisks: *P < 0.05; **P < 0.01; ***P < 0.001.
Acknowledgments
We thank Drs. Hiromu Yawo and Atsushi Miyawaki for providing materials and pCS-Venus, respectively, and Drs. Mark Rigby, Hiroaki Misonou, and Shin-ya Kawaguchi for critically reading the manuscript. This work was supported by Japan Society for the Promotion of Science (JSPS) KAKENHI Grants 16K18397 (to Y.E.), 26290002 (to Y.Y.), 15H01415 (to Y.Y.), 15H05872 (to Y.Y.), and 16H04675 (to S.T.); a grant from the Takeda Science Foundation (to Y.Y.); the Japanese Ministry of Education, Culture, Sports, Science, and Technology (MEXT) Grant-in-Aid for Scientific Research on Innovative Areas 26115716 (to S.T.); and a JSPS Core-to-Core Program, A. Advanced Research Networks grant (to S.T.).
Footnotes
The authors declare no conflict of interest.
This article is a PNAS Direct Submission. R.H.E. is a Guest Editor invited by the Editorial Board.
This article contains supporting information online at www.pnas.org/lookup/suppl/doi:10.1073/pnas.1604527113/-/DCSupplemental.
References
- 1.Südhof TC. The synaptic vesicle cycle. Annu Rev Neurosci. 2004;27:509–547. doi: 10.1146/annurev.neuro.26.041002.131412. [DOI] [PubMed] [Google Scholar]
- 2.Edwards RH. The neurotransmitter cycle and quantal size. Neuron. 2007;55(6):835–858. doi: 10.1016/j.neuron.2007.09.001. [DOI] [PubMed] [Google Scholar]
- 3.Egashira Y, Takase M, Takamori S. Monitoring of vacuolar-type H+ ATPase-mediated proton influx into synaptic vesicles. J Neurosci. 2015;35(8):3701–3710. doi: 10.1523/JNEUROSCI.4160-14.2015. [DOI] [PMC free article] [PubMed] [Google Scholar]
- 4.Hori T, Takahashi T. Kinetics of synaptic vesicle refilling with neurotransmitter glutamate. Neuron. 2012;76(3):511–517. doi: 10.1016/j.neuron.2012.08.013. [DOI] [PubMed] [Google Scholar]
- 5.Takamori S, Riedel D, Jahn R. Immunoisolation of GABA-specific synaptic vesicles defines a functionally distinct subset of synaptic vesicles. J Neurosci. 2000;20(13):4904–4911. doi: 10.1523/JNEUROSCI.20-13-04904.2000. [DOI] [PMC free article] [PubMed] [Google Scholar]
- 6.Grønborg M, et al. Quantitative comparison of glutamatergic and GABAergic synaptic vesicles unveils selectivity for few proteins including MAL2, a novel synaptic vesicle protein. J Neurosci. 2010;30(1):2–12. doi: 10.1523/JNEUROSCI.4074-09.2010. [DOI] [PMC free article] [PubMed] [Google Scholar]
- 7.Maycox PR, Deckwerth T, Hell JW, Jahn R. Glutamate uptake by brain synaptic vesicles. Energy dependence of transport and functional reconstitution in proteoliposomes. J Biol Chem. 1988;263(30):15423–15428. [PubMed] [Google Scholar]
- 8.Tabb JS, Kish PE, Van Dyke R, Ueda T. Glutamate transport into synaptic vesicles. Roles of membrane potential, pH gradient, and intravesicular pH. J Biol Chem. 1992;267(22):15412–15418. [PubMed] [Google Scholar]
- 9.Hell JW, Maycox PR, Jahn R. Energy dependence and functional reconstitution of the gamma-aminobutyric acid carrier from synaptic vesicles. J Biol Chem. 1990;265(4):2111–2117. [PubMed] [Google Scholar]
- 10.Hell JW, Edelmann L, Hartinger J, Jahn R. Functional reconstitution of the gamma-aminobutyric acid transporter from synaptic vesicles using artificial ion gradients. Biochemistry. 1991;30(51):11795–11800. doi: 10.1021/bi00115a009. [DOI] [PubMed] [Google Scholar]
- 11.McIntire SL, Reimer RJ, Schuske K, Edwards RH, Jorgensen EM. Identification and characterization of the vesicular GABA transporter. Nature. 1997;389(6653):870–876. doi: 10.1038/39908. [DOI] [PubMed] [Google Scholar]
- 12.Sagné C, et al. Cloning of a functional vesicular GABA and glycine transporter by screening of genome databases. FEBS Lett. 1997;417(2):177–183. doi: 10.1016/s0014-5793(97)01279-9. [DOI] [PubMed] [Google Scholar]
- 13.Juge N, Muroyama A, Hiasa M, Omote H, Moriyama Y. Vesicular inhibitory amino acid transporter is a Cl-/gamma-aminobutyrate Co-transporter. J Biol Chem. 2009;284(50):35073–35078. doi: 10.1074/jbc.M109.062414. [DOI] [PMC free article] [PubMed] [Google Scholar]
- 14.Farsi Z, et al. Single-vesicle imaging reveals different transport mechanisms between glutamatergic and GABAergic vesicles. Science. 2016;351(6276):981–984. doi: 10.1126/science.aad8142. [DOI] [PubMed] [Google Scholar]
- 15.Burger PM, et al. Synaptic vesicles immunoisolated from rat cerebral cortex contain high levels of glutamate. Neuron. 1989;3(6):715–720. doi: 10.1016/0896-6273(89)90240-7. [DOI] [PubMed] [Google Scholar]
- 16.Miesenböck G, De Angelis DA, Rothman JE. Visualizing secretion and synaptic transmission with pH-sensitive green fluorescent proteins. Nature. 1998;394(6689):192–195. doi: 10.1038/28190. [DOI] [PubMed] [Google Scholar]
- 17.Hua Y, et al. A readily retrievable pool of synaptic vesicles. Nat Neurosci. 2011;14(7):833–839. doi: 10.1038/nn.2838. [DOI] [PubMed] [Google Scholar]
- 18.Shaner NC, et al. Improving the photostability of bright monomeric orange and red fluorescent proteins. Nat Methods. 2008;5(6):545–551. doi: 10.1038/nmeth.1209. [DOI] [PMC free article] [PubMed] [Google Scholar]
- 19.Wang Y, et al. Fluorescent labeling of both GABAergic and glycinergic neurons in vesicular GABA transporter (VGAT)-venus transgenic mouse. Neuroscience. 2009;164(3):1031–1043. doi: 10.1016/j.neuroscience.2009.09.010. [DOI] [PubMed] [Google Scholar]
- 20.Hioki H, et al. High-level transgene expression in neurons by lentivirus with Tet-Off system. Neurosci Res. 2009;63(2):149–154. doi: 10.1016/j.neures.2008.10.010. [DOI] [PubMed] [Google Scholar]
- 21.Takamori S, Rhee JS, Rosenmund C, Jahn R. Identification of a vesicular glutamate transporter that defines a glutamatergic phenotype in neurons. Nature. 2000;407(6801):189–194. doi: 10.1038/35025070. [DOI] [PubMed] [Google Scholar]
- 22.Bellocchio EE, Reimer RJ, Fremeau RT, Jr, Edwards RH. Uptake of glutamate into synaptic vesicles by an inorganic phosphate transporter. Science. 2000;289(5481):957–960. doi: 10.1126/science.289.5481.957. [DOI] [PubMed] [Google Scholar]
- 23.Casey JR, Grinstein S, Orlowski J. Sensors and regulators of intracellular pH. Nat Rev Mol Cell Biol. 2010;11(1):50–61. doi: 10.1038/nrm2820. [DOI] [PubMed] [Google Scholar]
- 24.Fernandez-Alfonso T, Ryan TA. A heterogeneous “resting” pool of synaptic vesicles that is dynamically interchanged across boutons in mammalian CNS synapses. Brain Cell Biol. 2008;36(1-4):87–100. doi: 10.1007/s11068-008-9030-y. [DOI] [PMC free article] [PubMed] [Google Scholar]
- 25.Sankaranarayanan S, De Angelis D, Rothman JE, Ryan TA. The use of pHluorins for optical measurements of presynaptic activity. Biophys J. 2000;79(4):2199–2208. doi: 10.1016/S0006-3495(00)76468-X. [DOI] [PMC free article] [PubMed] [Google Scholar]
- 26.Granseth B, Odermatt B, Royle SJ, Lagnado L. Clathrin-mediated endocytosis is the dominant mechanism of vesicle retrieval at hippocampal synapses. Neuron. 2006;51(6):773–786. doi: 10.1016/j.neuron.2006.08.029. [DOI] [PubMed] [Google Scholar]
- 27.Fujihara K, et al. Glutamate decarboxylase 67 deficiency in a subset of GABAergic neurons induces schizophrenia-related phenotypes. Neuropsychopharmacology. 2015;40(10):2475–2486. doi: 10.1038/npp.2015.117. [DOI] [PMC free article] [PubMed] [Google Scholar]
- 28.Tronche F, et al. Disruption of the glucocorticoid receptor gene in the nervous system results in reduced anxiety. Nat Genet. 1999;23(1):99–103. doi: 10.1038/12703. [DOI] [PubMed] [Google Scholar]
- 29.Grabe M, Oster G. Regulation of organelle acidity. J Gen Physiol. 2001;117(4):329–344. doi: 10.1085/jgp.117.4.329. [DOI] [PMC free article] [PubMed] [Google Scholar]
- 30.Granseth B, Lagnado L. The role of endocytosis in regulating the strength of hippocampal synapses. J Physiol. 2008;586(24):5969–5982. doi: 10.1113/jphysiol.2008.159715. [DOI] [PMC free article] [PubMed] [Google Scholar]
- 31.Kayakabe M, et al. Motor dysfunction in cerebellar Purkinje cell-specific vesicular GABA transporter knockout mice. Front Cell Neurosci. 2014;7:286. doi: 10.3389/fncel.2013.00286. [DOI] [PMC free article] [PubMed] [Google Scholar]
- 32.Song H, et al. Expression of a putative vesicular acetylcholine transporter facilitates quantal transmitter packaging. Neuron. 1997;18(5):815–826. doi: 10.1016/s0896-6273(00)80320-7. [DOI] [PubMed] [Google Scholar]
- 33.Pothos EN, Davila V, Sulzer D. Presynaptic recording of quanta from midbrain dopamine neurons and modulation of the quantal size. J Neurosci. 1998;18(11):4106–4118. doi: 10.1523/JNEUROSCI.18-11-04106.1998. [DOI] [PMC free article] [PubMed] [Google Scholar]
- 34.Wojcik SM, et al. An essential role for vesicular glutamate transporter 1 (VGLUT1) in postnatal development and control of quantal size. Proc Natl Acad Sci USA. 2004;101(18):7158–7163. doi: 10.1073/pnas.0401764101. [DOI] [PMC free article] [PubMed] [Google Scholar]
- 35.Schenck S, Wojcik SM, Brose N, Takamori S. A chloride conductance in VGLUT1 underlies maximal glutamate loading into synaptic vesicles. Nat Neurosci. 2009;12(2):156–162. doi: 10.1038/nn.2248. [DOI] [PubMed] [Google Scholar]
- 36.Preobraschenski J, Zander JF, Suzuki T, Ahnert-Hilger G, Jahn R. Vesicular glutamate transporters use flexible anion and cation binding sites for efficient accumulation of neurotransmitter. Neuron. 2014;84(6):1287–1301. doi: 10.1016/j.neuron.2014.11.008. [DOI] [PubMed] [Google Scholar]
- 37.Eriksen J, et al. Protons regulate vesicular glutamate transporters through an allosteric mechanism. Neuron. 2016;90(4):768–780. doi: 10.1016/j.neuron.2016.03.026. [DOI] [PMC free article] [PubMed] [Google Scholar]
- 38.Ahnert-Hilger G, Jahn R. CLC-3 spices up GABAergic synaptic vesicles. Nat Neurosci. 2011;14(4):405–407. doi: 10.1038/nn.2786. [DOI] [PubMed] [Google Scholar]
- 39.Parsons SM. Transport mechanisms in acetylcholine and monoamine storage. FASEB J. 2000;14(15):2423–2434. doi: 10.1096/fj.00-0203rev. [DOI] [PubMed] [Google Scholar]
- 40.Füldner HH, Stadler H. 31P-NMR analysis of synaptic vesicles. Status of ATP and internal pH. Eur J Biochem. 1982;121(3):519–524. doi: 10.1111/j.1432-1033.1982.tb05817.x. [DOI] [PubMed] [Google Scholar]
- 41.Mani M, Ryan TA. Live imaging of synaptic vesicle release and retrieval in dopaminergic neurons. Front Neural Circuits. 2009;3:3. doi: 10.3389/neuro.04.003.2009. [DOI] [PMC free article] [PubMed] [Google Scholar]
- 42.Cabeza R, Collier B. Acetylcholine mobilization in a sympathetic ganglion in the presence and absence of 2-(4-phenylpiperidino)cyclohexanol (AH5183) J Neurochem. 1988;50(1):112–121. doi: 10.1111/j.1471-4159.1988.tb13237.x. [DOI] [PubMed] [Google Scholar]
- 43.Apostolides PF, Trussell LO. Rapid, activity-independent turnover of vesicular transmitter content at a mixed glycine/GABA synapse. J Neurosci. 2013;33(11):4768–4781. doi: 10.1523/JNEUROSCI.5555-12.2013. [DOI] [PMC free article] [PubMed] [Google Scholar]
- 44.Kish PE, Fischer-Bovenkerk C, Ueda T. Active transport of gamma-aminobutyric acid and glycine into synaptic vesicles. Proc Natl Acad Sci USA. 1989;86(10):3877–3881. doi: 10.1073/pnas.86.10.3877. [DOI] [PMC free article] [PubMed] [Google Scholar]
- 45.Ryan TA, et al. The kinetics of synaptic vesicle recycling measured at single presynaptic boutons. Neuron. 1993;11(4):713–724. doi: 10.1016/0896-6273(93)90081-2. [DOI] [PubMed] [Google Scholar]
- 46.Zhou Q, Petersen CC, Nicoll RA. Effects of reduced vesicular filling on synaptic transmission in rat hippocampal neurones. J Physiol. 2000;525(Pt 1):195–206. doi: 10.1111/j.1469-7793.2000.t01-1-00195.x. [DOI] [PMC free article] [PubMed] [Google Scholar]
- 47.Kim JH, et al. High cleavage efficiency of a 2A peptide derived from porcine teschovirus-1 in human cell lines, zebrafish and mice. PLoS One. 2011;6(4):e18556. doi: 10.1371/journal.pone.0018556. [DOI] [PMC free article] [PubMed] [Google Scholar]
- 48.Takamori S, Rhee JS, Rosenmund C, Jahn R. Identification of differentiation-associated brain-specific phosphate transporter as a second vesicular glutamate transporter (VGLUT2) J Neurosci. 2001;21(22):RC182. doi: 10.1523/JNEUROSCI.21-22-j0002.2001. [DOI] [PMC free article] [PubMed] [Google Scholar]
- 49.Martens H, et al. Unique luminal localization of VGAT-C terminus allows for selective labeling of active cortical GABAergic synapses. J Neurosci. 2008;28(49):13125–13131. doi: 10.1523/JNEUROSCI.3887-08.2008. [DOI] [PMC free article] [PubMed] [Google Scholar]
- 50.Wojcik SM, et al. A shared vesicular carrier allows synaptic corelease of GABA and glycine. Neuron. 2006;50(4):575–587. doi: 10.1016/j.neuron.2006.04.016. [DOI] [PubMed] [Google Scholar]


