Significance
Proper timing of flowering transition is vital for the reproductive success of plants and orchestrated by endogenous and external factors; however, the mechanisms of how plants regulate flowering under high light are not well understood. In this study, we show that promotion of flowering by high light involves the coupling of chloroplast retrograde signals and transcriptional silencing of the floral repressor FLOWERING LOCUS C (FLC). In response to high light, a chloroplast envelope-localized transcription factor, PTM, releases its N-terminal fragment through processing to associate with the chromatin remodeler FVE and suppresses FLC transcription. This report describes the molecular basis for a unique intracellular signaling pathway derived from chloroplasts in which plants regulate the developmental timing of the flowering transition.
Keywords: chloroplast retrograde signals, flowering regulation, FLC, chromatin remodeling, high light
Abstract
Light is a major environmental factor regulating flowering time, thus ensuring reproductive success of higher plants. In contrast to our detailed understanding of light quality and photoperiod mechanisms involved, the molecular basis underlying high light-promoted flowering remains elusive. Here we show that, in Arabidopsis, a chloroplast-derived signal is critical for high light-regulated flowering mediated by the FLOWERING LOCUS C (FLC). We also demonstrate that PTM, a PHD transcription factor involved in chloroplast retrograde signaling, perceives such a signal and mediates transcriptional repression of FLC through recruitment of FVE, a component of the histone deacetylase complex. Thus, our data suggest that chloroplasts function as essential sensors of high light to regulate flowering and adaptive responses by triggering nuclear transcriptional changes at the chromatin level.
The transition from the vegetative phase to the reproductive phase, also called flowering, is a crucial developmental switch in higher plants and is profoundly affected by various environmental and endogenous factors, including light, temperature, hormone status, and age (1, 2). In the model dicotyledonous plant Arabidopsis thaliana, genetic networks defining the intricate mechanisms by which plants initiate the floral induction have been studied extensively over the past several decades (3, 4). The photoperiod and vernalization pathways monitor the seasonal changes in day length and prolonged exposure to winter cold, respectively, to control flowering time, whereas ambient growth temperature regulates flowering independently. In addition, flowering time also responds to intrinsic signals, including the growth regulator gibberellin, endogenous carbohydrate levels, age-dependent changes in the expression of specific microRNAs, and the autonomous pathway. These different genetic pathways ultimately converge to regulate a set of floral integrator genes, FLOWERING LOCUS T (FT) and SUPPRESSOR OF CONSTANS 1 (SOC1), which in turn activate the expression of floral meristem identity genes to trigger the formation of flowers (5–10).
Among the central players in flowering regulation, FLOWERING LOCUS C (FLC) is the potent floral repressor gene encoding a MADS-box transcription factor (11, 12). In winter-annual Arabidopsis, FLC expression is stably silenced by prolonged cold exposure during winter and then maintained until embryogenesis in an epigenetic-dependent manner. This process involves the polycomb-mediated multiple chromatin regulation and different long noncoding RNA (lncRNA) transcription to quantitatively repress the FLC gene expression, thereby enabling other floral promotion signals to induce flowering in the spring (13, 14).
Light is one of the most prominent environmental factors in the regulation of flowering at multiple levels, including light quality, intensity, and duration. Intensive molecular and genetic studies have provided considerable insight into the relevant mechanisms, particularly with regard to light quality and photoperiod (6, 15). For photoperiodic flowering, light is perceived in leaves by the sensory photoreceptors, phytochromes and cryptochromes, to coincide with the rhythmic expression of CONSTANS (CO), mediated by the cooperation of two circadian clock components, GIGANTEA (GI) and FLAVIN KELCH F BOX1 (FKF1) (16–18). The CO protein in turn is stabilized by light and accumulates only under long days to activate transcription of the FT gene, whose product then acts as a mobile signal and travels to the shoot apical meristem to induce floral transition through interaction with the bZIP transcription factor FD (19–21).
The flowering transition is also regulated by light quality, mainly shade light conditions with an altered ratio of red to far-red light (R:FR). Under shade conditions, the red light photoreceptor phytochrome B (phyB) acts through PHYTOCHROME AND FLOWERING TIME 1 (PFT1) to increase FT expression and promote flowering, in part by enhancing the CO-dependent photoperiodic response (22, 23).
As a key parameter of light, light intensity also plays independently essential roles in flowering time regulation (24). Arabidopsis, like many higher plants, responds to high light by increasing the vegetative growth rate and accelerating its reproductive transition (25). The molecular mechanisms involved in light intensity control of flowering remain largely unknown, however.
In this study, we used a combination of biochemical and genetic approaches to reveal an unexpected role of chloroplasts in high light-mediated flowering, and have established a molecular framework that links the functional state of the endosymbiotic organelles to the nuclear transcriptional regulation of FLC through a retrograde signaling pathway. Our study also provides a unique perspective on how plastid information is perceived and translated into the histone code through intracellular coordination to control plant developmental reprogramming and growth.
Results
High Light-Induced Flowering Requires FLC Activity.
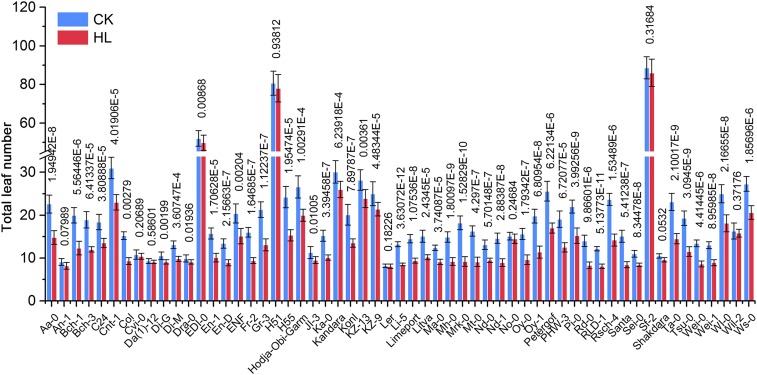
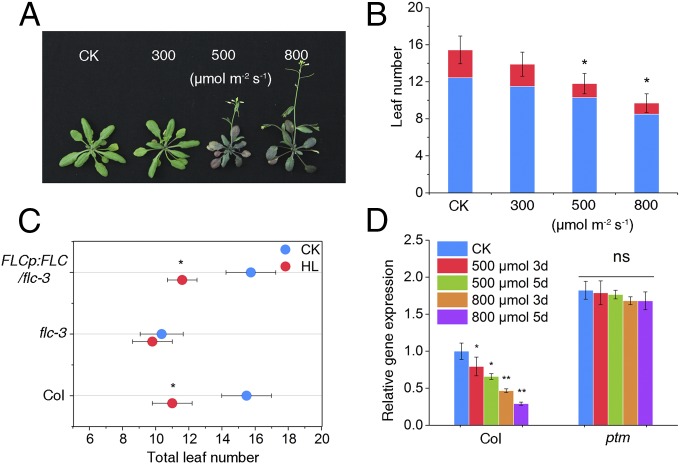
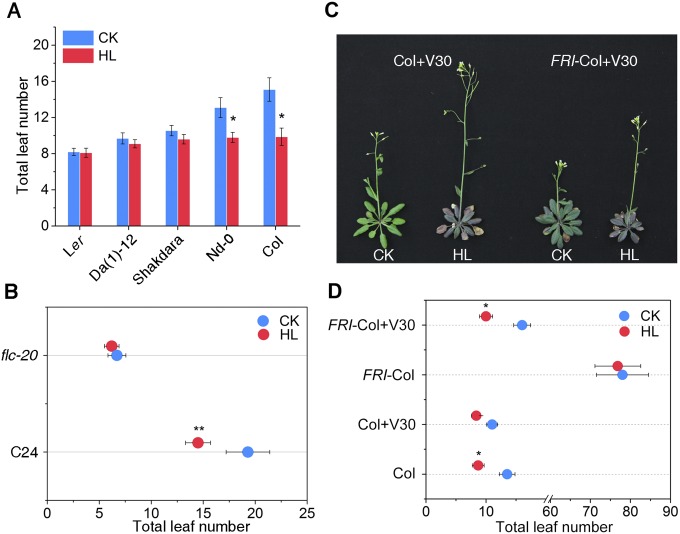
To explore the molecular mode of high light action on flowering, we examined the flowering time of 57 wild accessions of A. thaliana globally distributed in specific geographic locations at different light intensities (normal light, 100 µmol m−2 s−1; high light, 800 µmol m−2 s−1) under long-day (LD) conditions. Seedlings were grown for 3 wk under a 16-h light/8-h dark cycle under normal light and subsequently subjected to normal light or high light for 5 d. In most cases, flowering occurred during this 5-d period. Our results show that most accessions flowered earlier on average under 800 µmol m−2 s−1 photons than under 100 µmol m−2 s−1 photons, as measured by total leaf number at bolting (Fig. S1), of which Columbia-0 (Col-0) is a typical genotype with a robust response (Fig. 1 A and B), consistent with the earlier finding of promotion of floral transition by high light (25). Notably, within these accessions, we observed that a subset of isolates, including Landsberg erecta (Ler), Da(1)-12, and Shakdara, which contain nonfunctional alleles of FLC, did not flower earlier under high light (26, 27) (Fig. S2A).
Fig. S1.
Flowering time of 57 wild accessions with different light irradiances under LD conditions. Total leaf numbers of 57 wild accessions of A. thaliana under normal light (100 µmol m−2 s−1) and high light (800 µmol m−2 s−1) conditions. CK, normal light; HL, high light. Data represent mean ± SD; n ≥ 8. Significant P values (Student’s t test) are shown.
Fig. 1.
FLC is required for high light-induced flowering in Arabidopsis. (A) Images of WT plants showing their flowering phenotype under different light irradiances (300, 500, and 800 μmol m−2 s−1). CK represents normal light (100 μmol m−2 s−1). (B) Flowering times of WT plants under different light irradiances assessed by leaf number. Red bars represent cauline leaves, and blue bars represent rosette leaves. Total leaf numbers were counted using at least 16 plants. (C) Flowering times of Col-0, flc-3, and the complemented plants under normal light (100 μmol m−2 s−1) and high light (800 μmol m−2 s−1). CK, normal light; HL, high light. (D) Effects of high light treatment on FLC expression. Plants treated with different light intensities (Left) under LD (16-h light/8-h dark) conditions were used for extraction of total RNA, and mRNA levels of FLC were determined using qRT-PCR. Values shown are mean ± SD; n = 3. The results were statistically treated using Student’s t test. *P < 0.05; **P < 0.01; ns, not significant.
Fig. S2.
Dysfunction of the FLC locus leads to a compromised response to high light-induced flowering. (A) Total leaf numbers in five wild accessions, including Ler, Da(1)-12, Shakdara, Nd-0, and Col-0, under normal light (100 µmol m−2 s−1) and high light (800 µmol m−2 s−1) conditions. (B) Total leaf numbers in C24 and flc-20 plants under normal light (100 µmol m−2 s−1) and high light (800 µmol m−2 s−1) treatments. *P < 0.05. (C) Flowering phenotype of Col and FRI-Col alleles under normal light (100 µmol m−2 s−1) and high light (800 µmol m−2 s−1) conditions after vernalization treatment for 30 d. (D) Total leaf number of Col and FRI-Col alleles under normal light (100 µmol m−2 s−1) and high light (800 µmol m−2 s−1) conditions after vernalization treatment for 30 d. CK means normal light, HL means high light.
This result raised the possibility that the high light-induced flowering response might depend on FLC activity. To address this point, we further analyzed the flowering behavior of flc-3, a loss-of-function mutant of FLC in a Columbia background (11). As expected, the flc-3 mutant did not show any significant difference in flowering time with or without high light treatment, whereas the rescued transgenic lines with the FLC gene driven by its promoter (FLCp:FLC) restored the impaired high light response of flc-3 (Fig. 1C). We obtained similar results using the flc-20 mutant in C24 background (28) (Fig. S2B). Interestingly, we also observed that the FRI-Col allele, which leads to high expression of FLC, had a normal response to high light only after a vernalization treatment of 30 d, which is well known to repress FLC transcription (11) (Fig. S2 C and D). These results suggest that high light-induced flowering requires FLC activity, and led us to investigate whether high light regulates FLC expression to control flowering.
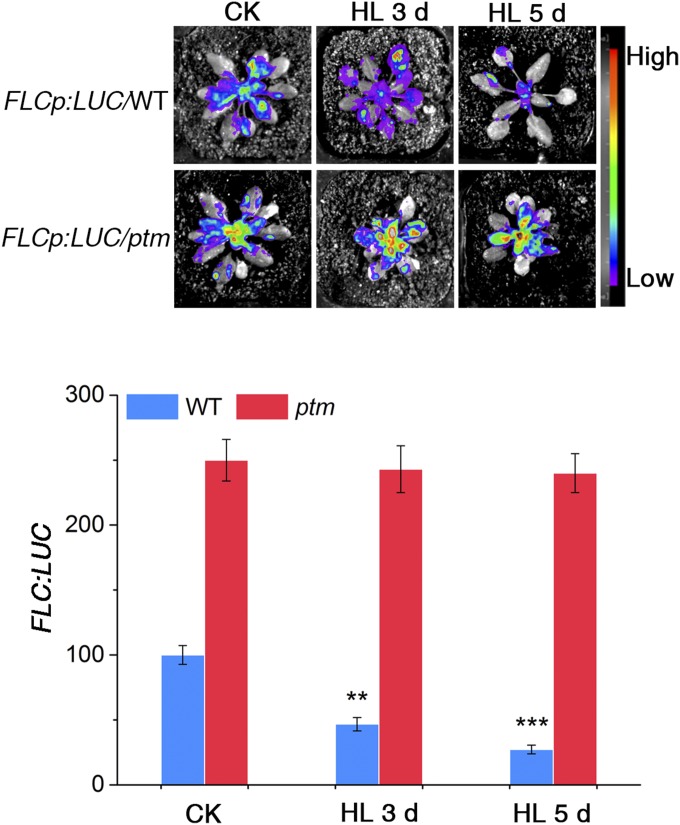
We next examined the level of FLC gene expression on high light treatment and found that compared with plants grown under normal light irradiance, FLC transcript levels were 2.5-fold lower in plants treated with 500 µmol m−2 s−1 photons and 4-fold lower in plants treated with 800 µmol m−2 s−1 photons (Fig. 1D). Consistently, examination of FLC expression patterns in vivo using a transgenic reporter of FLCp:LUC showed that LUC activity was substantially decreased by high light treatment (Fig. S3). These data suggest that high light promotes flowering through transcriptional repression of FLC.
Fig. S3.
Luciferase activity of FLC:LUC transgenic plants under high light treatment. (Upper) Luciferase expression in FLC:LUC transgenic lines in the Col background and ptm background under 800 µmol m−2 s−1 high light for 3 d and 5 d, respectively. (Lower) Corresponding quantification of the luciferase activity shown in the upper panel. Values are mean ± SD; n = 3. The results were statistically treated using Student’s t test. *P < 0.05; **P < 0.01.
High Light Regulates Flowering Through Chloroplast Retrograde Signals.
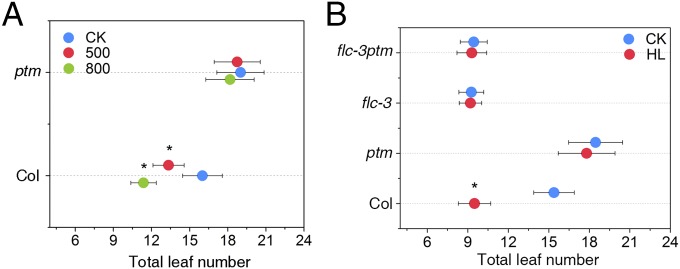
High light is known to perturb the photosynthetic electron transport chain activity, which in turn is known to trigger chloroplast retrograde signaling (29, 30). In addition, our previous study revealed that a chloroplast envelope-bound PHD-type transcription factor with transmembrane domains, PTM, mediates high light-triggered plastid signals to regulate photosynthesis and stress responsive gene expression (31). To test whether PTM-mediated plastid signaling is involved in high light-induced flowering, we examined the flowering behavior of the ptm mutant and observed that high light treatment promotes significantly earlier flowering in wild type (WT) plants but has a minor effect on the ptm mutant (Fig. 2A), suggesting that PTM is critical for high light induction of flowering. In addition, quantitative PCR (qPCR) assays and luciferase imaging data showed that changes in FLC expression under high light treatment are significantly reduced in the ptm mutants compared with WT plants (Fig. 1D and Fig. S3). To test whether PTM and FLC genetically interact to regulate flowering, we introduced the ptm mutant into the flc-3 background and determined the flowering time of the ptmflc-3 double mutant. The ptmflc-3 double mutant flowered as early as the flc-3 single mutant, and exhibited an impaired response to high light-induced flowering (Fig. 2B), suggesting that FLC acts downstream of PTM to regulate flowering. Taken together, these results indicate that plastid signals mediated by PTM participate in high light-accelerated flowering through the repression of FLC.
Fig. 2.
ptm is impaired in high light-regulated flowering. (A) Effects of high light treatment on the flowering time of WT and ptm mutant plants. (B) Flowering times of the indicated genotypes assessed by total leaf numbers under LD conditions. All plants were grown under LD conditions at 100 μmol m−2 s−1 for 3 wk. Total leaf numbers of Col-0, ptm, flc-3, and ptmflc-3 plants under normal light (100 μmol m−2 s−1) and high light (800 μmol m−2 s−1) conditions were determined using at least 16 plants of each line.
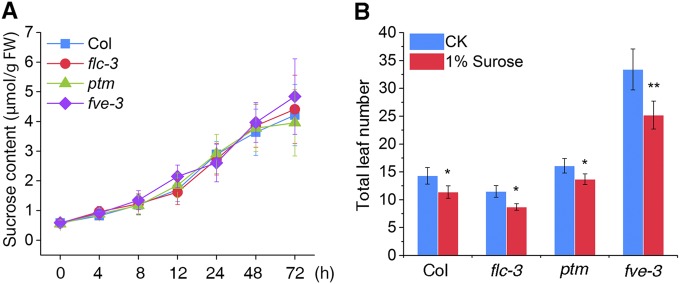
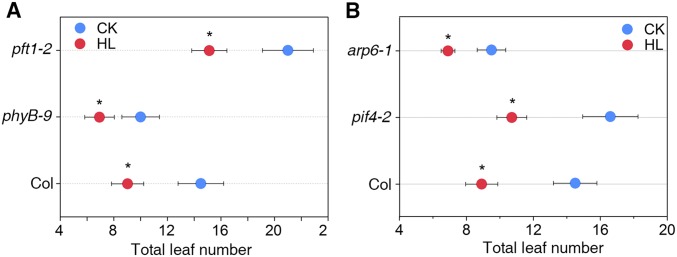
As one of the main photosynthetic products, sugars accumulate under high light conditions and play a key role in the regulation of flowering (32). However, we found no significant difference in sucrose accumulation with high light treatment or in the flowering response to sucrose application between WT and the flc-3 mutant (Fig. S4 A and B). These results suggest that FLC-dependent regulation of flowering by high light cannot be attributed to increased sugar production. To further examine whether thermo induction or light quality alteration is involved, we analyzed the flowering time of mutants deficient in these two flowering pathways (pif4, arp6, and phyB, pft1) in response to high light (22, 33, 34). Unlike flc-3, these mutants all flowered earlier under high light conditions (Fig. S5 A and B), suggesting that high light-regulated flowering is distinct from these two flowering pathways.
Fig. S4.
High light-triggered flowering is not due to sucrose accumulation. (A) Short-term response of leaf sucrose content on high light treatment of WT, flc-3, ptm, and fve-3 mutants. All plants were grown for 2 wk with normal light (100 µmol m−2 s−1) under LD conditions and transferred to high light (800 µmol m−2 s−1) at t = 0. The sucrose content was determined over 72 h. (B) Normal flowering response to 1% sucrose application in the flc-3, ptm, and fve-3 mutants.
Fig. S5.
High light-regulated flowering is distinct from the thermos-induced and light quality-controlled flowering pathways. The phyB and pft1 mutants of the light quality-controlled flowering pathway (A) and the pif4 and arp6 mutants of the thermo-induced flowering pathway (B) all respond well to high light.
PTM Is a Negative Regulator of FLC.
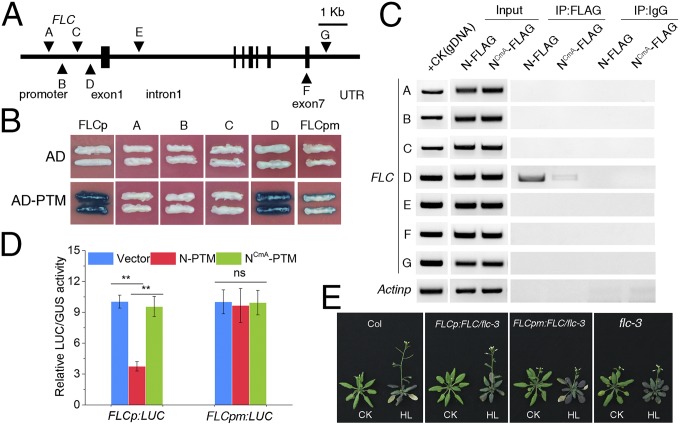
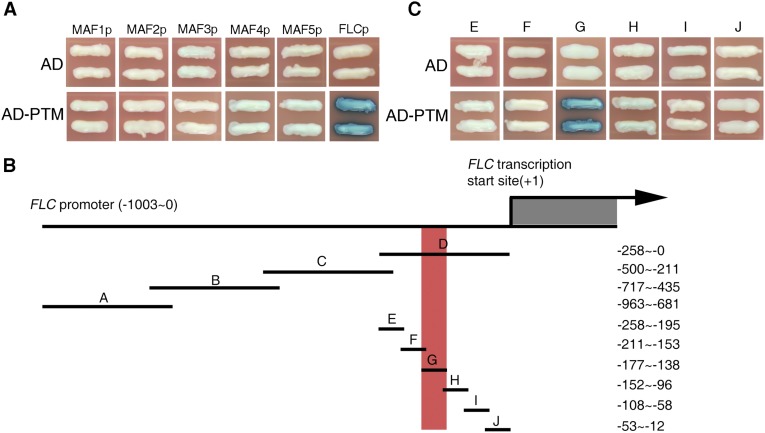
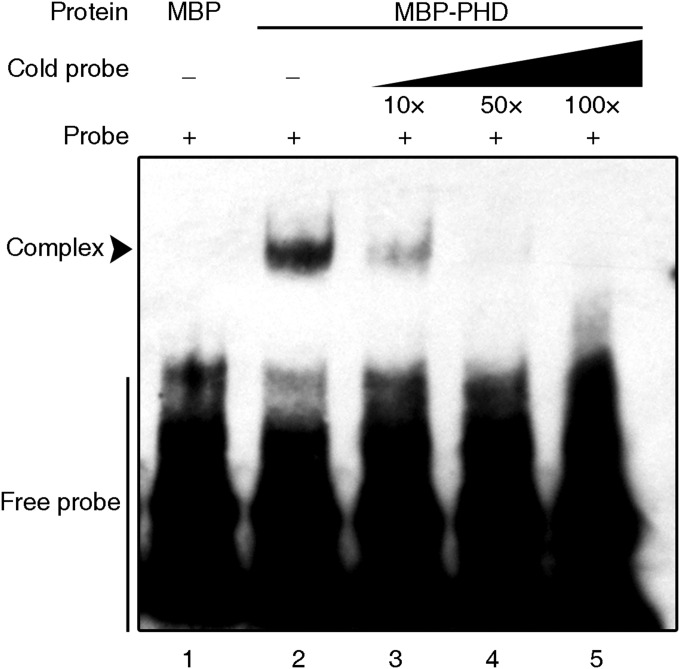
Given that PTM encodes a PHD-type transcription factor that requires a proteolytic cleavage at the N terminus to produce a protein targeted to the nucleus with DNA binding activities (31), we next tested whether PTM is a potential regulator of FLC through direct binding to its promoter. Yeast one-hybrid assays revealed that N-PTM (the N terminus of PTM protein) specifically binds to the proximal region (designated as the D region) of the FLC promoter (Fig. 3 A and B); however, no obvious binding with promoters of other FLC clade members, including MADS AFFECTING FLOWERING (MAF) genes, was observed (Fig. S6A), supporting the binding specificity. We subsequently confirmed this binding in vivo by chromatin immunoprecipitation (ChIP) assays using transgenic plants constitutively expressing FLAG-tagged N-PTM, whereas the mutated form of N-PTM with the change in two key cysteines displayed lower binding activity (Fig. 3C) (31). We further determined the binding site of N-PTM through a deletion analysis with the yeast one-hybrid assay, and found that a sequence of approximately 39 bp near the transcriptional start site is critical for PTM binding (Fig. 3B and Fig. S6 B and C). In agreement with this observation, electrophoretic mobility shift assays (EMSAs) demonstrated that N-PTM binds to the 39-bp probe from the D region of the FLC promoter (Fig. S7).
Fig. 3.
N-PTM binds directly to the FLC promoter and represses its transcription. (A) Schematic representation of the FLC genomic region and positioning of qPCR amplicons for ChIP analysis. Triangles indicate primers for ChIP-qPCR. (B) Yeast one-hybrid assay of N-PTM binding to the proximal region of the FLC promoter. FLCp represents the 1-kb FLC promoter upstream of the transcriptional start site, and FLCpm represents FLC promoter lacking the 39-bp critical region. (C) ChIP assay of N-PTM binding to the FLC gene locus in vivo. Chromatin fragments (∼500 bp) were prepared from 2-wk-old seedlings of 35S:PTM-N-FLAG and 35S:PTM-NCmA -FLAG transgenic plants and immunoprecipitated with anti-FLAG antibody. Precipitated DNA was amplified using specific primers as indicated in A. The ACTIN12 promoter served as a negative control. (D) N-PTM represses FLC gene transcription in transient luciferase reporter assays. The relative luciferase activity was normalized to the GUS activity and shown in LUC/GUS. Error bars represent SD. (E) Effect of the 39-bp critical region on the flowering phenotype under high light conditions. Plants transformed with FLCp:FLC and FLCpm:FLC in the flc-3 background were grown at 100 μmol m−2 s−1 under LD conditions for 2 wk and then exposed to 800 μmol m−2 s−1 high light.
Fig. S6.
Yeast one-hybrid assay showing specific binding of N-PTM to the critical region of the FLC gene. (A) N-PTM binds to the FLC promoter but not to the promoters of other FLC clade member genes (MAF1, MAF2, MAF3, MAF4, and MAF5). (B) Map of FLC promoter deletions used for the yeast one-hybrid assays. Lines indicate promoters, and regions of interest are indicated by nucleotide number relative to the transcription initiation site. The critical region for N-PTM binding is highlighted in red. (C) A critical region located in the FLC promoter proximal to the transcription start site is essential for N-PTM binding.
Fig. S7.
N-PTM binds to the 39-bp region of the FLC promoter. EMSA shows that MBP-N-PTM, but not MBP alone, binds to a 39-bp sequence of the FLC promoter. Unlabeled WT oligoduplexes with 10-fold, 50-fold, and 100-fold excess were used for competition to confirm the specific interaction between N-PTM and the 39-bp region identified by the yeast one-hybrid assay.
We next carried out a transient transcription experiment in Arabidopsis plants using a dual luciferase assay to directly test the role of N-PTM in FLC expression (35). The expression level of luciferase driven by the FLC promoter was reduced by approximately threefold relative to that of the control when N-PTM was overexpressed, but not with the mutated form of N-PTM; however, this decrease was significantly abolished when we used the FLC promoter lacking the 39-bp critical region to drive luciferase expression (Fig. 3D). These data indicate that PTM acts as a repressor of FLC expression through binding to the critical region.
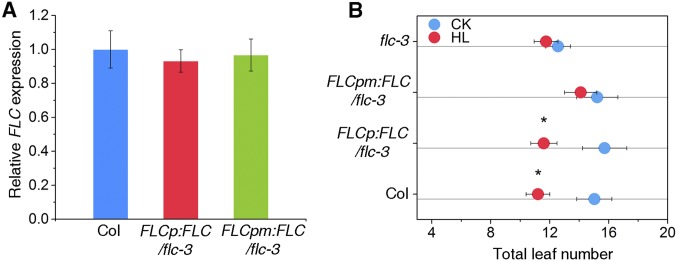
To evaluate the biological function of this critical region in vivo, we generated transgenic lines with an flc-3 background carrying an FLC genomic sequence driven by the full-length and mutated forms of the FLC promoter: FLCp:FLC and FLCpm:FLC, respectively. Similar levels of FLC transcript were detected in both transgenic plants compared with WT plants (Fig. S8A). Analysis of flowering time in response to high light showed that expression of FLC under control of the full-length promoter complemented the insensitive response of the flc-3 mutant. In contrast, this rescue was strikingly reduced when the promoter was replaced with its mutated counterpart (Fig. 3E and Fig. S8B), indicating that the critical region by which N-PTM binds to FLC is crucial for high light-induced flowering. Taken together, these data lead us to conclude that PTM directly binds the FLC promoter in a critical region and represses FLC expression.
Fig. S8.
Transcript level of FLC and flowering time in Col, FLCp:FLC, and FLCpm:FLC plants. (A) RNA was extracted from 3-wk-old plants of each genotypes, and FLC gene expression was determined by qPCR analysis using PP2A as the internal control. Values shown are mean ± SD; n = 3. (B) Flowering time of the genotypes shown in A assessed by total leaf number on high light treatment.
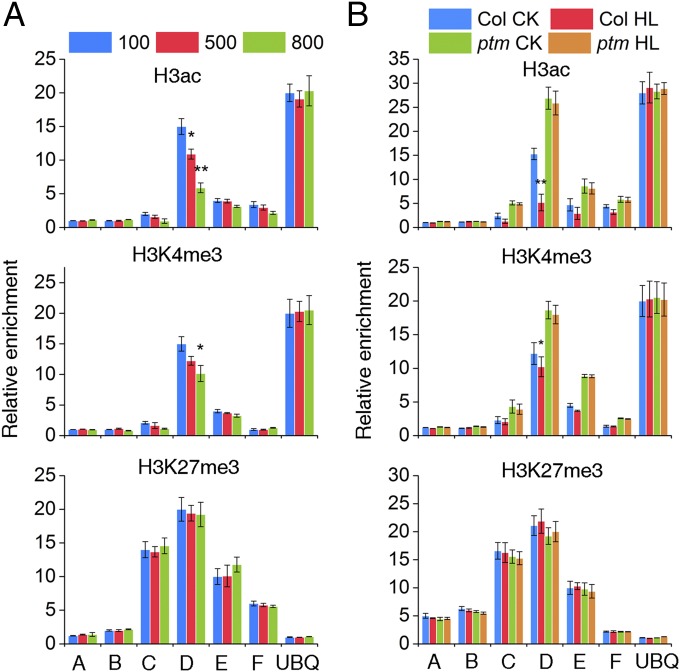
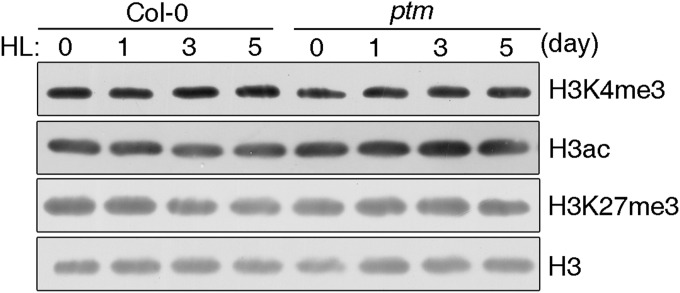
The PHD-type transcription factors, like PTM, are extensively involved in gene regulation in association with histone modifications (31, 36), whereas FLC expression is subject to multiple epigenetic regulations in response to various endogenous and environmental cues (37). Therefore, we tested whether PTM represses FLC transcription through an epigenetic-related mechanism. ChIP assays using antibodies against specifically modified histone3 forms showed that the levels of two active histone marks on FLC chromatin, H3ac and H3K4me3, were decreased by high light treatment. In contrast, the level of the repressive mark H3K27me3 was almost unchanged (Fig. 4A) (38). Moreover, the H3ac and H3K4me3 levels in response to high light treatment were barely decreased in the ptm mutant, suggesting the involvement of PTM in this process (Fig. 4B). No obvious global changes in the levels of H3ac, H3K4me3, and H3K27me3 were detected in WT and ptm plants under high light treatment (Fig. S9), suggesting that PTM is targeted solely to a subset of unique genes in response to high light. Taken together, these results indicate that high light contributes to FLC silencing through modulation of H3ac and H3K4me3 levels on FLC chromatin in a PTM-dependent manner.
Fig. 4.
Regulation of FLC by high light at the chromatin level. Shown are relative levels of histone modifications at the FLC locus under different light treatments. WT and ptm plants grown in soil for 2 wk and treated with high light (500 and 800 μmol m−2 s−1) were used for chromatin preparation. ChIP assays were performed using anti-H3ac, anti-H3K4, and anti-H3K27 trimethylation antibodies. *P < 0.05; **P < 0.01. The three graphs in A show the effect of high light on the histone modification markers in WT, whereas B represents the changes compromised in the ptm mutant.
Fig. S9.
High light treatment does not influence total histone modification level in both WT and ptm plants. Histone-enriched protein extracts from 3-wk-old Col-0 and ptm plants grown under 800 µmol m−2 s−1 irradiance for the indicated times were probed with anti-H3 acetylated, anti-H3K4 trimethylated, and anti-H3K27 trimethylated antibodies. Unmodified H3 protein served as a loading control.
PTM-Mediated Repression of FLC Requires the Chromatin Remodeler FVE.
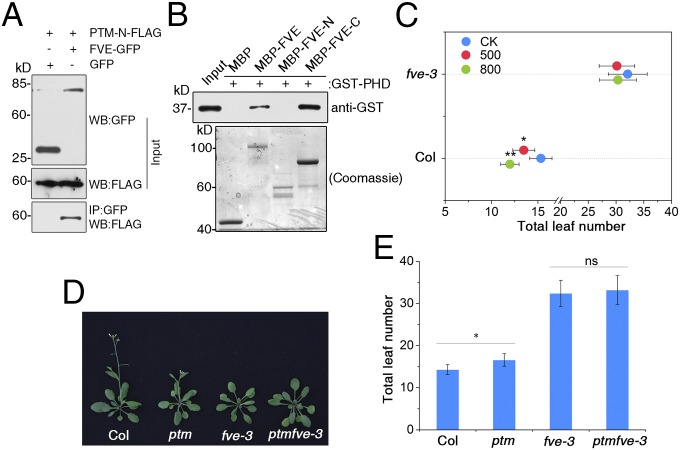
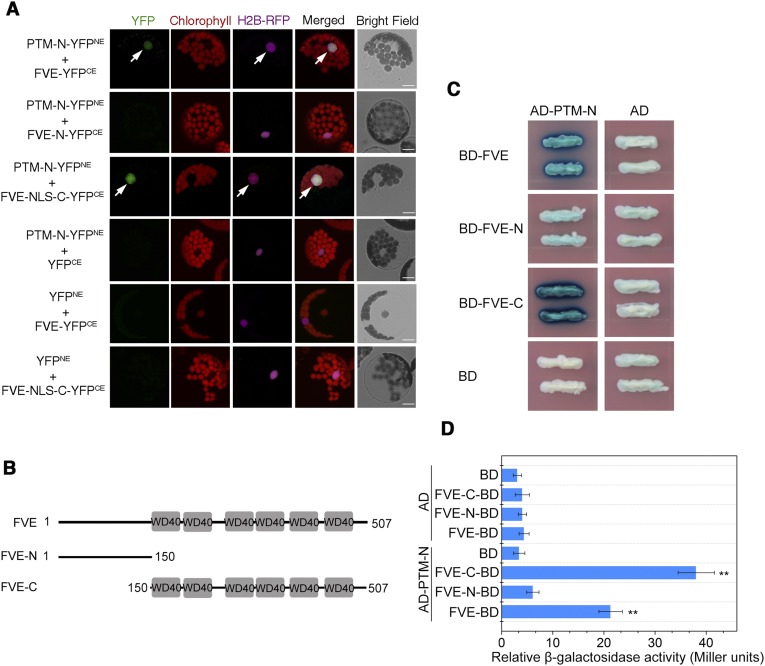
It is generally accepted that functioning of the PHD-type transcription factors in histone modifications requires specific binding of chromatin remodelers (36, 39). To explore the molecular mechanisms underlying PTM functions in FLC repression, we screened for PTM-interacting partners with yeast two-hybrid assays using the N-terminal fragment of PTM as bait. This screen identified FVE as a PTM-interacting factor. FVE, a putative retinoblastoma-associated protein, has been shown to contribute to flowering promotion via repression of FLC (40, 41). Coimmunoprecipitation (co-IP) and bimolecular fluorescence complementation (BiFC) assays confirmed the physical interaction between FVE and N-PTM in the nucleus (Fig. 5A and Fig. S10A). Sequence analysis showed that the FVE protein harbors a series of WD40 domains at the C terminus that are known to mediate protein–protein interactions (40). Domain deletion analysis showed that the C terminus of FVE is required for its interaction with N-PTM (Fig. 5B and Fig. S10).
Fig. 5.
N-PTM interacts with FVE in the nucleus. (A) Co-IP assay in tobacco showing the interaction between N-PTM and FVE. (B) FVE interacts directly with N-PTM in a pull-down assay in vitro. (C) Flowering time of Col-0 and fve-3 mutant under different light irradiances (100, 500, and 800 μmol m−2 s−1). (D) Images of Col-0, ptm, fve-3, and fve-3ptm mutants showing their flowering phenotypes under LD conditions. (E) Flowering times of indicated genotypes assessed by total leaf number. The total leaf number of each genotype was recorded using at least 16 plants and statistically treated using Student’s t test. *P < 0.05; ns, not significant.
Fig. S10.
Interaction between FVE and N-PTM in the BiFC and yeast two-hybrid assays. (A) BiFC assay for the interaction of FVE with N-PTM in the nucleus. Different constructs of FVE and N-PTM with the N or C terminus of YFP were cotransformed into Arabidopsis protoplasts. Images were visualized and obtained using confocal microscopy at 16 h after transformation. The position of the nucleus is indicated by H2B-RFP. (Scale bar: 20 µm.) NLS, nuclear localization sequence. (B) Domain deletion constructs of FVE protein. Amino acid residues are indicated by numbers, and gray boxes represent WD40 domains. (C) Liquid LexA yeast two-hybrid assay showing that N-PTM interacts with FVE. (D) Quantification of β-gal activity in yeast cells harboring different combinations corresponding to B. Error bars indicate SD.
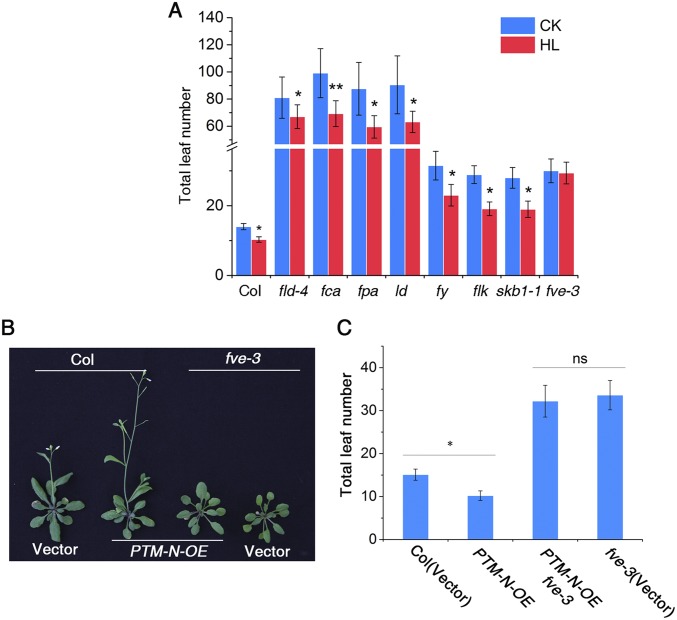
This physical interaction led us to further examine whether FVE is involved in the high light-triggered early flowering response. Indeed, similar to the ptm mutant, the fve-3 null allele did not flower earlier when treated with high light, whereas other autonomous pathway mutants, including fld-4, fca-9, fpa, ld, fy, flk, and skb1-1, showed earlier flowering similar to WT plants (Fig. 5C and Fig. S11A) (42, 43), suggesting that FVE is specifically involved in this process. However, the ptmfve-3 double mutant flowered later than the ptm mutant, but did not show any additive effects compared with the fve-3 mutant (Fig. 5 D and E). Furthermore, constitutive expression of N-PTM induced early flowering in WT plants, but not in the fve-3 mutants (Fig. S11 B and C), supporting the view that PTM might regulate flowering with a dependence on FVE.
Fig. S11.
FVE is specifically involved in high light-promoted flowering by interacting with PTM. (A) Total leaf numbers in mutants deficient in the autonomous pathway (fld, fca, fpa, ld, fy, flk, skb, and fve) under normal light (100 µmol m−2 s−1) and high light (800 µmol m−2 s−1) conditions. (B) Flowering phenotype of N-PTM–overexpressing lines in the Col-0 and fve-3 background. All of the plants were planted under LD conditions with 100 µmol m−2 s−1 light for 4 wk. (C) Leaf numbers in representative lines shown in B. *P < 0.05.
High Light Increases the Level of PTM-FVE Complex to Modulate FLC Expression.
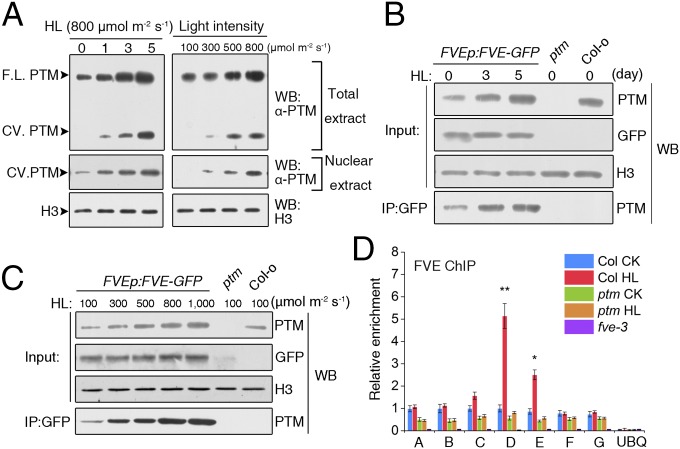
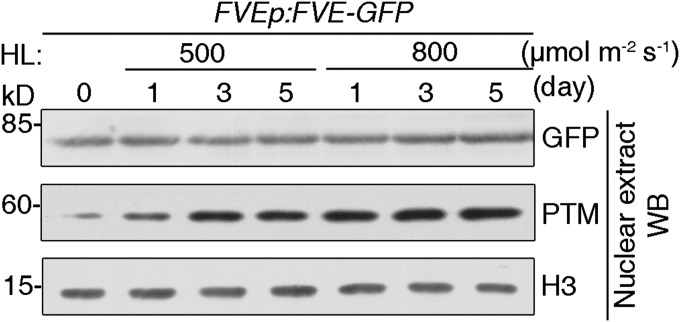
PTM undergoes proteolytic cleavage on chloroplast retrograde signaling, and the processed ∼58-kDa N-terminal fragment accumulates in the nucleus after high light treatment (Fig. 6A) (31). This cleavage also occurs when plants are treated with increased light intensities. In contrast to the increased nuclear accumulation of N-PTM, FVE protein levels were not significantly altered on high light treatment (Fig. S12). The interaction between PTM and FVE, as well as the repressive effect on FLC, prompted us to investigate whether high light represses FLC expression by regulating formation of the N-PTM–FVE complex. Therefore, we examined the level of this repressor complex in response to high light by co-IP assays using transgenic plants expressing FVEp:FVE-GFP. Indeed, FVE-GFP immunoprecipitated a greater amount of N-PTM protein in a time course experiment with high light treatment (Fig. 6B). Furthermore, we confirmed the induced level of this interacting complex during the treatment with increased light irradiance (Fig. 6C).
Fig. 6.
High light regulates the accumulation of N-PTM in the nucleus and its interaction with FVE. (A) High light treatment accelerates the processing of full-length PTM protein and promotes PTM accumulation in the nucleus. Total protein and nuclear proteins were extracted separately from WT plants treated with high light (800 μmol m−2 s−1) (Left) and different light irradiances (Right) and used for immunobloting with a specific PTM antibody. Histone3 protein was loaded as a control. FL, full-length; CV, cleaved; WB, immunoblot. (B) Effect of high light treatment on the level of the N-PTM–FVE complex. Nuclear proteins were extracted from FVEp:FVE-GFP transgenic plants treated with 800 μmol m−2 s−1 high light during a time course and immunoprecipitated with anti-GFP antibody. IP, immunoprecipitation; WB, immunoblot. (C) Effect of different light irradiances on the level of the N-PTMFVE complex. (D) ChIP analysis of FVE binding to the FLC locus using an FVE-specific antibody under high light treatment. Here 3-wk-old Col-0, ptm, and fve-3 plants were used for chromatin extraction, and the immunoprecipitated DNA fragments were amplified using specific primers. UBIQUITIN10 promoter primers served as a negative control.
Fig. S12.
High light treatment does not affect the FVE protein level. The transgenic line carrying FVEp:FVE:GFP was treated with different light irradiances for 1, 3, and 5 d, and nuclear proteins were extracted and used for immunoblot assays using antibodies specific to GFP and PTM. H3 protein served as a loading control.
To investigate whether PTM-mediated repression of FLC is due to the induced binding of the N-PTM–FVE repressor complex to its chromatin, we performed a ChIP assay on high light treatment using an antibody against FVE. Increased light irradiance specifically enhanced the binding of FVE to the proximal region of the FLC promoter by approximately twofold to threefold, but no binding was detected to other regions or to the promoter of POLYUBIQUITIN10 (UBQ10) (Fig. 6D); however, the increased abundance of FVE on the FLC proximal promoter was significantly compromised in the ptm mutant compared with WT (Fig. 6D), indicating that enrichment of FVE on FLC chromatin under high light relies on PTM. Taken together, our results suggest that high light silences FLC expression by regulating binding of the N-PTM–FVE complex to its chromatin.
Discussion
A prime challenge in plant biology is to understand the molecular mechanisms of how organelles perceive environmental cues to coordinate plant growth, development, and local adaptation once they have become fully integrated into the life cycle of the host eukaryotic cell after endosymbiosis (44). The onset of flowering, which determines the reproductive success of plants, is crucial for the viability, fecundity, and species persistence of angiosperms in the face of different natural environments. For this reason, this developmental transition is closely linked to crop yield and current agricultural productivity, and thus is of great importance both ecologically and economically (2, 4). Here we report that chloroplast retrograde signals triggered by high light regulate floral transition in Arabidopsis through FLC gene repression (Fig. S13).
Fig. S13.
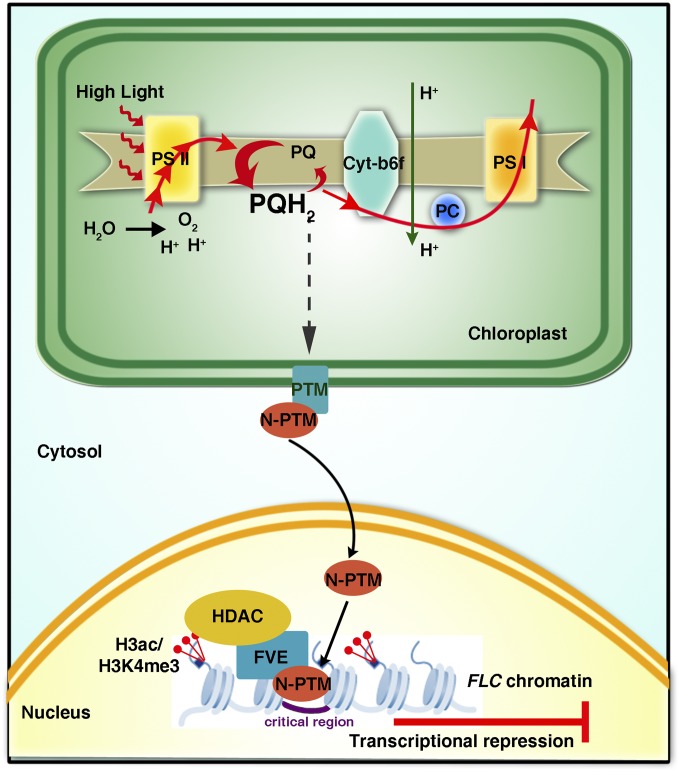
A working model for the mechanism of PTM-mediated plastid signals in flowering regulation. High light enhances electron flow (indicated by red arrows) through PSII and perturbs the operation of photosynthetic electron transport, which triggers the processing of PTM on the outer chloroplast envelope through retrograde signaling and the consequent release of N-PTM, the processed form of PTM, to the nucleus. By directly interacting with FVE, the N-PTM recruits FVE and its associated HDAC complex to the promoter region of FLC, which subsequently decreases the levels of H3K4me3 and H3ac on FLC chromatin and results in silencing of the FLC gene, thereby promoting early flowering under high light.
As a potent repressor of the flowering pathway, FLC has been demonstrated to play a central role in integrating multiple endogenous and exogenous signals, and its expression is under complex control (37, 45). Numerous investigations have elucidated the molecular mechanisms governing the regulation of FLC, which involves multiple epigenetic modifications and noncoding RNA, thus providing a paradigm for chromatin-based control of other developmental genes (46). Vernalization, a prolonged period of cold exposure, represses FLC expression. This process involves recruitment of the Polycomb Repression Complex 2 (PRC2), which deposits H3K27me3 in the region around the first intron of FLC (13). Recent studies revealed that two different lncRNAs, COOLAIR and COLDAIR, are involved in this process (47, 48), making the mechanism of FLC regulation more complicated. FLC repression also can be achieved by the autonomous pathway members through chromatin remodeling and RNA processing, in which FLD and FVE act on H3K4me and H3ac modifications, respectively (40, 49).
Here we have provided evidence indicating that FLC is also involved in flowering regulation in response to high light irradiance and the resulting plastid signaling, which highlights the contribution of FLC in spatial and temporal adaptive responses. To ensure a timely reproductive transition in face of stresses that interfere with photosynthesis, higher plants are likely to direct the plastid information flow to the nuclear-encoded flowering network governed by FLC and initiate floral-related transcriptional reprogramming at the shoot apex. Interestingly, we observed that accessions carrying dominant FRI alleles also showed a compromised response similar to that of the flc null mutant; however, vernalization treatment for 30 d could restore the WT response to high light (Fig. S2C and D). Previous studies have identified FRI as a potent activator of FLC, and vernalization promotes flowering through repression of FLC, which involves the disassociation of FRI from FLC chromatin (50, 51). Temporal regulation of FLC gene expression likely is conferred by differential binding of various complexes at different stages of plant development.
We also have demonstrated that plastid signals are recruited by the chromatin remodeling machinery operating on the FLC gene and dedicated to this beneficial flowering. This is corroborated by our observation that FLC transcription is substantially repressed in response to high light treatment (Fig. 1D), with a concomitant decline in histone modifications that include H3K4me3 and H3ac on FLC chromatin (Fig. 4A). In addition, we found that a 39-bp region within the FLC promoter is critical for the induction of flowering by chloroplast retrograde signals (Fig. 3E and Fig. S8B), suggesting that the FLC promoter also contributes to its epigenetic regulation in addition to the first intron and noncoding RNA (14, 45). Thus, our study supports the idea that specific nucleotide sequence signatures in different parts of FLC may be recognized by distinct genetic mechanisms to facilitate a flexible evolutionary response to diverse environmental factors (52, 53).
PTM, a key component of the retrograde signaling pathway, is required for such flowering regulation by perceiving and mediating chloroplast retrograde signals through proteolysis, and by acting upstream of FLC to modulate its expression. Cleavage of PTM full-length protein in the chloroplast outer envelope membrane gives rise to N-PTM, which represses FLC through the erasure of two active histone marks. FVE, a putative retinoblastoma-associated protein, was further identified as a potential interacting partner of N-PTM that facilitates modification of the FLC chromatin status by PTM. Moreover, the interaction between N-PTM and FVE, which responds to light irradiance and plastid signals (Fig. 6 B and C) may build up a platform for FLC regulation at the chromatin level and provides a route for integration of chloroplast status into the histone code. An earlier study demonstrated that FVE plays dual roles in flowering regulation and cold acclimation to provide evolutionary fitness to plants in sensing intermittent cold stress (41). In addition, FVE is also implicated in the photoperiod flowering pathway and is postulated to bind chromatin as a large protein complex of ∼1.0 MDa (54, 55). Thus, it is likely that these versatile functions of FVE in environment-controlled flowering are achieved through specific interactions with distinct partners like HOS1 and CUL4-DDB1 (54, 56). Collectively, our findings suggest that PTM functions not only as a messenger between chloroplast and nucleus, but also as a multifaceted adaptor to recruit specific partners to trigger diverse transcriptional reprogramming events.
After the endosymbiotic engulfment, chloroplasts not only have significantly contributed to the genomic resources of the eukaryotic host cell, but also have evolved to function as environmental sensors to coordinate plant growth, development, and adaptive stress responses (44, 57). This coordination is orchestrated by the interactive exchange of information between the nucleus and organelles, in which retrograde signals are relayed from chloroplasts to inform the nucleus of their metabolic and functional state (58). When plants encounter environmental stresses that perturb photosynthetic functions like high light, adjustments in light-harvesting complex II (LHCII) phosphorylation and antenna size are needed to maintain the redox poise of the PQ pool and the excitation balance between PSII and PSI, further leading to the overall metabolic remodeling of chloroplasts. Chloroplast retrograde signals are subsequently triggered by these changes, ranging from plastid redox status to the levels of various metabolites to coordinate proper expression of nuclear genes involved in photosynthesis fine-tuning and stress response (29, 58). In this view, our results support a more dynamic function of chloroplasts as stress sensors that transmit interorgannellar retrograde signals to prime the floral machinery by eliciting the expression of flowering-related genes, thereby promoting higher plants to complete the reproductive transition under high light stress.
In conclusion, our study reveals a previously unreported cellular response to high light stress that modulates the timing of reproduction, and provides insight into how chloroplasts emerged as key players in plant growth and development after their integration into their host cells through endosymbiosis. Such signaling mechanisms may enable higher plants to more effectively adapt to the ever-changing environment and mitigate detrimental effects to fitness.
Materials and Methods
Plant Materials.
A. thaliana plants were grown on soil or Murashige and Skoog (MS) plates with 2% sucrose (wt/vol) in a controlled culture room under LD conditions (16-h light/8-h dark) at 22 °C. The flc-3, ptm, and fve-3 mutants were in a Columbia background. Transgenic plants were generated through Agrobacterium tumefaciens-mediated transformation by the floral dip method. Seeds from transgenic plants were selected on MS medium supplemented with 20 mg/L hygromycin.
Analysis of Gene Transcript Levels.
For real-time qPCR, total RNA was isolated using the Qiagen RNeasy Mini Kit according to the manufacturer’s instructions. RNA was treated with DnaseI at 37 °C for 30 min and used for cDNA synthesis. qPCR was performed using 2× SYBR Green Supermix on a Roche LightCycler 480 system. Each sample was quantified in triplicate, and the relative transcript level of each gene was determined by normalization of the expression level vs. that of PP2A (AT1G13320). The primers used in gene expression analysis are listed in Table S1.
Table S1.
Primers used in this study
| Name | Sequence (5’-3’) | Use |
| FLC-QRT-F | GCCAAGAAGACCGAACTCATGTTGA | qRT-PCR |
| FLC-QRT-R | CAACCGCCGATTTAAGGTGGCTA | qRT-PCR |
| FT-QRT-F | AAAACAAGTAAAACAGAAACAATC | qRT-PCR |
| FT-QRT-R | GCCATAAGTAACCTTTAGAGTG | qRT-PCR |
| SOC1-QRT-F | ATTCGCCAGCTCCAATATGC | qRT-PCR |
| SOC1-QRT-R | TGAGCTGCTCAATTTGTTCC | qRT-PCR |
| PP2A- QRT-F | TGTGGCAACATGGCTGCGATTCTA | qRT-PCR |
| PP2A- QRT-R | TGACGTGGAGCTGGATCAAACTGA | qRT-PCR |
| FLC-ChIP-A-F | GGCATTAGTATCGTTTATTGTGT | ChIP |
| FLC-ChIP-A-R | TATGGCAATAGCTCAAAGTT | ChIP |
| FLC-ChIP-B-F | TACAAGCAAAAAAGAATTAG | ChIP |
| FLC-ChIP-B-R | CGACTTCTCAAAACTTAAAA | ChIP |
| FLC-ChIP-C-F | CTATGTAGGCACGACTTTGG | ChIP |
| FLC-ChIP-C-R | GGCGGTGTTTTGAAGACAAGATTG | ChIP |
| FLC-ChIP-D-F | GTACACGTGGCAATCTTGTC | ChIP |
| FLC-ChIP-D-R | CTTCTCTCCGAGAGGGCTTT | ChIP |
| FLC-ChIP-E-F | TTCATTATAGATCCGTACCAAAGAGG | ChIP |
| FLC-ChIP-E-R | ATAGATTTGCCTCATATTTATGTGAT | ChIP |
| FLC-ChIP-F-F | TTTGCTGAGAACAACCGTGCTGC | ChIP |
| FLC-ChIP-F-R | TACCGATCAAGTTTCTAAACCTAAC | ChIP |
| FLC-ChIP-G-F | TTGCAAAATAAGCCGTAGGCTTCTTC | ChIP |
| FLC-ChIP-G-R | CGCTGATAAGGGCGAGCGTTTGTATA | ChIP |
| ACTIN-ChIP-F | TACTCGTTTCGCTTTCCTTAG | ChIP |
| ACTIN-ChIP-R | GAATCACATAACAAGCAACCC | ChIP |
| FLC-ChIPq-A-F | CGTGAGTCCGCCCCTGATAGC | ChIP-qPCR |
| FLC-ChIPq-A-R | GGACCAAACCAAACCTACAAAGACTT | ChIP-qPCR |
| FLC-ChIPq-B-F | TTGCATCACTCTCGTTTACCCCC | ChIP-qPCR |
| FLC-ChIPq-B-R | TATTTCTTTCTATTTTTTGTGCC | ChIP-qPCR |
| FLC-ChIPq-C-F | CTTAGTATCTCCGGCGACTTGAACC | ChIP-qPCR |
| FLC-ChIPq-C-R | GCGTCACAGAGAACAGAAAGCTGA | ChIP-qPCR |
| FLC-ChIPq-D-F | ATGACTTTGTTCCTATTCGTTAAAATT | ChIP-qPCR |
| FLC-ChIPq-D-R | GACAAGTGTTGTGGGATTTTCAATTTC | ChIP-qPCR |
| FLC-ChIPq-E-F | CTGCTTTTGTTTGTTGCAGACCGAAC | ChIP-qPCR |
| FLC-ChIPq-E-R | CCGATCAAGTTTCTAAACCTAACAACT | ChIP-qPCR |
| FLC-ChIPq-F-F | CTCTCGTCGTAATTAATTTGTTTT | ChIP-qPCR |
| FLC-ChIPq-F-R | TACGGAAGTGAATTTAGTCCAAAG | ChIP-qPCR |
| FLC-ChIPq-G-F | CCACCTTAAATCGGCGGT | ChIP-qPCR |
| FLC-ChIPq-G-R | CTCACACGAATAAGGTAC | ChIP-qPCR |
| UBQ10- ChIPq-F | AGGTGGAAAGCTCCGACACCATCG | ChIP-qPCR |
| UBQ10- ChIPq-R | AGCTGCTTGCCGGCGAAAATAAGCC | ChIP-qPCR |
| PTM-N-JG-F | GAATTCATGGAAGCGAAGGTTCCTAG | Y1H |
| PTM-N-JG-R | CTCGAGTCAGAAGAGTCGCCCATGTG | Y1H |
| FLC-pLaczi-F | GAATTCAGTATCGTTTATTGTGTTACC | Y1H |
| FLC-pLaczi-R | CTCGAGGGCTTCTCTCCGAGAGGGC | Y1H |
| MAF1-pLaczi-F | GAGTCTTTTTGCCCCAAATAAT | Y1H |
| MAF1-pLaczi-R | AATCTCCGGAGACGCTCAATGC | Y1H |
| MAF2-pLaczi-F | TAATAAAAATATGTAGAATGAA | Y1H |
| MAF2-pLaczi-R | CAAGTCAGTTTGTTTTTGTTTT | Y1H |
| MAF3-pLaczi-F | CATAGAGCTTCTTAATTCTTTT | Y1H |
| MAF3-pLaczi-R | TGGGCTAGACAAATGAAAAAAA | Y1H |
| MAF4-pLaczi-F | ATTGTAAAACTAAGATAAAGCT | Y1H |
| MAF4-pLaczi-R | ACTGAACGTTTTTTTTGTGTCT | Y1H |
| MAF5-pLaczi-F | CAGTTTTCCTATATATATATAT | Y1H |
| MAF5-pLaczi-R | AAAAATATCAATGAACATATTT | Y1H |
| FLC-pLaczi-A-F | GAATTCTTAGTATCGTTTATTGTGT | Y1H |
| FLC-pLaczi-A-R | CTCGAGGCAATAGCTCAAAGTTACT | Y1H |
| FLC-pLaczi-B-F | GAATTCTACAAGCAAAAAAGAATTAG | Y1H |
| FLC-pLaczi-B-R | CTCGAGCGACTTCTCAAAACTTAAAA | Y1H |
| FLC-pLaczi-C-F | GAATTCCTATGTAGGCACGACTTTGG | Y1H |
| FLC-pLaczi-C-R | CTCGAGATGTGAATAAAAACGTTGTG | Y1H |
| FLC-pLaczi-D-F | GAATTCGTACACGTGGCAATCTTGTC | Y1H |
| FLC-pLaczi-D-R | CTCGAGCTTCTCTCCGAGAGGGCTTT | Y1H |
| FLC-pLaczi-E-F | GAGAAAAGGAAAAAAAAAAATAGAAAGAGAAAACGCTTAGTATCTCCGGC | Y1H |
| FLC-pLaczi-E-R | GCCGGAGATACTAAGCGTTTTCTCTTTCTATTTTTTTTTTTCCTTTTCTC | Y1H |
| FLC-pLaczi-F-F | AAAAAAAAAAAAATATCTGGCCCGACGAAGAAAAAGTAG | Y1H |
| FLC-pLaczi-F-R | CTACTTTTTCTTCGTCGGGCCAGATATTTTTTTTTTTTT | Y1H |
| FLC-pLaczi-G-F | ATTTGGTTTTTTTGCATCACTCTCGTTTACCCCCAAAAAAAAAAAAATATCTGGCCCGA | Y1H |
| FLC-pLaczi-G-R | TCGGGCCAGATATTTTTTTTTTTTTGGGGGTAAACGAGAGTGATGCAAAAAAACCAAAT | Y1H |
| FLC-pLaczi-H-F | AATTATTTGGTTTTTTTGCATCACTCTCGTTTACCCCCAAAAAAAAAAAAATATCTGGCCCGA | Y1H |
| FLC-pLaczi-H-R | TAAACCAAAAAAACGTAGTGAGAGCAAATGGGGGTTTTTTTTTTTTTATAGACCGGGCTAGCT | Y1H |
| FLC-pLaczi-I-F | CGAAGAAAAAGTAGATAGGCACAAAAAATAGAAAGAAATAAAGCGAGAAAAGGAAA | Y1H |
| FLC-pLaczi-I-R | TTTCCTTTTCTCGCTTTATTTCTTTCTATTTTTTGTGCCTATCTACTTTTTCTTCG | Y1H |
| FLC-pLaczi-J-F | AATTTCTTGTCTTCAAAACACAACGTTTTTATTCACATATTTGGTTTTTTTGC | Y1H |
| FLC-pLaczi-J-R | TCGAGCAAAAAAACCAAATATGTGAATAAAAACGTTGTGTTTTGAAGACAAGA | Y1H |
| PTM-N-AD-F | GAATTCATGGAAGCGAAGGTTCCTAGACC | Y2H |
| PTM-N-AD-R | CTCGAGTCAGAAGAGTCGCCCATGTGG | Y2H |
| FVE-BD-F | GGATCCGTATGGAGAGCGACGAAGCAGCAG | Y2H |
| FVE-BD-R | CTCGAGTCAAGGCTTGGAGGCACAAGTC | Y2H |
| FVE-N-BD-F | GGATCCATGGAGAGCGACGAAGCAGCAG | Y2H |
| FVE-N-BD-R | CTCGAGCGGTCTTGTACTTCTTCACAAAT | Y2H |
| FVE-C-BD-F | GGATCCATGATCATTCACCCTGGAGAG | Y2H |
| FVE-C-BD-R | CTCGAGCAGGCTTGGAGGCACAAGTC | Y2H |
| PTM-N-pSN1301-F | GGTACCATGGAAGCGAAGGTTCCTAGACCT | Co-IP |
| PTM-N-pSN1301-R | GTCGACCCTCAAGGAGATACCTTCAGGAAG | Co-IP |
| FVE-p2300GFP-F | GGATCCATGGAGAGCGACGAAGCAGCAG | Co-IP |
| FVE-p2300GFP-R | ACTAGTAGGCTTGGAGGCACAAGTC | Co-IP |
| PTM-N-pGEX5x-1-F | GAATTCATGGAAGCGAAGGTTCCTAG | Pull-down |
| PTM-N-pGEX5x-1-R | CTCGAGGAAGAGTCGCCCATGTGG | Pull-down |
| FVE-pMALc5X-1-F | GGATCCGTATGGAGAGCGACGAAGCA | Pull-down |
| FVE-pMALc5X-1-R | CTCGAGTCAAGGCTTGGAGGCACAAG | Pull-down |
| FVE-N-pMALc5X-1-F | GGATCCATGGAGAGCGACGAAGCAGC | Pull-down |
| FVE-N-pMALc5X-1-R | CTCGAGCGGTCTTGTACTTCTTCACAA | Pull-down |
| FVE-C-pMALc5X-1-F | GGATCCATGATCATTCACCCTGGAGAG | Pull-down |
| FVE-C-pMALc5X-1-R | CTCGAGCAGGCTTGGAGGCACAAGTC | Pull-down |
| PTM-N-nYFP-F | CTCGAGCATGGAAGCGAAGGTTCCTA | BiFC |
| PTM-N-nYFP-R | GAATTCGAAGAGTCGCCCATGTGG | BiFC |
| FVE-cYFP-F | CTCGAGATGGAGAGCGACGAAGCAGC | BiFC |
| FVE-cYFP-R | GGATCCCAGGCTTGGAGGCACAAGTC | BiFC |
| FVE-N-cYFP-F | CTCGAGATGGAGAGCGACGAAGCAGC | BiFC |
| FVE-N-cYFP-R | GGATCCCGGTCTTGTACTTCTTCACAA | BiFC |
| FVE-C-cYFP-F | GCGCTCGAGATGATCATTCACCCTGGA | BiFC |
| FVE-C-cYFP-R | GGATCCCAGGCTTGGAGGCACAAGTC | BiFC |
| FLCp-LUC-F | AAGCTTGTTACCATTCAAACGGTATA | LUC |
| FLCp-LUC-R | GGATCCGGCTTCTCTCCGAGAGGG | LUC |
| PTM-N-pBSK-F | CTCGAGCATGGAAGCGAAGGTTCCTA | LUC |
| PTM-N-pBSK-R | GAATTCGAAGAGTCGCCCATGTGG | LUC |
| FLCp-probe-F | CAAAAAAAAAAAAATATCTGGCCCGACGAAGAAAAAGTAG | EMSA |
| FLCp-probe-R | CTACTTTTTCTTCGTCGGGCCAGATATTTTTTTTTTTTTG | EMSA |
Isolation of Nuclear Protein Extracts.
Nuclear protein extracts were isolated from 3-wk-old Arabidopsis leaves using the CelLytic PN Isolation/Extraction Kit (Sigma-Aldrich) and then used in the immunoblot and co-IP assays.
Yeast One-Hybrid Assay.
To detect the binding activity of N-PTM, plasmid with GAL4 DNA-binding domain fusions were cotransformed with LacZ reporter genes driven by various FLC promoter fragments into the yeast strain EGY48 using standard transformation techniques. Transformants were grown on proper dropout plates containing X-gal for blue color development.
More detailed information regarding the experimental procedures used in this study is provided in SI Materials and Methods.
SI Materials and Methods
Plant Growth Conditions and Treatments.
High-light treatment was performed as follows. After seed germination, all seedlings were grown on MS medium for 7 d and then transferred to the soil for another 2 wk at 100 µmol m−2 s−1. For high-light treatment, plants were subjected to different light irradiances under LDs until flowering. The flowering time was determined by the sum of the numbers of rosette and cauline leaves at bolting. At least 16 plants were counted and averaged for each measurement. Statistical evaluation was performed with Student’s t test.
Generation of Transgenic Lines.
To produce the transgenic plants overexpressing N-PTM, three copies of the FLAG-coding sequence were fused in frame to the 3′ end of the gene and driven by the CaMV 35S promoter using the pSN1301 vector. For the FVEp:FVE-GFP transgenic line, the full ORF of FVE lacking the stop codon with its native promoter was cloned into the binary vector p2300GFP to form a fusion with GFP. To generate FLCp:FLC and FLCpm:FLC transgenic plants, a FLC genomic fragment containing a 2.0-kb promoter sequence upstream of the transcription start site including or lacking the 39-bp region was subcloned into the modified pCAMBIA1300 vector, in which the CaMV 35S promoter was deleted. The PCR primers used for subcloning are listed in Table S1. Stable homozygous T3 plants were used for the experiments.
Generation of Anti-FVE Antibody.
The FVE-specific antibody was generated against the synthetic peptide covering a sequence of 26 N-terminal amino acids of the FVE protein as described previously (40). This peptide was conjugated with keyhole limpet hemocyanin and injected into rabbits over a 6-wk period. The antiserum obtained was affinity-purified to remove nonspecific antibodies and used for immunoblotting and ChIP assays. This antibody recognizes a protein of ∼56 kDa in WT plants but not in fve-3 plants, demonstrating its FVE specificity.
Yeast Two-Hybrid Assay.
To construct the vectors for the yeast two-hybrid assay, the coding regions of PTM and FVE and their truncated versions were amplified and cloned into pB42AD and pEG202 (Clontech). The respective plasmids were cotransformed into the yeast strain EGY48, which already contains the reporter plasmid p8op:LacZ. Transformants were grown on proper dropout plates containing X-gal for blue color development, and liquid assays were conducted as described in the Yeast Protocols Handbook (Clontech; Yeast Protocols Handbook: https://www.clontech.com/xxclt_ibcGetAttachment.jsp?cItemId=17602&minisite=10020&secItmId=16131). The library screening was performed in accordance with the manufacturer’s instructions (Clontech).
In Vitro Pull-Down Assay.
N-PTM fused to GST protein was purified using glutathione beads (GE Healthcare), and FVE, N-FVE, and C-FVE fused to maltose-binding protein (MBP) were purified using amylose resin (New England Biolabs) according to the manufacturer’s protocol. Then 2 µg of GST-N-PTM–bound glutathione beads was incubated with 2 μg of MBP-FVE, MBP-N-FVE, MBP-C-FVE, or MBP alone in binding buffer containing 20 mM Tris⋅Cl pH 7.5, 100 mM NaCl, 5% glycerol, and 0.1% Nonidet P-40 at 4 °C for 2 h. The beads were then washed three times with washing buffer (20 mM Tris⋅Cl pH 7.5, 100 mM NaCl, 5% glycerol, and 0.5% Nonidet P-40). The protein eluted from the beads by boiling in 50 µL of 2× sampling buffer was loaded onto the 12.5% SDS/PAGE gel and analyzed by immunoblot assay using anti-MBP antibody (E8032, 1:5,000 dilution; New England Biolabs).
EMSA.
EMSA was performed using biotin-labeled probes and the LightShift Chemiluminescent EMSA Kit (Thermo Fisher Scientific). The sequences of the complementary oligonucleotides used to generate biotin-labeled and unlabeled probes are listed in Table S1. To generate the MBP–N-PTM construct, the N-terminal coding sequence of PTM was inserted into pMALc5-X (New England Biolabs). Recombinant protein expression and purification procedures and EMSA were performed according to the manufacturer’s instructions.
Co-IP Assays.
For co-IP assays in tobacco leaves, agroinfiltration was performed as described previously (59). Leaves of 6-wk old Nicotiana benthamiana plants were infiltrated with bacterial culture harboring 35S:N-PTM-FLAG and FVEp:FVE-GFP plasmids. In all experiments, Agrobacterium GV3101 carrying a 35:p19 construct was cotransfected to produce a maximum level of protein expression. For co-IP assays in Arabidopsis plants, transgenic lines expressing FVE-GFP from FVE native promoter (FVEp:FVE-GFP) were grown under normal light or treated with high light. Harvested tissues were ground in liquid nitrogen, homogenized in the extraction buffer (50 mM Tris⋅Cl pH 7.5, 1 mM EDTA, 75 mM NaCl, 0.1% Triton X-100, 5% glycerol, and 1× protease inhibitor mixture), and sonicated five times to break the nuclei. After centrifugation at 16,000 × g for 30 min, the supernatant was incubated with anti-YFP antibody immobilized on protein A/G agarose beads (GE Healthcare) overnight, after which the beads was washed four times with wash buffer and eluted by boiling with 2× SDS sample buffer for 10 min. Samples were analyzed by SDS/PAGE and immunoblotted with anti-PTM antibody (homemade, 1:3,000 dilution).
In Vivo Chemiluminescence Imaging.
The 3-wk-old FLCp:LUC and FLCp:LUC/ptm plants were sprayed with 1 mM d-luciferin (Promega) in 0.01% Triton X-100 and then incubated in the dark for 30 min. Sprayed plants were placed in the dark box, and luciferase bioluminescence imaging was detected using a NightOWL CCD photon counting camera (Berthold). Images were captured by exposure for 5 min in 2 × 2 binning mode and processed with Indigo Imaging software.
ChIP Assay.
The ChIP experiment was performed as described previously with some modifications (60). WT and 35S:N-PTM-FLAG transgenic plants were grown on soil for 2 wk under different conditions and then collected. All collected samples were cross-linked for 15 min in 1% formaldehyde under vacuum and quenched by 0.25 M glycine. Chromatin extracts were sonicated with a Branson Sonifier 450 (VWR Scientific) to yield an average fragment size of 250 bp, and immunoprecipitation was performed with anti-FLAG antibody or anti-FVE polyclonal antibody. The immunoprecipitated protein and DNA were eluted with 1% SDS and 0.1 M NaHCO3, and the cross-link was reversed by incubation at 65 °C overnight in the presence of 250 mM NaCl. DNA recovered from the immunoprecipitation or 10% input DNA was used for ChIP-qPCR using the oligonucleotide primers listed in Table S1.
Protoplast Preparation and Transformation.
The Arabidopsis protoplast preparation was performed as described previously (32). Adult leaves of 3-wk-old WT plants were cut into 0.5-mm pieces with a sharp razor. Leaves were immediately transferred to the enzyme solution (0.6 M mannitol, 10 mM MES pH 5.7, 1.5% cellulase RS, 0.75% macerozyme R10, 0.1% BSA, and 1 mM CaCl2) and then incubated for 4 h in the dark. Then one volume of cold W5 solution (154 mM NaCl, 125 mM CaCl2, 5 mM KCl, and 2 mM MES pH 5.7) was added to the obtained protoplast suspension, and the mixture was passed through a 35-nm nylon mesh filter. The solution was centrifuged for 5 min at 200 × g to pellet the protoplasts, and then washed again with W5 solution. Cells at 2 × 10⁶ cells/mL were resuspended in MMG solution (0.4 M mannitol, 15 mM MgCl2, and 4 mM MES pH 5.7) and kept on ice for 30 min. For PEG-mediated transformation, 40% PEG [0.2 M mannitol, 100 mM NaCl, and 40% (vol/vol) PEG4000; Fluka] was added to the protoplasts and incubated for 15 min. Then cells were washed with a 10× volume of W5 and resuspended in 1 mL of W5. All of the experiments were carried out at room temperature. The protoplasts were kept in constant light at 28 °C overnight. For the BiFC assay, 10–20 µg of plasmid DNA from N-PTM–nYFP and various constructs of FVE fused with cYFP were used for the transformation. H2B-RFP was cotransformed as the nuclear control. YFP fluorescence was visualized using a confocal scanning microscope (Leica Microsystems). For luciferase transient assays, the reporter construct FLC:LUC, the effector 35S:N-PTM, and the 35S:GUS plasmids were cotransformed into the protoplasts. Luciferase activity was measured as described previously (32).
Statistical Analysis.
The statistical significance between two means of measurements was determined using Student’s t test, with a P value < 0.01 or < 0.05.
Acknowledgments
We thank Dr. Kang Chong for the seeds of flc-3 and flc-20 mutants; Dr. Shilai Bao for the fve-3, fld-4, fca-9, fpa, ld, fy, flk, and skb1-1 mutants, as well as helpful comments; and members of the L.Z. laboratory for discussions. This work was supported by the Major State Basic Research Development Program (Grant 2015CB150100) and the National Natural Science Foundation of China (Grant 31370273).
Footnotes
The authors declare no conflict of interest.
This article is a PNAS Direct Submission.
This article contains supporting information online at www.pnas.org/lookup/suppl/doi:10.1073/pnas.1521599113/-/DCSupplemental.
References
- 1.Amasino R. Seasonal and developmental timing of flowering. Plant J. 2010;61(6):1001–1013. doi: 10.1111/j.1365-313X.2010.04148.x. [DOI] [PubMed] [Google Scholar]
- 2.Simpson GG, Dean C. Arabidopsis, the Rosetta Stone of flowering time? Science. 2002;296(5566):285–289. doi: 10.1126/science.296.5566.285. [DOI] [PubMed] [Google Scholar]
- 3.Bäurle I, Dean C. The timing of developmental transitions in plants. Cell. 2006;125(4):655–664. doi: 10.1016/j.cell.2006.05.005. [DOI] [PubMed] [Google Scholar]
- 4.Srikanth A, Schmid M. Regulation of flowering time: All roads lead to Rome. Cell Mol Life Sci. 2011;68(12):2013–2037. doi: 10.1007/s00018-011-0673-y. [DOI] [PMC free article] [PubMed] [Google Scholar]
- 5.Lee JH, et al. Regulation of temperature-responsive flowering by MADS-box transcription factor repressors. Science. 2013;342(6158):628–632. doi: 10.1126/science.1241097. [DOI] [PubMed] [Google Scholar]
- 6.Andrés F, Coupland G. The genetic basis of flowering responses to seasonal cues. Nat Rev Genet. 2012;13(9):627–639. doi: 10.1038/nrg3291. [DOI] [PubMed] [Google Scholar]
- 7.Wang JW, Czech B, Weigel D. miR156-regulated SPL transcription factors define an endogenous flowering pathway in Arabidopsis thaliana. Cell. 2009;138(4):738–749. doi: 10.1016/j.cell.2009.06.014. [DOI] [PubMed] [Google Scholar]
- 8.Mutasa-Göttgens E, Hedden P. Gibberellin as a factor in floral regulatory networks. J Exp Bot. 2009;60(7):1979–1989. doi: 10.1093/jxb/erp040. [DOI] [PubMed] [Google Scholar]
- 9.Kim DH, Doyle MR, Sung S, Amasino RM. Vernalization: Winter and the timing of flowering in plants. Annu Rev Cell Dev Biol. 2009;25:277–299. doi: 10.1146/annurev.cellbio.042308.113411. [DOI] [PubMed] [Google Scholar]
- 10.Lee H, et al. The AGAMOUS-LIKE 20 MADS domain protein integrates floral inductive pathways in Arabidopsis. Genes Dev. 2000;14(18):2366–2376. doi: 10.1101/gad.813600. [DOI] [PMC free article] [PubMed] [Google Scholar]
- 11.Michaels SD, Amasino RM. FLOWERING LOCUS C encodes a novel MADS domain protein that acts as a repressor of flowering. Plant Cell. 1999;11(5):949–956. doi: 10.1105/tpc.11.5.949. [DOI] [PMC free article] [PubMed] [Google Scholar]
- 12.Sheldon CC, et al. The FLF MADS box gene: A repressor of flowering in Arabidopsis regulated by vernalization and methylation. Plant Cell. 1999;11(3):445–458. doi: 10.1105/tpc.11.3.445. [DOI] [PMC free article] [PubMed] [Google Scholar]
- 13.Kim DH, Sung S. Genetic and epigenetic mechanisms underlying vernalization. Arabidopsis Book. 2014;12:e0171. doi: 10.1199/tab.0171. [DOI] [PMC free article] [PubMed] [Google Scholar]
- 14.Berry S, Dean C. Environmental perception and epigenetic memory: Mechanistic insight through FLC. Plant J. 2015;83(1):133–148. doi: 10.1111/tpj.12869. [DOI] [PMC free article] [PubMed] [Google Scholar]
- 15.Jiao Y, Lau OS, Deng XW. Light-regulated transcriptional networks in higher plants. Nat Rev Genet. 2007;8(3):217–230. doi: 10.1038/nrg2049. [DOI] [PubMed] [Google Scholar]
- 16.Suárez-López P, et al. CONSTANS mediates between the circadian clock and the control of flowering in Arabidopsis. Nature. 2001;410(6832):1116–1120. doi: 10.1038/35074138. [DOI] [PubMed] [Google Scholar]
- 17.Sawa M, Nusinow DA, Kay SA, Imaizumi T. FKF1 and GIGANTEA complex formation is required for day-length measurement in Arabidopsis. Science. 2007;318(5848):261–265. doi: 10.1126/science.1146994. [DOI] [PMC free article] [PubMed] [Google Scholar]
- 18.Song YH, Smith RW, To BJ, Millar AJ, Imaizumi T. FKF1 conveys timing information for CONSTANS stabilization in photoperiodic flowering. Science. 2012;336(6084):1045–1049. doi: 10.1126/science.1219644. [DOI] [PMC free article] [PubMed] [Google Scholar]
- 19.Corbesier L, et al. FT protein movement contributes to long-distance signaling in floral induction of Arabidopsis. Science. 2007;316(5827):1030–1033. doi: 10.1126/science.1141752. [DOI] [PubMed] [Google Scholar]
- 20.Abe M, et al. FD, a bZIP protein mediating signals from the floral pathway integrator FT at the shoot apex. Science. 2005;309(5737):1052–1056. doi: 10.1126/science.1115983. [DOI] [PubMed] [Google Scholar]
- 21.Wigge PA, et al. Integration of spatial and temporal information during floral induction in Arabidopsis. Science. 2005;309(5737):1056–1059. doi: 10.1126/science.1114358. [DOI] [PubMed] [Google Scholar]
- 22.Cerdán PD, Chory J. Regulation of flowering time by light quality. Nature. 2003;423(6942):881–885. doi: 10.1038/nature01636. [DOI] [PubMed] [Google Scholar]
- 23.Halliday KJ, Salter MG, Thingnaes E, Whitelam GC. Phytochrome control of flowering is temperature-sensitive and correlates with expression of the floral integrator FT. Plant J. 2003;33(5):875–885. doi: 10.1046/j.1365-313x.2003.01674.x. [DOI] [PubMed] [Google Scholar]
- 24.Levy YY, Dean C. The transition to flowering. Plant Cell. 1998;10(12):1973–1990. doi: 10.1105/tpc.10.12.1973. [DOI] [PMC free article] [PubMed] [Google Scholar]
- 25.Castro Marín I, et al. Nitrate regulates floral induction in Arabidopsis, acting independently of light, gibberellin, and autonomous pathways. Planta. 2011;233(3):539–552. doi: 10.1007/s00425-010-1316-5. [DOI] [PMC free article] [PubMed] [Google Scholar]
- 26.Michaels SD, He Y, Scortecci KC, Amasino RM. Attenuation of FLOWERING LOCUS C activity as a mechanism for the evolution of summer-annual flowering behavior in Arabidopsis. Proc Natl Acad Sci USA. 2003;100(17):10102–10107. doi: 10.1073/pnas.1531467100. [DOI] [PMC free article] [PubMed] [Google Scholar]
- 27.Gazzani S, Gendall AR, Lister C, Dean C. Analysis of the molecular basis of flowering time variation in Arabidopsis accessions. Plant Physiol. 2003;132(2):1107–1114. doi: 10.1104/pp.103.021212. [DOI] [PMC free article] [PubMed] [Google Scholar]
- 28.Finnegan EJ, Sheldon CC, Jardinaud F, Peacock WJ, Dennis ES. A cluster of Arabidopsis genes with a coordinate response to an environmental stimulus. Curr Biol. 2004;14(10):911–916. doi: 10.1016/j.cub.2004.04.045. [DOI] [PubMed] [Google Scholar]
- 29.Li Z, Wakao S, Fischer BB, Niyogi KK. Sensing and responding to excess light. Annu Rev Plant Biol. 2009;60(1):239–260. doi: 10.1146/annurev.arplant.58.032806.103844. [DOI] [PubMed] [Google Scholar]
- 30.Nott A, Jung HS, Koussevitzky S, Chory J. Plastid-to-nucleus retrograde signaling. Annu Rev Plant Biol. 2006;57:739–759. doi: 10.1146/annurev.arplant.57.032905.105310. [DOI] [PubMed] [Google Scholar]
- 31.Sun X, et al. A chloroplast envelope-bound PHD transcription factor mediates chloroplast signals to the nucleus. Nat Commun. 2011;2:477. doi: 10.1038/ncomms1486. [DOI] [PubMed] [Google Scholar]
- 32.King RW, Hisamatsu T, Goldschmidt EE, Blundell C. The nature of floral signals in Arabidopsis, I: Photosynthesis and a far-red photoresponse independently regulate flowering by increasing expression of FLOWERING LOCUS T (FT) J Exp Bot. 2008;59(14):3811–3820. doi: 10.1093/jxb/ern231. [DOI] [PMC free article] [PubMed] [Google Scholar]
- 33.Kumar SV, et al. Transcription factor PIF4 controls the thermosensory activation of flowering. Nature. 2012;484(7393):242–245. doi: 10.1038/nature10928. [DOI] [PMC free article] [PubMed] [Google Scholar]
- 34.Kumar SV, Wigge PA. H2A.Z-containing nucleosomes mediate the thermosensory response in Arabidopsis. Cell. 2010;140(1):136–147. doi: 10.1016/j.cell.2009.11.006. [DOI] [PubMed] [Google Scholar]
- 35.Yoo SD, Cho YH, Sheen J. Arabidopsis mesophyll protoplasts: A versatile cell system for transient gene expression analysis. Nat Protoc. 2007;2(7):1565–1572. doi: 10.1038/nprot.2007.199. [DOI] [PubMed] [Google Scholar]
- 36.Mellor J. It takes a PHD to read the histone code. Cell. 2006;126(1):22–24. doi: 10.1016/j.cell.2006.06.028. [DOI] [PubMed] [Google Scholar]
- 37.Crevillén P, Dean C. Regulation of the floral repressor gene FLC: The complexity of transcription in a chromatin context. Curr Opin Plant Biol. 2011;14(1):38–44. doi: 10.1016/j.pbi.2010.08.015. [DOI] [PubMed] [Google Scholar]
- 38.Jarillo JA, Piñeiro M, Cubas P, Martínez-Zapater JM. Chromatin remodeling in plant development. Int J Dev Biol. 2009;53(8-10):1581–1596. doi: 10.1387/ijdb.072460jj. [DOI] [PubMed] [Google Scholar]
- 39.Bienz M. The PHD finger, a nuclear protein-interaction domain. Trends Biochem Sci. 2006;31(1):35–40. doi: 10.1016/j.tibs.2005.11.001. [DOI] [PubMed] [Google Scholar]
- 40.Ausín I, Alonso-Blanco C, Jarillo JA, Ruiz-García L, Martínez-Zapater JM. Regulation of flowering time by FVE, a retinoblastoma-associated protein. Nat Genet. 2004;36(2):162–166. doi: 10.1038/ng1295. [DOI] [PubMed] [Google Scholar]
- 41.Kim HJ, et al. A genetic link between cold responses and flowering time through FVE in Arabidopsis thaliana. Nat Genet. 2004;36(2):167–171. doi: 10.1038/ng1298. [DOI] [PubMed] [Google Scholar]
- 42.Koornneef M, Hanhart CJ, van der Veen JH. A genetic and physiological analysis of late flowering mutants in Arabidopsis thaliana. Mol Gen Genet. 1991;229(1):57–66. doi: 10.1007/BF00264213. [DOI] [PubMed] [Google Scholar]
- 43.Wang X, et al. SKB1-mediated symmetric dimethylation of histone H4R3 controls flowering time in Arabidopsis. EMBO J. 2007;26(7):1934–1941. doi: 10.1038/sj.emboj.7601647. [DOI] [PMC free article] [PubMed] [Google Scholar]
- 44.Lopez-Juez E, Pyke KA. Plastids unleashed: Their development and their integration in plant development. Int J Dev Biol. 2005;49(5-6):557–577. doi: 10.1387/ijdb.051997el. [DOI] [PubMed] [Google Scholar]
- 45.Ietswaart R, Wu Z, Dean C. Flowering time control: Another window to the connection between antisense RNA and chromatin. Trends Genet. 2012;28(9):445–453. doi: 10.1016/j.tig.2012.06.002. [DOI] [PubMed] [Google Scholar]
- 46.He Y. Chromatin regulation of flowering. Trends Plant Sci. 2012;17(9):556–562. doi: 10.1016/j.tplants.2012.05.001. [DOI] [PubMed] [Google Scholar]
- 47.Heo JB, Sung S. Vernalization-mediated epigenetic silencing by a long intronic noncoding RNA. Science. 2011;331(6013):76–79. doi: 10.1126/science.1197349. [DOI] [PubMed] [Google Scholar]
- 48.Swiezewski S, Liu F, Magusin A, Dean C. Cold-induced silencing by long antisense transcripts of an Arabidopsis Polycomb target. Nature. 2009;462(7274):799–802. doi: 10.1038/nature08618. [DOI] [PubMed] [Google Scholar]
- 49.He Y, Michaels SD, Amasino RM. Regulation of flowering time by histone acetylation in Arabidopsis. Science. 2003;302(5651):1751–1754. doi: 10.1126/science.1091109. [DOI] [PubMed] [Google Scholar]
- 50.Lee I, Amasino RM. Effect of vernalization, photoperiod, and light quality on the flowering phenotype of Arabidopsis plants containing the FRIGIDA gene. Plant Physiol. 1995;108(1):157–162. doi: 10.1104/pp.108.1.157. [DOI] [PMC free article] [PubMed] [Google Scholar]
- 51.Johanson U, et al. Molecular analysis of FRIGIDA, a major determinant of natural variation in Arabidopsis flowering time. Science. 2000;290(5490):344–347. doi: 10.1126/science.290.5490.344. [DOI] [PubMed] [Google Scholar]
- 52.Coustham V, et al. Quantitative modulation of polycomb silencing underlies natural variation in vernalization. Science. 2012;337(6094):584–587. doi: 10.1126/science.1221881. [DOI] [PubMed] [Google Scholar]
- 53.Fournier-Level A, et al. A map of local adaptation in Arabidopsis thaliana. Science. 2011;334(6052):86–89. doi: 10.1126/science.1209271. [DOI] [PubMed] [Google Scholar]
- 54.Pazhouhandeh M, Molinier J, Berr A, Genschik P. MSI4/FVE interacts with CUL4-DDB1 and a PRC2-like complex to control epigenetic regulation of flowering time in Arabidopsis. Proc Natl Acad Sci USA. 2011;108(8):3430–3435. doi: 10.1073/pnas.1018242108. [DOI] [PMC free article] [PubMed] [Google Scholar]
- 55.Jeon J, Kim J. FVE, an Arabidopsis homologue of the retinoblastoma-associated protein that regulates flowering time and cold response, binds to chromatin as a large multiprotein complex. Mol Cells. 2011;32(3):227–234. doi: 10.1007/s10059-011-1022-6. [DOI] [PMC free article] [PubMed] [Google Scholar]
- 56.Jung JH, et al. The cold signaling attenuator HIGH EXPRESSION OF OSMOTICALLY RESPONSIVE GENE1 activates FLOWERING LOCUS C transcription via chromatin remodeling under short-term cold stress in Arabidopsis. Plant Cell. 2013;25(11):4378–4390. doi: 10.1105/tpc.113.118364. [DOI] [PMC free article] [PubMed] [Google Scholar]
- 57.Woodson JD, Chory J. Coordination of gene expression between organellar and nuclear genomes. Nat Rev Genet. 2008;9(5):383–395. doi: 10.1038/nrg2348. [DOI] [PMC free article] [PubMed] [Google Scholar]
- 58.Chi W, Sun X, Zhang L. Intracellular signaling from plastid to nucleus. Annu Rev Plant Biol. 2013;64(1):559–582. doi: 10.1146/annurev-arplant-050312-120147. [DOI] [PubMed] [Google Scholar]
- 59.Sparkes IA, Runions J, Kearns A, Hawes C. Rapid, transient expression of fluorescent fusion proteins in tobacco plants and generation of stably transformed plants. Nat Protoc. 2006;1(4):2019–2025. doi: 10.1038/nprot.2006.286. [DOI] [PubMed] [Google Scholar]
- 60.Yamaguchi N, et al. PROTOCOLS: Chromatin immunoprecipitation from Arabidopsis tissues. Arabidopsis Book. 2014;12:e0170. doi: 10.1199/tab.0170. [DOI] [PMC free article] [PubMed] [Google Scholar]


