Significance
Angiotensin-converting enzymes Ace and Ace2 counteract each other to control the metabolism of angiotensin peptides and heart function. When the heart is pathologically stressed, Ace is up-regulated whereas Ace2 is down-regulated, leading to a pathological Ace2-to-Ace switch and increased production of angiotensin II, which promotes hypertrophy and fibrosis. The mechanism of Ace2-to-Ace switch is unknown. In this study, we discovered that the Ace/Ace2 switch occurs at the transcription level and defined a chromatin-based endothelial mechanism that triggers Ace/Ace2 transcription switch and heart failure. Human tissue studies suggest that this mechanism is evolutionarily conserved. Our studies reveal a pharmacological method to simultaneously inhibit pathogenic Ace and activate cardioprotective Ace2. This finding provides new insights and methods for heart failure therapy.
Keywords: chromatin remodeling, endothelial cells, Brg1, FoxM1, cardiac hypertrophy
Abstract
Genes encoding angiotensin-converting enzymes (Ace and Ace2) are essential for heart function regulation. Cardiac stress enhances Ace, but suppresses Ace2, expression in the heart, leading to a net production of angiotensin II that promotes cardiac hypertrophy and fibrosis. The regulatory mechanism that underlies the Ace2-to-Ace pathological switch, however, is unknown. Here we report that the Brahma-related gene-1 (Brg1) chromatin remodeler and forkhead box M1 (FoxM1) transcription factor cooperate within cardiac (coronary) endothelial cells of pathologically stressed hearts to trigger the Ace2-to-Ace enzyme switch, angiotensin I-to-II conversion, and cardiac hypertrophy. In mice, cardiac stress activates the expression of Brg1 and FoxM1 in endothelial cells. Once activated, Brg1 and FoxM1 form a protein complex on Ace and Ace2 promoters to concurrently activate Ace and repress Ace2, tipping the balance to Ace2 expression with enhanced angiotensin II production, leading to cardiac hypertrophy and fibrosis. Disruption of endothelial Brg1 or FoxM1 or chemical inhibition of FoxM1 abolishes the stress-induced Ace2-to-Ace switch and protects the heart from pathological hypertrophy. In human hypertrophic hearts, BRG1 and FOXM1 expression is also activated in endothelial cells; their expression levels correlate strongly with the ACE/ACE2 ratio, suggesting a conserved mechanism. Our studies demonstrate a molecular interaction of Brg1 and FoxM1 and an endothelial mechanism of modulating Ace/Ace2 ratio for heart failure therapy.
Despite modern cardiac care, heart failure remains the leading cause of death, with a mortality rate of ∼50% within 5 y of diagnosis (1). New mechanisms and therapeutic strategies for heart failure are needed. Most studies focus on the cardiomyocytes’ maladaptive response to pathological stress as a cause of heart failure; little is known about how endothelial cells within the heart react to pathological stress to modify heart function. In heart failure patients without coronary artery disease, coronary endothelial dysfunction correlates with adverse cardiac remodeling, contractile abnormalities, and brain natriuretic peptide (BNP) levels (2–6); however, the endothelial function of peripheral arteries is preserved in those patients (3). These findings suggest that localized endothelial dysfunction in the heart is crucial for cardiac remodeling and hypertrophy. This aspect of cardiac endothelial function, however, is not well understood, and its clinical potential as a therapeutic target has not been sufficiently developed (7).
Heart function regulation requires angiotensin peptides (8), which are predominantly produced within the heart. Angiotensin peptides have much higher concentrations in the heart than in the plasma (9–11): The interstitial concentration of angiotensin II (Ang II) of the heart is ∼100-fold more than that of plasma (11, 12). Within the heart, >90% of Ang I is synthesized locally, and >75% of Ang II is produced by enzymatic conversion of the local cardiac Ang I (13, 14). Cardiac (coronary) endothelial cells are the primary source that produces angiotensin-converting enzymes (Ace and Ace2) to control angiotensin peptide production (8, 15). Ace and Ace2 are tethered to endothelial cell membrane or secreted into the interstitial space, where these enzymes process Ang I and II peptides. Biochemically, Ace converts the decapeptide Ang I (1–12) to octapeptide Ang II (1–10), whereas Ace2 degrades Ang II to form Ang-(1–7) (16) and cleaves Ang I into Ang-(1–9) (17). Functionally, Ang II is a potent stimulant of cardiac hypertrophy and fibrosis (8); conversely, Ang-(1–7) and Ang-(1–9) inhibit Ang II’s cardiac effects to maintain heart function (8, 18). Therefore, Ace and Ace2 counteract each other to regulate heart function.
When the heart is pathologically stressed, Ace is up-regulated (19) and Ace2 down-regulated (20, 21), tipping the balance to Ace dominance with enhanced Ang II and reduced Ang-(1–7) and -(1–9) production. Such Ace/Ace2 perturbation contributes to the development of hypertrophy and heart failure. Inhibition of Ace (22) or overexpression of Ace2 protects the heart from stress-induced failure (20); conversely, Ace2 knockout mice exhibit heart dysfunction (23). Therefore, Ace promotes cardiac pathology (22), whereas Ace2 inhibits cardiomyopathy (20, 23). Balancing Ace/Ace2 is thus critical for maintaining heart function.
It is unclear how Ace and Ace2 expression is controlled by endothelial cells within the heart. Gene regulation requires control at the level of chromatin, which provides a dynamic scaffold to package DNA and dictates accessibility of DNA sequence to transcription factors. Here we show that Brahma-related gene-1 (Brg1), an essential ATPase subunit of the BAF chromatin-remodeling complex (24), is activated by pathological stress within the endothelium of mouse hearts to control Ace and Ace2 expression. Brg1 complexes with the forkhead box transcription factor forkhead box M1 (FoxM1), which has both transactivating and repressor domains for transcription regulation, to bind to Ace and Ace2 promoters to simultaneously activate Ace and repress Ace2 transcription. Mice with endothelial Brg1 deletion or with FoxM1 inhibition or genetic disruption show resistance to stress-induced Ace/Ace2 switch, cardiac hypertrophy, and heart dysfunction. In human hypertrophic hearts, BRG1 and FOXM1 are also highly activated, and their activation correlates strongly with the ACE/ACE2 ratio and disease severity, indicating a conserved endothelial mechanism for human cardiomyopathy. Brg1 and FoxM1 are therefore essential endothelial mediators of cardiac stress that triggers pathological hypertrophy. Given the lack of ACE2 drugs that limit full clinical exploitation of this pathway, targeting the Brg1–FoxM1 complex may offer an alternative strategy for concurrent ACE and ACE2 control in heart failure therapy. Furthermore, the studies demonstrated a molecular interaction between Brg1 and FoxM1 in gene control, which provides novel insights into the mechanisms of FoxM1-mediated organ development and oncogenic processes (25–27).
Results
Dynamic Changes of Endothelial Factors that Contribute to Cardiac Hypertrophy.
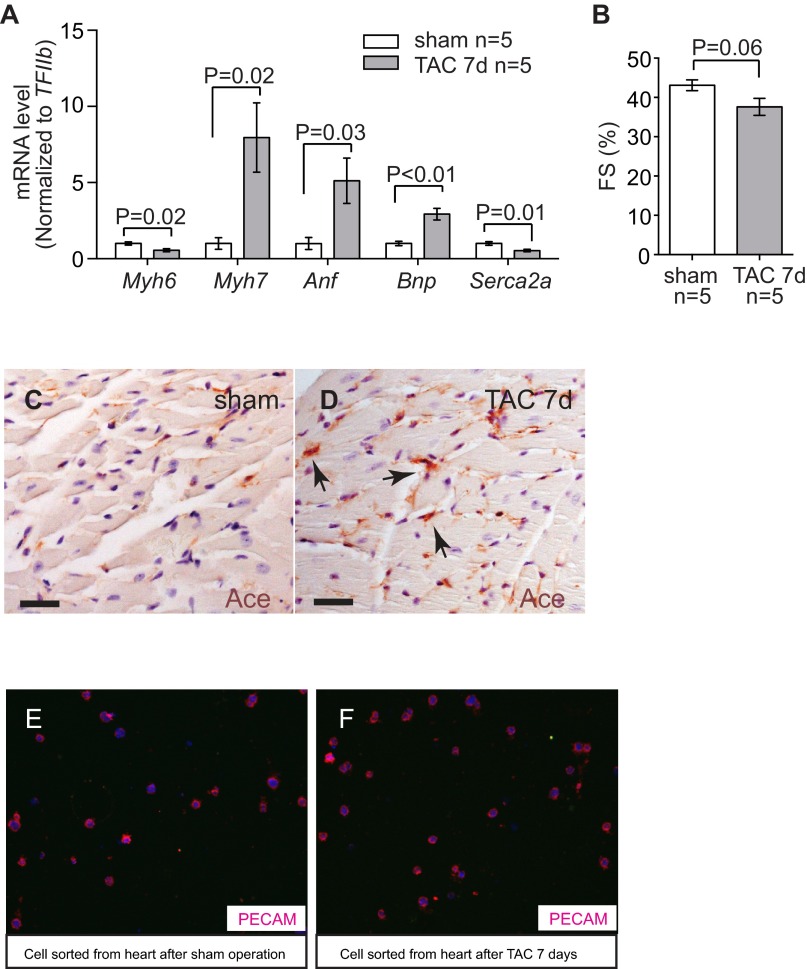
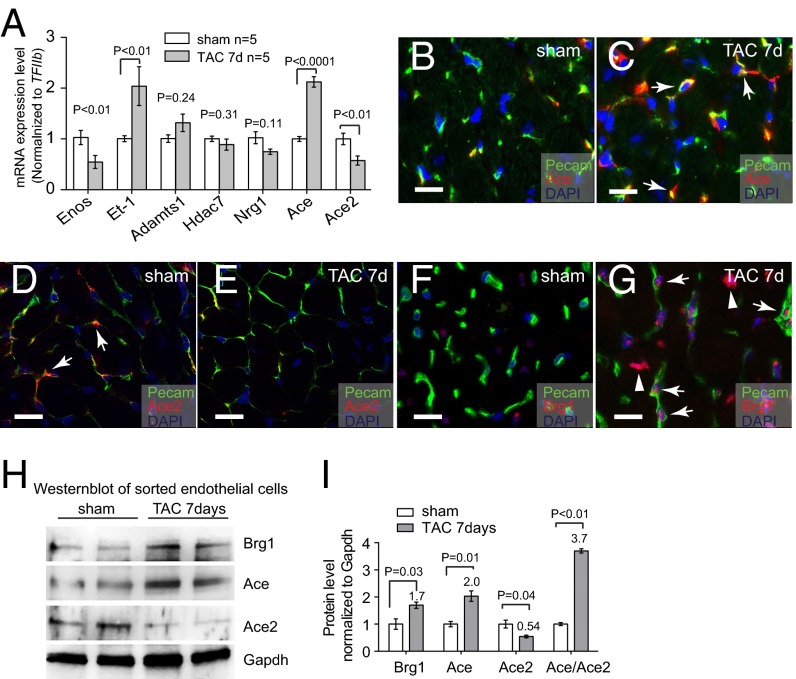
To identify endothelial factors that might contribute to cardiomyopathy, we surveyed a number of endothelial genes for their changes of expression after left ventricular pressure overload generated by transaortic constriction (TAC) (24, 28). TAC-induced heart dysfunction was verified by echocardiography and molecular markers Myh6, Myh7, Anf, Bnp, and Serca2a (Figs. S1 A and B and S2 A–D). By performing reverse transcription and quantitative PCR (RT-qPCR) of left ventricles (LVs), we examined the expression of the following cardiac endothelial factors with or without TAC: eNos, Et-1, Adamts1, Hdac7, Nrg1, Ace, and Ace2 (29). Within 7 d after TAC, Et-1 and Ace were induced 2.0- and 2.1-fold in LVs, whereas Enos and Ace2 were reduced by 46% and 43%, respectively (Fig. 1A). Adamts1, Hdac7, and Nrg1 had no significant changes.
Fig. S1.
Stress-induced changes of endothelial Ace in the hearts. (A) RT-qPCR quantitation of heart stress markers myh6, Myh7, Anf, Bnp, and Serca2a in the heart ventricles 7 d after sham or TAC procedure. n = 5 mice per group. P value: Student's t test. Error bar: SEM. (B) Echocardiographic measurement of FS of the LV after 7 d of TAC. (C and D) Immunostaining of Ace (brown, arrows) in mouse hearts 7 d after sham (C) or TAC (D) operation. Arrows: Ace and endothelial cells. (Scale bars, 20 μm.) (E and F) Immunostaining of Pecam in cells sorted from the hearts after sham (E) or TAC (F) operations. Original magnification: 400×. Red, Pecam; blue, DAPI. The purity of endothelial cells was >90%.
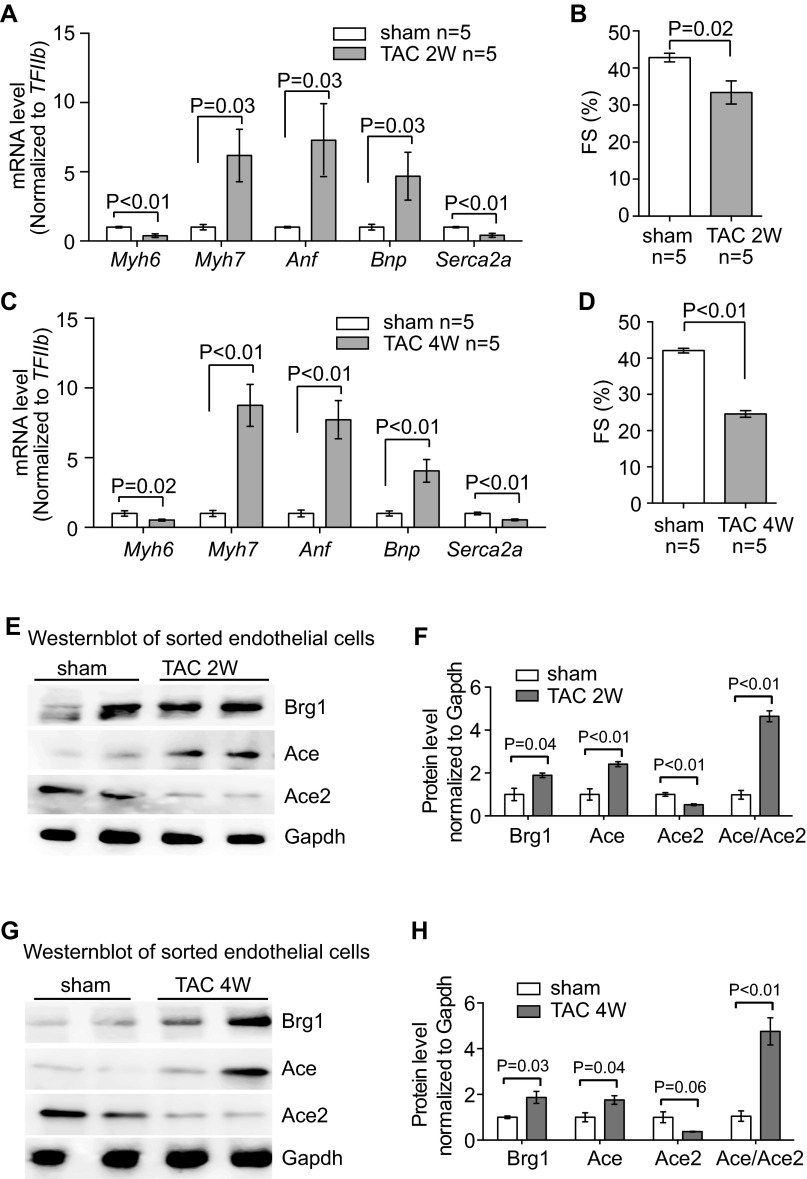
Fig. S2.
Stress-induced changes of endothelial Brg1, Ace, and Ace2 in the hearts. (A) RT-qPCR quantitation of heart stress markers Myh6, Myh7, Anf, Bnp, and Serca2a in the heart ventricles 2 wk after sham or TAC procedure. n = 5 mice per group. P value: Student's t test. Error bar: SEM. (B) Echocardiographic measurement of FS of the LV after 2 wk of TAC. (C) RT-qPCR quantitation of heart stress markers Myh6, Myh7, Anf, Bnp, and Serca2a in the heart ventricles 4 wk after sham or TAC procedure. n = 5 mice per group. P value: Student's t test. Error bar: SEM. (D) Echocardiographic measurement of FS of the LV after 4 wk of TAC. (E–H) Western blot analysis (E and G) and quantitation (F and H) of Ace, Ace2, and Brg1 proteins in cardiac endothelial cells isolated from mouse hearts 2 and 4 wk after sham or TAC operation. P value: Student's t test. Error bar: SEM.
Fig. 1.
Stress-induced changes of endothelial Ace, Ace2, and Brg1 in the hearts. (A) qRT-PCR analysis of eNos, Et-1, Adamts1, Hdac7, Nrg1, Ace, and Ace2 in the mice heart ventricles after sham or TAC operation. n = 5 mice per group. P value: Student's t test. Error bar: SEM. (B and C) Coimmunostaining of Ace (red, arrows) and Pecam (green, labeling endothelial cells) in left ventricles 7 d after sham (B) or TAC (C) operation. Blue, DAPI nuclear stain. (Scale bars, 10 μm.) (D and E) Coimmunostaining of Ace2 (red, arrows) and Pecam (green, labeling endothelial cells) in left ventricles 7 d after sham (D) or TAC (E) operation. Blue, DAPI nuclear stain. (Scale bars, 10 μm.) (F and G) Coimmunostaining of Brg1 (red) and Pecam (green, labeling endothelial cells) in left ventricles 7 d after sham (F) or TAC (G) operation. Blue, DAPI nuclear stain. Arrows, Brg1 in endothelial cell nuclei; arrowheads, Brg1 in myocardial cell nuclei. (Scale bars, 10 μm.) (H and I) Western blot analysis (H) and quantitation (I) of Ace, Ace2, and Brg1 proteins in cardiac endothelial cells isolated from mouse hearts 7 d after sham or TAC operation. P value: Student's t test. Error bar: SEM.
Given that Ace and Ace2 encode enzymes that are critical for heart function (20–23, 29), we focused on the control of Ace and Ace2 expression in TAC-stressed hearts. Immunostaining showed that Ace proteins were present at low levels in healthy hearts, but up-regulated in the endothelium of stressed hearts (Fig. 1 B and C and Fig. S1 C and D). In contrast, Ace2 proteins were present at high levels in the endothelium of healthy hearts, but down-regulated in TAC-stressed hearts (Fig. 1 D and E). To further verify the opposite changes of Ace and Ace2 in endothelial cells, we used anti-CD31 magnetic beads to isolate endothelial cells from hearts after 7 d of sham or TAC operation (30) (Fig. S1 E and F). Immunostaining with anti-CD31/Pecam showed that endothelial cells constituted >90% of the sorted cells (Fig. S1 E and F). Western blot analysis confirmed that Ace proteins were up-regulated to 2.0-fold and Ace2 proteins reduced by 46%, with the ratio of Ace/Ace2 proteins changed by 3.7-fold in endothelial cells of the stressed hearts (Fig. 1 H and I). Such Ace and Ace2 misregulation was also present after 2 and 4 wk of TAC (Fig. S2).
With the view that Ace is known to promote cardiac pathology (22), whereas Ace2 inhibits cardiomyopathy (20, 23), such opposite expression dynamics indicates that a loss of balance between Ace and Ace2 in pressure-stressed hearts is crucial for the development of pathological hypertrophy. Furthermore, the magnitude of stress-induced changes in Ace and Ace2 proteins was comparable to that of mRNA (Fig. 1 A and I), indicating that the primary regulation of Ace and Ace2 in stressed hearts occurs at the transcription level.
Endothelial Brg1 Is Essential for Cardiac Hypertrophy and Dysfunction.
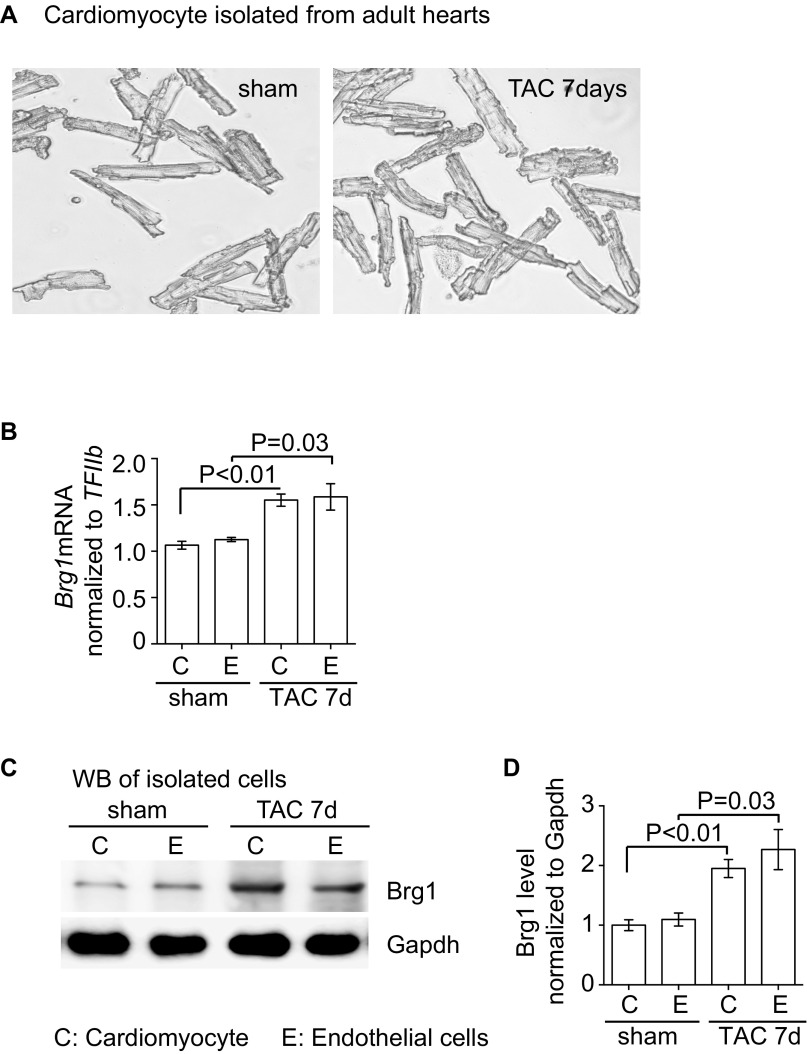
Given that gene-transcription control requires chromatin regulation and that the chromatin remodeler Brg1 is known to control the pathological Myh6/Myh7 switch in stressed cardiomyocytes (24, 28), we hypothesized that Brg1, like in the control of the Myh6/Myh7 switch, could function in endothelial cells to control the Ace/Ace2 switch in stressed hearts. Immunostaining showed that Brg1 was expressed at a minimal/low level in endothelial cells of healthy adult hearts. However, when the hearts were stressed by TAC, Brg1 was up-regulated in the nuclei of both cardiomyocytes and endothelial cells (Fig. 1 G and I). To compare Brg1 expression in cardiomyocytes and endothelial cells, we isolated these two types of cells from sham or TAC-stressed hearts (30) (Figs. S1 E and F and S3A). We found comparable changes of Brg1 expression in those two cell types. TAC increased Brg1 mRNA by ∼1.6-fold and Brg1 protein by twofold in both cardiomyocytes and endothelial cells (Fig. S3 B–D). Although Brg1 activation in cardiomyocytes is crucial for the development of cardiac hypertrophy (24, 28), the function of Brg1 in the endothelium of hypertrophic hearts was unknown.
Fig. S3.
Brg1 is up-regulated in both cardiomyocytes and endothelial cells after stress. (A) Cardiomyocytes were isolated from sham- and TAC-operated hearts. Original magnification: 100×. (B) RT-qPCR quantitation of Brg1 in cardiomyocyte and endothelial cells isolated from sham- and TAC-operated hearts. n = 3; P value: Student's t test. Error bar: SEM. (C and D) Western blot analysis (C) and quantitation (D) of Brg1 in cardiomyocyte and endothelial cells isolated from sham and TAC operated hearts. n = 3, P value: Student's t test. Error bar: SEM.
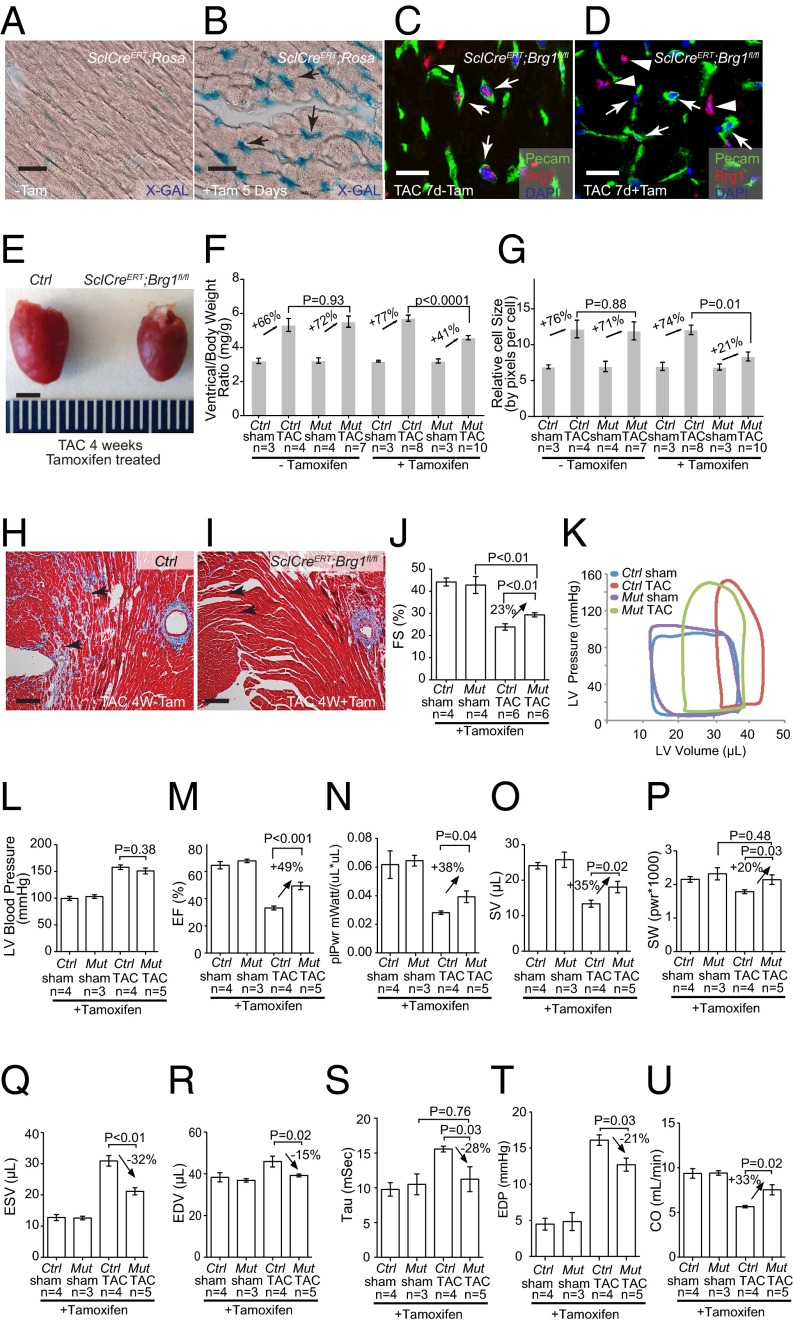
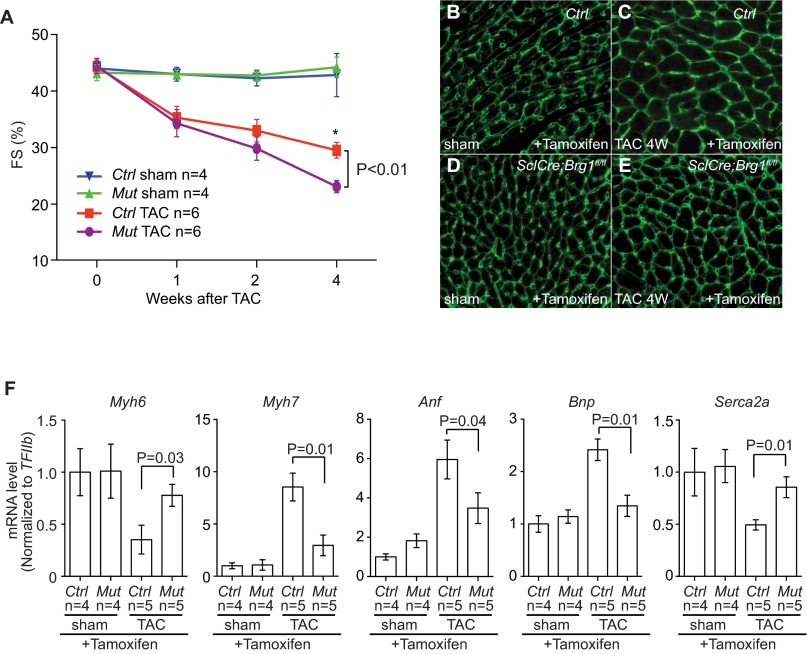
To test the role of endothelial Brg1 in stressed hearts, we used a tamoxifen-inducible SclCreERT mouse line (31) to induce endothelial Brg1 deletion in mice that carried floxed alleles of the Brg1 gene (Brg1fl) (32). Immunostaining showed that tamoxifen treatment for 5 d (0.1 mg per gram of body weight, oral gavage once every other day, three doses total) before the TAC surgery was sufficient to activate a β-galactosidase reporter (R26R) and to disrupt Brg1 expression in endothelial cells, but not cardiomyocytes, of TAC-stressed hearts (Fig. 2 A–D). We then used TAC to pressure-overload the heart and induce hypertrophy in littermate control (SclCreER;Brg1fl/+ or Brg1fl/fl) and mutant SclCreERT;Brg1fl/fl mice with or without tamoxifen treatment. Left ventricular fractional shortening (FS) changes were followed by echocardiography (Fig. S4A). Four weeks after TAC, the control mice developed larger hearts than those of SclCreER;Brg1fl/fl mice lacking endothelial Brg1 (Fig. 2E). Analysis of the cardiac mass (ventricle–body weight ratio) showed an ∼50% reduction of hypertrophy (from 77% to 41%) in SclCreERT;Brg1fl/fl mice (Fig. 2F). Cell size measurement by wheat germ agglutinin (WGA) staining revealed ∼70% reduction of cardiomyocyte size (from 74% to 21%) in SclCreERT;Brg1fl/fl mice (Fig. 2G and Fig. S4 B–E). There was also a dramatic reduction of interstitial fibrosis in the SclCreERT;Brg1fl/fl mice (Fig. 2 H and I). Within 4 wk after TAC, SclCreERT;Brg1fl/fl mice showed 23% improvement of left ventricular FS (P < 0.01; Fig. 2J and Fig. S4A).
Fig. 2.
Endothelial Brg1 is essential for stress-induced cardiac hypertrophy and dysfunction. (A and B) β-galactosidase (X-gal) staining (blue) of SclCreERT;R26R mouse hearts without (A) or with (B) 5 d of tamoxifen (Tam) treatment. Arrow, endothelial cells. (Scale bar, 10 μm.) (C and D) Coimmunostaining of Brg1 (red) and Pecam (green, labeling endothelial cells) in SclCreERT;Brg1fl/fl hearts 7 d after TAC without (C) or with (D) 5-d tamoxifen treatment. Blue, DAPI nuclear stain. Arrows, endothelial cell nuclei; arrowheads, myocardial cell nuclei. (Scale bars, 10 μm.) (E) Gross picture of hearts harvested 4 wk after sham or TAC operation in control and SclCreERT;Brg1fl/fl mice treated with tamoxifen. (Scale bar, 2 mm.) (F) Quantitation of ventricle–body weight ratio in control (Ctrl) and SclCreERT;Brg1fl/fl (Mut) mice 4 wk after sham or TAC operation. P value: Student's t test. Error bar: SEM. (G) Quantitation of cardiomyocyte size by wheat germ agglutinin (WGA) staining in control and SclCreERT;Brg1fl/fl mice 4 wk after sham or TAC operation. (H and I) Trichrome staining of cardiac fibrosis in control (H) and SclCreERT;Brg1fl/fl (I) mice 4 wk after TAC operation. Red, cardiomyocytes; blue, fibrosis. Arrows, interstitial space. (Scale bars, 50 μm.) (J) Echocardiographic measurement of fractional shortening (FS) of the left ventricle after 4 wk of TAC. (K) Representative left ventricular (LV) pressure–volume (PV) loops taken after cardiac catheterization of control (Ctrl) and SclCreERT; Brg1fl/fl (Mut) mice 4 wk after sham or TAC operation. (L–P) Quantitation of left ventricular systolic pressure (L), ejection fraction (EF; M), preload-adjusted maximal power (plPwr; N), stroke volume (SV; O), and stroke work (SW; P) 4 wk after sham or TAC operation. Ctrl, control mice; Mut, SclCreERT; Brg1fl/fl mice. (Q–U) Quantitation of end-systolic volume (ESV; Q), end-diastolic volume (EDV; R), Tau (S), end-diastolic pressure (EDP; T), and cardiac output (CO; U) 4 wk after sham or TAC operation. Ctrl, control mice; Mut, SclCreERT; Brg1fl/fl mice.
Fig. S4.
Lacking of endothelial Brg1 reduces heart functional decline after TAC. (A) Time course of left ventricular FS changes after sham/TAC operation in control and SclCreERT;Brg1fl/fl mice. P value: Student's t test. Error bar: SEM. (B–E) WGA immunostaining of control and SclCreERT;Brg1fl/fl hearts lacking endothelial Brg1 4 wk after sham or TAC operation. Original magnification: 200×. Green, WGA. (F) RT-qPCR quantitation of heart stress markers Myh6, Myh7, Anf, Bnp, and Serca2a in the heart ventricles 4 wk after sham/TAC operation in control and SclCreERT; Brg1fl/fl mice. P value: Student's t test. Error bar: SEM.
To further determine cardiac function, we inserted a catheter from the right carotid artery retrograde into the LV to measure its pressure and volume (Fig. 2K). The in vivo catheterization showed that TAC increased the peak LV systolic pressure from 100 to 150 mmHg (Fig. 2K), with a peak pressure overload of ∼50 mmHg. This LV pressure overload was comparable between the control and mutant hearts (Fig. 2L). The peripheral systolic pressure (right carotid artery) was identical to that of LV and had no difference between control and mutant mice. Endothelial Brg1 deletion greatly improved the function of TAC-stressed hearts. SclCreERT;Brg1fl/fl mice exhibited much better cardiac function 4 wk after TAC. Ejection fraction (EF) improved by 49% (P < 0.001) (Fig. 2M); preload-adjusted maximal power (plPwr) by 38% (P = 0.04) (Fig. 2N); stroke volume (SV) by 35% (P = 0.02) (Fig. 2O); and stroke work (SW) by 20% (P = 0.03) (Fig. 2P). Also, SclCreERT;Brg1fl/fl mice had less dilated hearts, with end-systolic volume (ESV) reduced by 32% (P < 0.01) (Fig. 2Q) and end-diastolic volume (EDV) reduced by 15% (P = 0.02) and normalized (Fig. 2R). Both the LV contractility and volume measurement indicate a major improvement in systolic function of the heart. Furthermore, SclCreERT;Brg1fl/fl hearts had greatly improved diastolic function. This result was evidenced by the reduction of isovolumic relaxation time constant tau by 42.3% (P = 0.01) (Fig. 2S) and end-diastolic pressure (EDP) by 21% (P = 0.03) (Fig. 2T). As a result of systolic and diastolic functional improvement, SclCreERT;Brg1fl/fl mice showed a 33% (P = 0.02) increase of cardiac output (CO) (Fig. 2U). Consistent with the functional improvement of TAC-operated SclCreERT;Brg1fl/fl mice, molecular markers Myh6 and Serca2a were significantly increased, whereas the stress markers Myh7, Anf, and Bnp were much reduced (Fig. S4F). This result is consistent with the resistance of SclCreERT;Brg1fl/fl to TAC-induced heart failure. Overall, endothelial Brg1-null mice had a 50–70% reduction of cardiac hypertrophy, minimal/absent interstitial fibrosis, and reduction of heart functional decline after TAC. These findings indicate that the Brg1 is activated by stress in cardiac endothelial cells to trigger hypertrophy.
Endothelial Brg1 Controls Ace/Ace2 Expression and Ang I/II Metabolism.
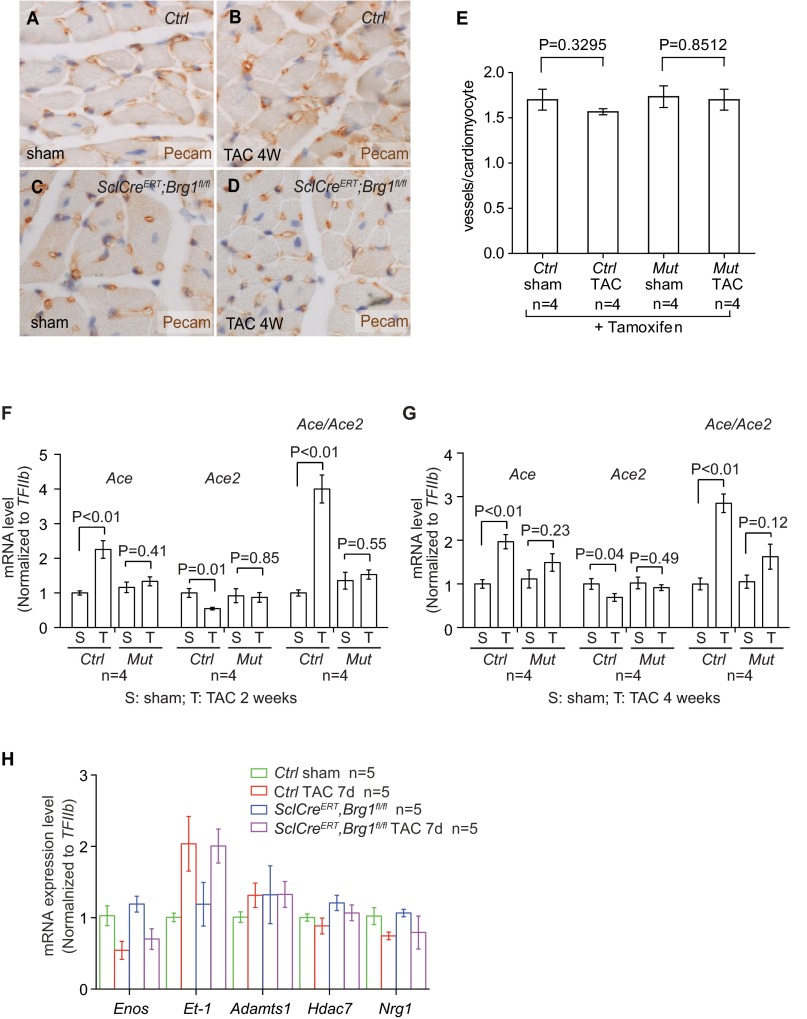
Given that defective angiogenesis might contribute to cardiac hypertrophy and failure (33), we examined cardiac vessel density to test whether endothelial Brg1 was essential for angiogenesis in stressed hearts. By Pecam staining, we found no difference in vascular density of control and SclCreERT;Brg1fl/fl hearts treated with tamoxifen and TAC (Fig. S5 A–E).
Fig. S5.
Endothelial Brg1 deletion reduces cardiomyocyte mass but has no effect on vascular density in the stressed hearts. (A–D) Pecam immunostaining of control and SclCre; Brg1fl/fl mice lacking endothelial Brg1 4 wk after sham or TAC operation. Original magnification: 200×. Brown, Pecam; blue, nuclear staining. (E) Quantitation of vascular density of control and SclCreERT;Brg1fl/fl hearts treated with tamoxifen and TAC. P value: Student's t test. Error bar: SEM. (F and G) Quantitation of Ace, Ace2, and Ace/Ace2 in control (Ctrl) and SclCreERT;Brg1fl/fl (Mut) hearts after 2 and 4 wk of sham or TAC operation. P value: Student's t test. Error bar: SEM. (H) RT-qPCR quantitation of eNos, Et-1, Adamts1, Hdac7, and Nrg1 in the heart ventricles of control and SclCreERT;Brg1fl/fl mice 7 d after sham or TAC procedure. n = 4 mice per group. P value: Student's t test. Error bar: SEM.
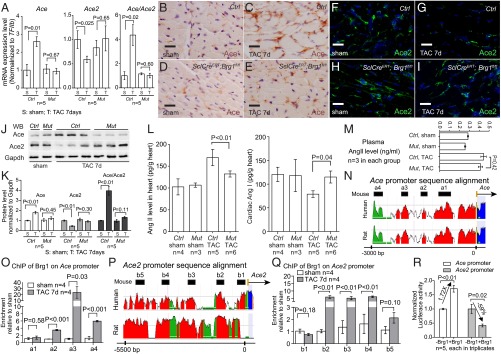
We then tested whether endothelial Brg1 controlled changes of Ace and Ace2 in stressed hearts. By RT-qPCR of heart ventricles, we examined the expression of eNos, Et1, Adamts1, Hdac7, Nrg1, Ace, and Ace2 in tamoxifen-treated control and SclCreERT;Brg1fl/fl hearts with or without TAC. Among these genes and after TAC, the stress-induced opposite changes of Ace and Ace2 were evident in the control mice, with TAC increasing Ace/Ace2 ratio by 4.3-fold (Fig. 3A). However, such Ace/Ace2 changes were eliminated in the TAC-stressed hearts of SclCreERT;Brg1fl/fl mice (Fig. 3A and Fig. S5 F and G), indicating that endothelial Brg1 is essential for Ace up-regulation and Ace2 down-regulation in stressed hearts. In contrast, the changes of other endothelial genes (eNos, Et1, Adamts1, Hdac7, and Nrg1) were not affected by endothelial Brg1 (Fig. S5H). These data suggest a degree of Brg1 specificity in control of the Ace/Ace2 switch. Consistently, immunostaining showed that Brg1 was required for the pathological switch of Ace and Ace2 proteins in the heart endothelium. TAC-induced Ace protein up-regulation and Ace2 down-regulation were essentially abolished in the SclCreERT;Brg1fl/fl hearts (Fig. 3 B–I). These findings were confirmed by Western blot quantitation of Ace and Ace2 in heart protein extracts from the control and mutant mice (Fig. 3 J and K). Furthermore, consistent with the Brg1-mediated control of the Ace/Ace2 ratio, the TAC-induced Ang I reduction and Ang II increase was present in the control hearts, but reversed in the mutant SclCreERT;Brg1fl/fl hearts (Fig. 3L). Also, despite the cardiac changes of angiotensin, Brg1 mutation caused no change of Ang II in the plasma (Fig. 3M). These findings are consistent with cardiac Ang I and II being primarily produced locally (11–14) and that such local angiotensin production is regulated by cardiac endothelial Brg1. Collectively, the results indicate that endothelial Brg1 responds to cardiac stress to activate Ace and repress Ace2 expression, triggering a pathological switch of Ace and Ace2 in stressed hearts.
Fig. 3.
Endothelial Brg1 controls Ace/Ace2 expression and Ang I/II metabolism in stressed hearts. (A) Quantitation of Ace, Ace2, and Ace/Ace2 in control (Ctrl) and SclCreERT;Brg1fl/fl (Mut) hearts after 7 d of sham or TAC operation. (B–E) Immunostaining of Ace (brown) in control (B and C) and SclCreERT;Brg1fl/fl (D and E) hearts 7 d after sham or TAC operation. (Scale bars, 10 μm.) (F–I) Immunostaining of Ace2 (green) in control (F and G) and SclCreERT;Brg1fl/fl (H and I) hearts 7 d after sham or TAC operation. (Scale bars, 10 μm.) (J and K) Western blot analysis (J) and quantitation (K) of Ace and Ace2 proteins in control (Ctrl) and SclCreERT; Brg1fl/fl (Mut) hearts 7 d after sham or TAC operation. P value: Student's t test. Error bar: SEM. (L and M) ELISA analysis of Ang I and II concentrations in the heart (L) and plasma (M) 4 wk after TAC. Ctrl, control; Mut, SclCreERT;Brg1fl/fl. P value: Student's t test. Error bar: SEM. (N) Sequence alignment of the Ace locus from mouse, human, and rat. Peak heights indicate degree of sequence homology. Black boxes (a1–a4) are regions of high sequence homology and were further analyzed by ChIP. Red, promoter elements; yellow, untranslated regions; green, transposons/simple repeats. (O) ChIP-qPCR analysis of Ace promoter using antibodies against Brg1 (J1 antibody) and hearts 7 d after sham or TAC operation. P value: Student's t test. Error bar: SEM. (P) Sequence alignment of Ace2 locus from mouse, human, and rat. Peak heights indicate degree of sequence homology. Black boxes (b1–b5) are regions of high sequence homology and were further analyzed by ChIP. (Q) ChIP-qPCR analysis of Ace2 promoter using antibodies against Brg1 (J1 antibody) and hearts 7 d after sham or TAC operation. P value: Student's t test. Error bar: SEM. (R) Luciferase reporter assays of the Ace (−2,983 to +174 bp) and Ace2 (−7,063 to +786 bp) proximal promoter in mouse cardiac endothelial cells. P value: Student's t test. Error bar: SEM.
Brg1 Binds to the Promoters of Ace and Ace2 to Regulate Their Expression.
To determine whether Brg1 directly regulated Ace and Ace2 expression in the stressed hearts, we first examined the binding of Brg1 to Ace and Ace2 promoters. With sequence alignment, we identified four regions (a1–a4) in the ∼3-Kb upstream region of the mouse Ace promoter that are evolutionarily conserved in mouse, rat, and human (Fig. 3N). Chromatin immunoprecipitation (ChIP) assay using anti-Brg1 antibody (34) showed that, in TAC-operated hearts Brg1 was highly enriched in three of a1–a4 regions (a2, a3, and a4), compared with the sham-operated hearts (Fig. 3O). Additionally, we analyzed the 5.5-kb upstream region of the mouse Ace2 promoter, which contained five highly conserved regions among different species (b1–b5 in Fig. 3P). ChIP analysis of the TAC-stressed heart ventricles showed that Brg1 was highly enriched in three of the b1–b5 regions (b2, b3, and b4), compared with the sham-operated hearts (Fig. 3Q). These ChIP studies of stressed hearts indicate that Brg1, once activated by stress, binds to evolutionarily conserved regions of Ace and Ace2 proximal promoters.
We next tested the transcriptional activity of Brg1 on Ace and Ace2 promoters. We cloned Ace upstream promoter (−2,983 to +174 bp) and Ace2 upstream promoter (−7,063 to +786 bp) into the episomal reporter pREP4 that allows promoter chromatinization in mammalian cells (24, 35). We then transfected the reporter and Brg1-expressing plasmids into mouse cardiac (coronary) endothelial cells for reporter assays (36). In these cells Brg1 caused 1.7-fold increase in Ace promoter activity and 59% reduction in Ace2 promoter activity (Fig. 3R). These reporter studies, combined with the ChIP results, indicate that Brg1 activates the Ace promoter and represses the Ace2 promoter. This finding provides a molecular explanation for the antithetical changes of Ace and Ace2 in stressed hearts.
Endothelial FoxM1 Is Required for Stress-Induced Cardiac Hypertrophy and Pathological Ace/Ace2 Switch.
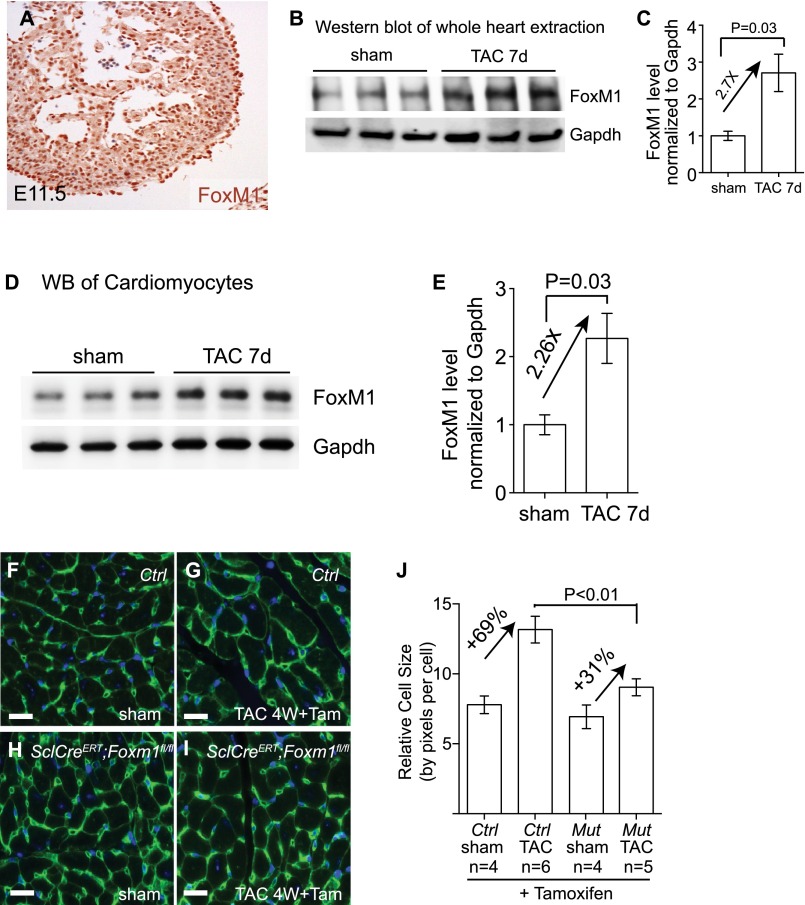
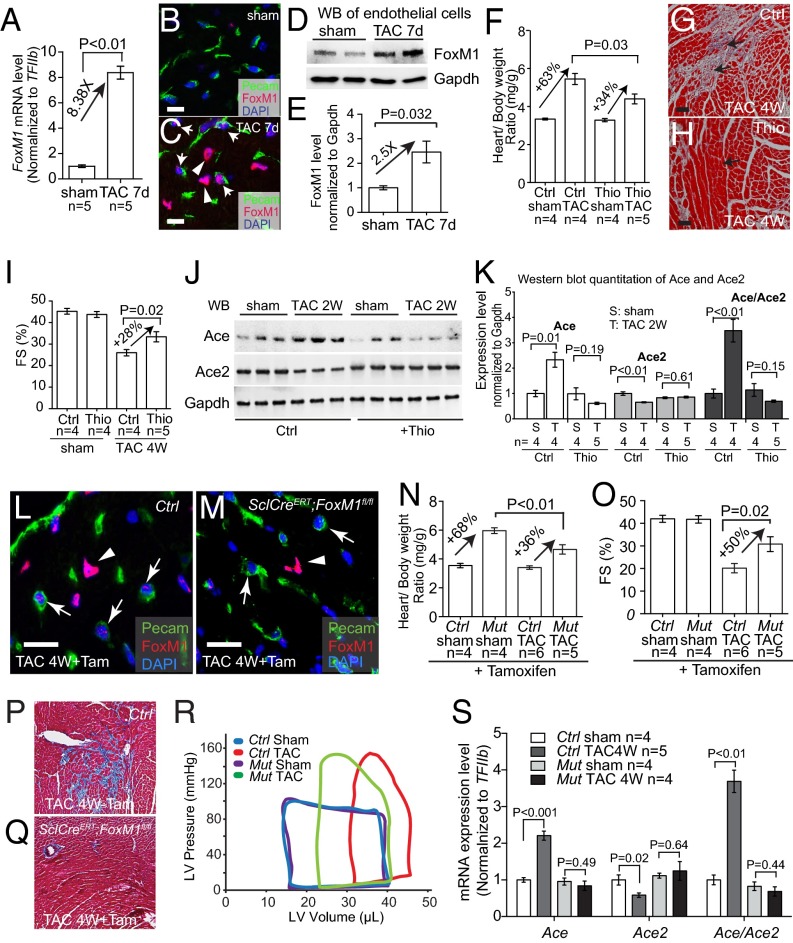
We next hypothesized that FoxM1 (a forkhead box transcription factor) was the transcription factor that worked with Brg1 to antithetically regulate Ace and Ace2 expression and contribute to cardiac hypertrophy. This hypothesis was based on the following observations. First, FoxM1 regulates the expression of genes associated with pathological hypertrophy (37, 38). Second, the FoxM1 protein contains both transactivation and repressor domains, capable of functioning as a transcription activator or repressor (25–27). Third, we found that FoxM1 had expression dynamics in fetal, normal adult, and stressed adult hearts, similar to that of Brg1. RT-qPCR and immunostaining of heart ventricles showed that FoxM1 was abundant in fetal hearts (Fig. S6A), but its expression was down-regulated in normal adult hearts. In contrast, in TAC-stressed hearts, FoxM1 mRNA increased by 8.4-fold (Fig. 4A), and the proteins were up-regulated in the nuclei of both cardiomyocytes and endothelial cells of stressed hearts (Fig. 4 B and C and Fig. S6 B and C). Western blot analysis of isolated cardiac endothelial cells and cardiomyocytes showed that FoxM1 protein was up-regulated by 2.5- and 2.3-fold after stress (Fig. 4 D and E and Fig. S6 D and E).
Fig. S6.
Endothelial FoxM1 deletion reduces cardiomyocyte mass after TAC operation. (A) Immunostaining of FoxM1 in embryonic day (E) 11.5 hearts. Original magnification: 200×. Brown, FoxM1; blue, DAPI nuclear staining. (B and C) Western blot analysis (B) and quantitation (C) of FoxM1 protein extracted from mouse hearts 7 d after sham or TAC operation. P value: Student's t test. Error bar: SEM. (D and E) Western blot analysis (D) and quantitation (E) of FoxM1 protein in cardiomyocytes isolated from mice hearts 7 d after sham or TAC operation. P value: Student's t test. Error bar: SEM. (F–J) Quantitation (J) of cardiomyocyte size by WGA immunostaining (F–I) in control and SclCreERT;FoxM1fl/fl hearts treated with tamoxifen 4 wk after sham or TAC operation. Green, WGA. P value: Student's t test. Error bar: SEM. (Scale bars, 10 μm.)
Fig. 4.
Endothelial FoxM1 is essential for cardiac hypertrophy and pathological switch of Ace/Ace2. (A) Quantitation of FoxM1 mRNA in mouse hearts after 7 d after sham or TAC operation. (B and C) Coimmunostaining of FoxM1 (red) and Pecam (green) in mouse hearts 7 d after sham or TAC operation. Arrows, endothelial cell nuclei; arrowheads, myocardial cell nuclei. (Scale bars, 10 μm.) (D and E) Western blot analysis (D) and quantitation (E) of FoxM1 proteins in cardiac endothelial cells isolated from mouse hearts 7 d after sham or TAC operation. P value: Student's t test. Error bar: SEM. (F) Quantitation of ventricle–body weight ratio of mice treated with DMSO (Ctrl) and thiostrepton (Thio) after 4 wk of sham or TAC operation. (G and H) Trichrome staining of cardiac fibrosis in mice treated with DMSO (Ctrl) and thiostrepton (Thio) after 4 wk sham or TAC operation. Red, cardiomyocytes; blue, fibrosis. Arrow, interstitial space. (Scale bars, 20 μm.) (I) Echocardiographic measurement of FS of the LV after 4 wk (4W) of TAC. Ctrl, DMSO; Thio, thiostrepton. (J and K) Western blot analysis (J) and quantitation (K) of Ace and Ace2 proteins in the heart of DMSO-treated (Ctrl) and thiostrepton-treated (Thio) mice 2 wk (2W) after sham or TAC operation. (L and M) Coimmunostaining of FoxM1 (red) and Pecam (green) in control (Ctrl) and SclCreERT;FoxM1fl/fl mouse hearts 4 wk after TAC operation with tamoxifen treatment. Arrows, endothelial cell nuclei; arrowheads, myocardial cell nuclei. (Scale bars, 10 μm.) (N) Quantitation of ventricle–body weight ratio in control (Ctrl) and SclCreERT;FoxM1fl/fl (Mut) mice 4 wk after sham or TAC operation. P value: Student's t test. Error bar: SEM. (O) Echocardiographic measurement of FS of the left ventricle of control (Ctrl) and SclCreERT;FoxM1fl/fl (Mut) hearts after 4 wk of TAC. P value: Student's t test. Error bar: SEM. (P and Q) Trichrome staining of cardiac fibrosis in control (P) and SclCreERT;FoxM1fl/fl (Q) mice 4 wk after sham or TAC operation. Original magnification: 200×. Red, cardiomyocytes; blue, fibrosis. (R) Representative LV pressure–volume (PV) loops taken after cardiac catheterization of control (Ctrl) and SclCreERT; FoxM1fl/fl (Mut) mice 4 wk after sham or TAC operation. (S) Quantitation of Ace, Ace2, and Ace/Ace2 mRNA in control (Ctrl) and SclCreERT;FoxM1fl/fl (Mut) heart ventricles after sham or TAC operation. P value: Student's t test. Error bar: SEM.
We then tested the necessity of FoxM1 activation for cardiac hypertrophy by using the FoxM1 inhibitor thiostrepton (39, 40) in TAC-stressed hearts. Within 4 wk after TAC, the control mice injected with the vehicle (DMSO) developed severe cardiac hypertrophy with increased ventricle–body weight ratio, interstitial fibrosis, and cardiac dysfunction with reduced left ventricular FS (Fig. 4 F–I). In contrast, thiostrepton-treated mice exhibited mild cardiac hypertrophy (Fig. 4F), mild interstitial fibrosis (Fig. 4 G and H), and a lesser degree of cardiac dysfunction (Fig. 4I). There was a ∼50% reduction of hypertrophy and 28% improvement of FS, comparable to the improvement observed in endothelial Brg1-null hearts (Fig. 2 F and J). In addition, Western blot analysis of heart ventricles showed that TAC-induced Ace and Ace2 switches were abolished when FoxM1 was inhibited by thiostrepton, with the Ace/Ace2 ratio reduced by 6.5-fold in stressed hearts (Fig. 4 J and K). This finding suggests that FoxM1 is required for the pathological switch of Ace and Ace2.
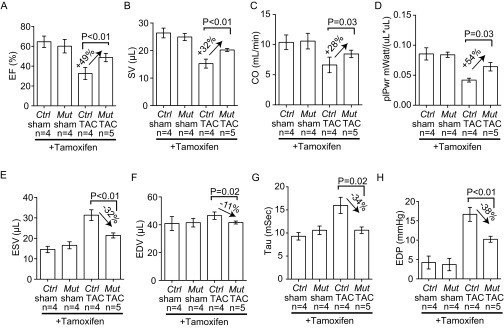
To test the genetic role of FoxM1 in endothelial cells, we crossed SclCreERT mice (31) with mice that carried floxed FoxM1 alleles (41) to generate the SclCreERT;FoxM1fl/fl mouse line. This line enabled tamoxifen-induced deletion of FoxM1 in endothelial cells. In tamoxifen-treated, TAC-operated SclCreERT;FoxM1fl/fl hearts, FoxM1 protein was absent in endothelial cells, but not in cardiomyocytes (Fig. 4 L and M), indicating an endothelial knockout of FoxM1. Within four weeks after TAC, SclCreERT;FoxM1fl/fl mice displayed ∼50% reduction of cardiac mass (ventricular/body weight ratio reduced from 68% to 36%, P < 0.01) (Fig. 4N) and ∼55% reduction of cardiomyocyte size measured by WGA staining (from 69% to 31%, P < 0.01) (Fig. S6 F–J). Also, SclCreERT;FoxM1fl/fl mice showed ∼50% improvement of left ventricular FS by echocardiography (P = 0.02) (Fig. 4O) and a dramatic reduction of stress-induced interstitial fibrosis (Fig. 4 P and Q). A complete characterization of heart function by cardiac catheterization further validated that endothelial FoxM1 deletion greatly improved the function of TAC-stressed hearts (Fig. 4R). Endothelial FoxM1 deletion improved EF of the stressed hearts by 49%, SV by 32%, CO by 28%, and plPwr by 54% (Fig. S7 A–D). The left ventricular ESV was reduced by 32% (P < 0.01), and end-diastolic volume was reduced by 11% (P = 0.03). The stress-induced changes of diastolic relaxation (Tau) were reduced by 34% (Fig. S7 E–G), and the left ventricular filling pressure (EDP) was reduced by 38% (P < 0.01) (Fig. S7H). These findings indicate that endothelial FoxM1 disruption prevents the development of cardiac dysfunction in stressed hearts. Furthermore, the TAC-induced pathological Ace/Ace2 switch was abolished with Ace/Ace2 ratio normalized in those hearts lacking endothelial FoxM1 (Fig. 4S). These findings indicate that activation of endothelial FoxM1 expression is essential for stress-induced cardiac hypertrophy and the pathological Ace/Ace2 switch.
Fig. S7.
Endothelial FoxM1 is essential for stress-induced cardiac hypertrophy and dysfunction. Cardiac function PV-loop analysis of control (Ctrl) and SclCreERT; Foxm1fl/fl (Mut) mice after 4 wk of sham or TAC operation is shown. Quantitation of EF (A), SV (B), CO (C), plPwr (D), ESV (E), EDV (F), Tau (G), and EDP (H) is shown. P value: Student's t test. Error bar: SEM.
Brg1 Cooperates with FoxM1 in the Endothelium to Control Cardiac Ace and Ace2 Expression.
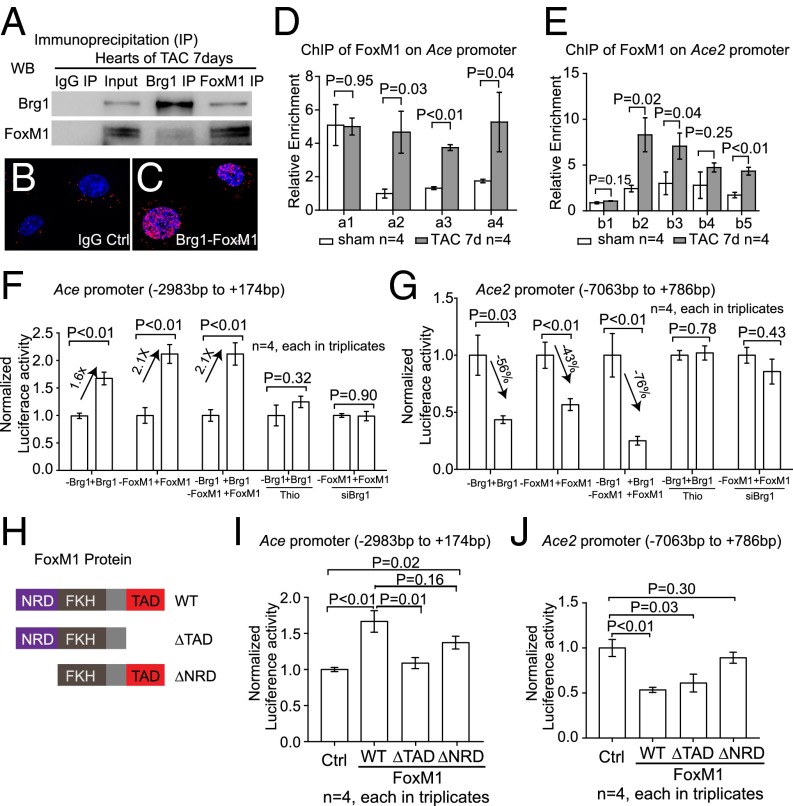
Given that both FoxM1 and Brg1 could regulate Ace/Ace2 switch in stressed cardiac endothelium, we tested whether there was a direct physical interaction between these two proteins. We found that Brg1 coimmunoprecipitated with FoxM1 in stressed heart ventricles (Fig. 5A). Proximity ligation (Duolink) assay (42, 43) further confirmed that Brg1 and FoxM1 formed a protein complex in the nuclei of mouse cardiac endothelial cells (Fig. 5 B and C). We then asked whether FoxM1, like Brg1, could bind to the promoters of Ace and Ace2 in stressed hearts. ChIP analysis showed that FoxM1 was highly enriched in the conserved regions of Ace and Ace2 proximal promoters of TAC-stressed hearts relative to the sham-operated hearts (Fig. 5 D and E). The binding pattern of FoxM1 was broadly similar to that of Brg1 (Fig. 3 M and O). Given that DNA elements could be looped and brought together by proteins bound to them and that Brg1 and FoxM1 formed a physical complex in stressed endothelial cells, the results suggest that Brg1 and FoxM1 form a protein complex on Ace and Ace2 promoters to orchestrate regulatory DNA elements to control Ace and Ace2 expression. Furthermore, luciferase reporter assays conducted in mouse cardiac endothelial cells showed that FoxM1, like Brg1, was capable of activating Ace and repressing Ace2 promoter activities (Fig. 5 F and G). Inhibition of FoxM1 by thiostrepton (39, 40) eliminated Brg1-mediated Ace promoter activation and Ace2 promoter repression (Fig. 5 F and G). Likewise, knockdown of Brg1 abolished FoxM1’s activity on Ace activation and Ace2 repression (Fig. 5 F and G). These results indicate that Brg1 and FoxM1 are mutually dependent for the regulation of Ace and Ace2 promoters. To determine whether FoxM1 used different effector domains to control Ace and Ace2 expression, we constructed two mutated FoxM1 proteins: FoxM1 with C-terminal transactivation domain truncated (∆TAD) and FoxM1 with N-terminal repression domain truncated (∆NRD) (refs. 44 and 45 and Fig. 5H). Without the transactivation domain, the FoxM1–∆TAD mutants failed to activate the Ace promoter, but maintained its repression of the Ace2 promoter (Fig. 5 I and J). Conversely, without the repressor domain, FoxM1–∆NRD mutants failed to repress the Ace2 promoter, but preserved effects on Ace promoter activation (Fig. 5 I and J). These results indicate that FoxM1 functions through different transcriptional effector domains for the regulation of Ace and Ace2 promoters, providing a molecular explanation for the antithetical effects of the Brg1–FoxM1 complex on Ace and Ace2. Overall, the ChIP and reporter analyses, combined with the stress-induced formation of the Brg1–FoxM1 complex, suggest that Brg1 and FoxM1 cooperate to regulate the pathological switch of Ace and Ace2 in the stressed heart.
Fig. 5.
Brg1 cooperates with FoxM1 to control Ace and Ace2 expression. (A) Coimmunoprecipitation of Brg1 with FoxM1 in heart ventricles after 7 d of TAC. (B and C) Proximity ligation assay of Brg1–FoxM1 complex in nuclei of cultured mouse cardiac endothelial cells. Original magnification: 400×. Red, proximity ligation signal; blue, DAPI. IgG control, cells treated with IgG but not primary anti-Brg1 or -FoxM1 antibodies. (D and E) ChIP-qPCR analysis of Ace (D) and Ace2 (E) promoters using antibodies against FoxM1 7 d after sham or TAC operation. (F and G) Luciferase reporter assays of the Ace (−2,983 to +174 bp) (F) and Ace2 (−7,063 to +786 bp) (G) proximal promoters (described in Fig. 3 L and N) in mouse cardiac endothelial cells. siBrg1, siRNA-mediated knockdown of Brg1; Thio, thiostrepton. P value: Student's t test. Error bar: SEM. (H) Schematic illustration of FoxM1 repression, transactivation domains, and mutations. NRD, N-terminal repression domain; TAD, C-terminal transactivation domain. (I and J) Luciferase reporter assays of the Ace (I) and Ace2 (J) promoters with FoxM1 mutants in mouse cardiac endothelial cells. P value: Student's t test. Error bar: SEM.
Implications for Human Cardiac Hypertrophy.
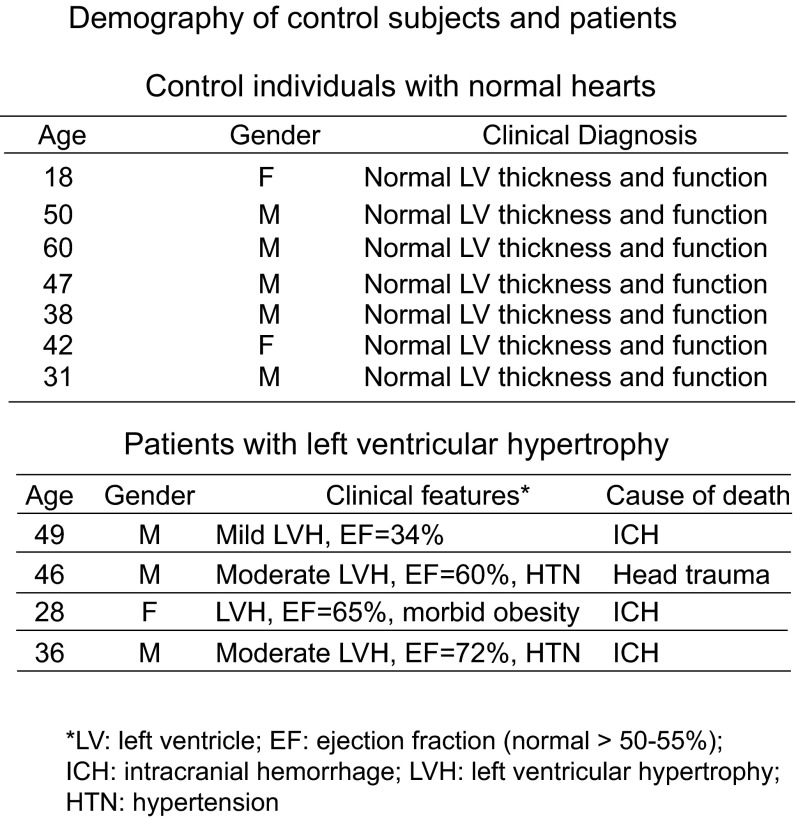
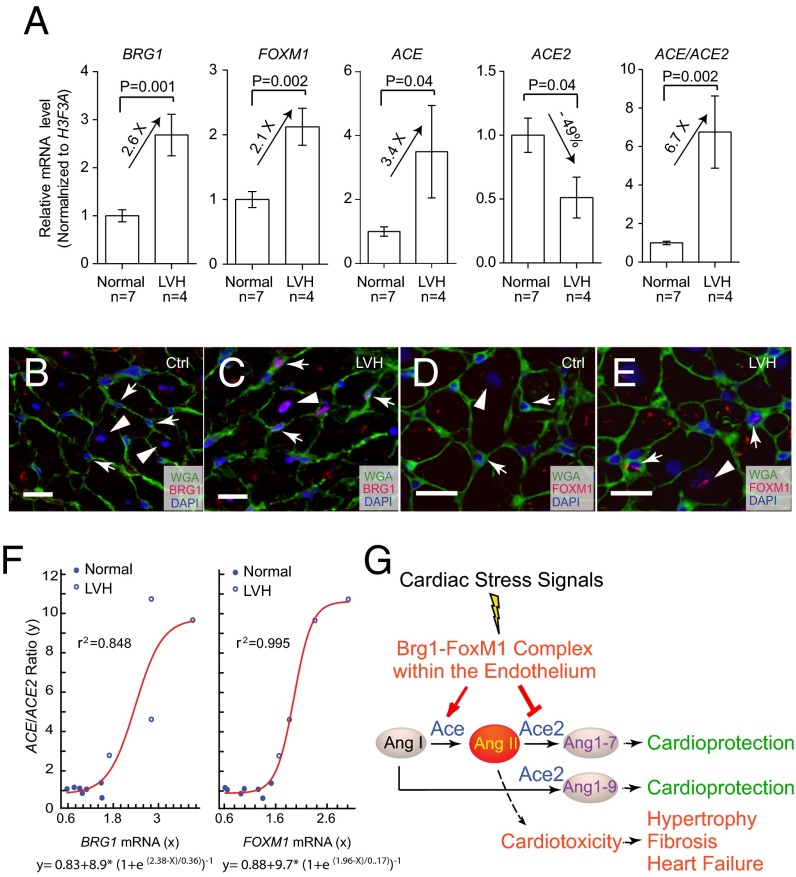
To investigate whether BRG1 and FOXM1 were also activated in the endothelial cells of human hypertrophic hearts, we studied patients with left ventricular hypertrophy (LVH). The tissue samples were obtained from donor hearts that were considered unsuitable for transplantation because of the lack of timely recipients or mismatched surgical cut (Fig. S8). RT-qPCR of mRNA showed that the human hypertrophic hearts had a 2.1- and 2.6-fold increase of FOXM1 and BRG1, a 3.4-fold increase of ACE, and a 51% reduction of ACE2, with the ACE/ACE2 ratio increased by 6.7-fold (Fig. 6A). Like in mice, BRG1 and FOXM1 were up-regulated in both cardiomyocytes and endothelial cells of the hypertrophic hearts (Fig. 6 B–E). Nonlinear regression analysis showed that the level of BRG1 and FOXM1 correlated strongly with the level of pathological switch of ACE/ACE2 in human hearts (Fig. 6F; r2 = 0.848 and 0.995, respectively). The human tissue studies thus suggest an evolutionarily conserved mechanism underlying myopathy of mouse and human hearts.
Fig. S8.
Demographic information of control subjects and patients whose left ventricular tissues were studied. The left ventricular wall thickness and function was assessed by echocardiography or cardiac magnetic resonance imaging. EF, normal > 50–55%. HTN, hypertension; ICH, intracranial hemorrhage.
Fig. 6.
BRG1 and FOXM1 activation in human cardiomyopathy. (A) qPCR analysis of BRG1, FOXM1, ACE, and ACE2 expression and ACE/ACE2 ratio in normal (n = 7) and LVH hearts (n = 4). (B and C) Coimmunostaining of BRG1 (red) and WGA (green) in normal and LVH hearts. Arrow, endothelial cell; arrowhead, myocardial cell. (Scale bars, 10 μm.) (D and E) Coimmunostaining of FOXM1 (red) and WGA (green) in heart of normal and LVH subjects. Arrow, endothelial cell; arrowhead, myocardial cell. (Scale bars, 10 μm.) (F) Correlation of BRG1 and FOXM1 mRNA level (x axis) with ACE/ACE2 mRNA ratio (y axis), n = 11. Red, nonlinear regression curve. e, the base of natural logarithm (∼2.718). Equations of Boltzmann sigmoidal model are listed under the graphs. (G) Working model of how cardiac endothelial Brg1–FoxM1 complex mediates stress signals to control Ace/Ace2 and angiotensin production in the heart.
Discussion
Controlling Ace/Ace2 expression is critical for maintaining cardiac function, given that an increase of Ace or reduction of Ace2 is sufficient to cause cardiomyopathy (20, 23, 46). We showed that the Ace and Ace2 amount in the heart is controlled primarily at the transcription level and identified an endothelial chromatin complex composed of Brg1 and FoxM1 that transcriptionally activates Ace and represses Ace2 in response to cardiac stress (Fig. 6G). This finding provides new molecular insights into endothelial–myocardial interaction under pathological conditions. The requirement of the Brg1–FoxM1 complex for pathological hypertrophy has important implications for heart failure therapy. In stressed hearts, a chemical inhibitor of FoxM1 is effective in reversing Ace/Ace2 and preventing cardiac hypertrophy and dysfunction. It is therefore pharmacologically feasible to inhibit Ace and activate Ace2 simultaneously to improve heart function. Given that there has not been an effective chemical activator of Ace2, likely because of the difficulty of generating protein activators of any kind, chemical inhibition of Brg1–FoxM1 complex reveals a new avenue for pharmacologically targeting Ace and Ace2 genes simultaneously to reverse Ace/Ace2 ratio in failing hearts. Besides Ace/Ace2 regulation, broader functions of the endothelial Brg1–FoxM1 complex will require a future genome-wide approach to determine other downstream targets of this complex in stressed hearts.
At the molecular level, Brg1 and FoxM1 interactions show a molecular mechanism for Brg1 and FoxM1 in gene regulation. The FoxM1 protein contains both a transactivating and a repressor domain for transcription regulation. How such dual transcription activity of FoxM1 is controlled remains unclear. We showed here that Brg1 is essential for FoxM1 to repress Ace and to activate Ace2. However, it remains unknown how Brg1 enables FoxM1 to use its repressor domain on one promoter (such as Ace) and its transactivating domain on another promoter (such as Ace2). Such promoter-specific activity of FoxM1 may be caused by how Brg1 rearranges the chromatin–DNA for FoxM1 to bind or by other unidentified factors in the promoter that differentially expose or enable the FoxM1 transactivating or repressor domain. Given that FoxM1 is required for embryogenesis and is a proto-oncogene up-regulated in many human cancers, including lung, breast, and colon cancers (25–27, 47), future studies to define the molecular details of the differential domain use of FoxM1 may have important implications in organ development, cardiac hypertrophy, and many other diseases.
Materials and Methods
Brg1fl/fl, FoxM1fl/fl, and SclCreERT [endothelial-SCL-Cre-ERT (31)] mice have been described (32, 48–50). Littermate CD1 male mice were purchased from Charles River (strain code 022). Animal use protocol was reviewed and approved by Indiana University Institutional Animal Care and Use Committee (IACUC). Only de-identified human tissues were used for studies. The human tissues were processed for RT-qPCR. The use of human tissues is in compliance with the regulation of Sanford/Burnham Medical Research Institute and Indiana University. Informed consent procedures were in compliance with Institutional Biosafety Committee protocol (no. 1784) approved by Indiana University. Curve modeling was performed with the Levenburg–Marquardt nonlinear regression method and XLfit software.
Additional materials and procedures are provided in SI Materials and Methods.
SI Materials and Methods
Mice.
Brg1fl/fl, FoxM1fl/fl, and SclCreERT (endothelial-SCL-Cre-ERT) mice were described (32, 48–50). Approximately equal numbers of male and female mice were studied. Littermate CD1 male mice were purchased from Charles River (strain code 022) for TAC analysis. The use of mice for studies was in compliance with the regulations of Indiana University and the National Institutes of Health.
Histology, Trichrome Staining, and Immunostaining.
Histology, trichrome staining, and immunostaining were performed as described (34, 51). The following primary antibodies were used for immunostaining: anti-Brg1 (J1) (24), anti-FoxM1 (catalog no. H00002305-M02, Abnova), anti-PECAM (catalog no. 553370, BD Pharmingen), anti-ACE (catalog no. ab75762, Abcam), and anti-ACE2 (catalog no. ab59351, Abcam). Immunofluorescence was conducted by using reagents from the M.O.M. kit (Vector Laboratories) or Alexa dye-conjugated secondary antibodies (Invitrogen). Hoechst was used for nuclear counterstaining of nuclei. Immunohistochemistry was conducted by using biotinylated secondary antibodies (anti-rabbit IgG; 1/250; Jackson ImmunoResearch and BD Biosciences), VECTASTAIN Elite ABC Kit (PK-6200, Vector Laboratories), and DAB developing reagents (DAKO). Imaging was performed by using a confocal microscope (Leica) or widefield microscopes (Leica).
Mouse Cardiac Endothelial Cell Isolation and Sorting.
We injected 200 μL of heparin (100 IU per mouse) i.p. 10 min before anesthesia to prevent coagulation of blood in the coronary arteries. We anesthetized the mouse with isoflurane, followed by removal and cannulation. The heart was perfused with calcium-free perfusion buffer (113 mM NaCl, 4.7 mM KCl, 0.6 mM KH2PO4, 0.6 mM Na2HPO4, 1.2 mM MgSO4, 10 mM Na-Hepes, 12 mM NaHCO3, 10 mM KHCO3, and 5.5 mM glucose, pH 7.0) at a flow rate of 3 mL/min for ∼4–5 min until the effluents became clear, followed by a switch to digestion buffer (300 U/mL, type II collagenase, dissolve in perfusion buffer). Digestion was stopped when the heart became slightly pale and flaccid. The next step was to remove the aorta, atria, and great vessels with fine surgical scissors. The ventricle was gently teased into 10–12 small pieces with two fine-tip forceps. The heart pieces were gently pipetted up and down and then transferred to a 15-mL polypropylene conical tube. The tube was gently shaken on a shaker at 37 °C. Next was centrifugation for 3 min at 70 × g to separate out cardiac myocytes and small nonmyocyte cells, such as endothelial cells and fibroblasts. Supernatant was collected and proceeded for endothelial cell sorting with CD31 MicroBeads (catalog no. 130-097-418, Miltenyi Biotec) following kit protocol.
Drug Treatment.
For thiostrepton studies, mice were injected i.p. daily with vehicle (DMSO) or thiostrepton (10 mg/kg) (catalog no. T8902, Sigma-Aldrich). Sham or TAC procedures were performed 24 h after the first injection. After 14 d of sham or TAC operation, mice were evaluated by echocardiography for heart function, and heart tissues were harvested for cardiac hypertrophy and fibrosis studies. To induce Brg1 or FoxM1 deletion, mice were treated with tamoxifen (Sigma-Aldrich, T5648) (in corn oil at 20 mg/mL) at the dose of 0.1 mg per gram of body weight through oral gavage every 48 h for a total of three doses over a 5-d period before the sham/TAC procedure.
TAC.
Surgeries were adapted from ref. 52 and were performed on adult mice of 8–10 wk of age and between 20 and 25 g of weight. Mice were anesthetized with isoflurane (2–3%; inhalation) in an induction chamber and then intubated with a 20-gauge i.v. catheter and ventilated with a mouse ventilator (Minivent; Harvard Apparatus, Inc.). Anesthesia was maintained with inhaled isoflurane (1–2%). A longitudinal 5-mm incision of the skin was made with scissors at midline of sternum. The chest cavity was opened by a small incision at the level of the second intercostal space 2–3 mm from the left sternal border. The chest retractor was gently inserted to spread the wound to 4–5 mm in width. The transverse portion of the aorta was bluntly dissected with curved forceps. Then, 6–0 silk was brought underneath the transverse aorta between the left common carotid artery and the brachiocephalic trunk. One 26-gauge needle was placed directly above and parallel to the aorta. A loop was then tied around the aorta and needle and secured with a second knot. The needle was immediately removed to create a lumen with a fixed stenotic diameter. The chest cavity was closed by 6–0 silk suture. Sham-operated mice underwent similar surgical procedures, including isolation of the aorta and looping of aorta, but without tying of the suture. The pressure load caused by TAC was verified by the pressure gradient across the aortic constriction measured by echocardiography. Only mice with a peak pressure gradient >30 mmHg were analyzed for cardiac hypertrophy and gene expression.
Echocardiography.
The echocardiographer was blinded to the genotypes, surgical, or pharmacological treatment of the mice tested. Transthoracic ultrasonography with a GE Vivid 9 μL trasound platform (GE Health Care) and a 13-MHz transducer was used to measure aortic pressure gradient and left ventricular function. Echocardiography was performed on control, SclCreERT;Brg1fl/fl, and SclCreERT;FoxM1fl/fl mice, as well as on mice treated with DMSO and Thiostrepton (T8902; Sigma) at 8–12 wk of age. To minimize the confounding influence of different heart rates on aortic pressure gradient and left ventricular function, the flow of isoflurane (inhalational) was adjusted to anesthetize the mice while maintaining their heart rates at 450–550 beats per minute. The peak aortic pressure gradient was measured by continuous-wave Doppler across the aortic constriction. The left ventricular function was assessed by the M-mode scanning of the left ventricular chamber, standardized by 2D, short-axis views of the left ventricle at the midpapillary muscle level. The FS of the LV was defined as 100% × (1 – end systolic/end diastolic diameter), representing the relative change of left ventricular diameters during the cardiac cycle. The mean FS of the LV was determined by the average of FS measurement of the left ventricular contraction over five beats. P values were calculated by the Student t test. Error bars indicate SE of mean.
In Vivo Catheterization.
The trachea was exposed by a midline incision from the base of the throat to just above the clavicle. The mice were intubated with a piece of polyethylene-90 tube. After the tube was secured in place by using a 6–0 silk suture, 100% oxygen was gently blown across the opening. Mice receiving ventilation were placed on a warmed (37 °C) pad. The right carotid artery was then isolated. Care was taken to prevent damage to the vagal nerve. Mice were lightly anesthetized with isoflurane, maintaining their heart rates at 450–550 beats per minute. A 1.2-F Pressure-Volume Catheter (FTE-1212B-4518; Scisense, Inc.) was inserted into the right carotid artery and then advanced into the LV. The transducer was securely tied into place, after it was advanced to the ventricular chamber as evidenced by a change in pressure curves. Hemodynamic parameters were then recorded in close-chest mode. The parameters included left ventricular systolic pressure, EF, plPwr, SV, SW, ESV, EDV, Tau, EDP, and CO.
Morphometric Analysis of Cardiomyocytes.
Paraffin sections of the heart were immunostained with fluorescein isothiocyanate-conjugated WGA antibody (F49; Biomeda) that highlighted the cell membrane of cardiomyocytes. Cellular areas outlined by WGA were determined by the number of pixels enclosed by using the NIS element software (Nikon). Approximately 250 cardiomyocytes of the papillary muscle at the mid-left ventricular cavity were measured to determine the size distribution. P values were calculated by the Student t test. Error bars indicate SEM.
RT-qPCR.
RT-qPCR analyses were performed as described (24, 34). The following primers (sequence listed below) were used. RT-qPCR was performed by using SYBR green master mix (Bio-Rad) with an Eppendorf realplex, and the primer sets were tested to be quantitative. Threshold cycles and melting curve measurements were performed with software. P values were calculated by the Student t test. Error bars indicate SE of mean.
PCR Primers for RT-qPCR of mRNA.
Mouse Ace-F (GCTTCCTCTTTCTGCTGCTCTG),
Mouse Ace-R (TGCCCTCTATGGTAATGTTGGT),
Mouse Ace2-F (ATGTGGTAGGAGCAAGGAATAT),
Mouse Ace2-R (GGGTGAGGTGACAAAGAAGTAG),
Mouse FoxM1-F (TCTCCTTCTGGACCATTCACC),
Mouse FoxM1-R (CTCAGGATTGGGTCGTTTCT),
Mouse eNos-F (CAGGCTGCAGTCCTTTGATC),
Mouse eNos-R (TACGGAGCAGCAAATCCAC),
Mouse Et-1-F (ACTTCTGCCACCTGGACATC),
Mouse Et-1-R (GTCTTTCAAGGAACGCTTGG),
Mouse Adamts1-F (CTGGGCAAGAAATCTGATGA),
Mouse Adamts1-R (AAGCACAGCCACAGTTTATCA),
Mouse Hdac7-F (CTCCGCAGCCAGTGTGAGTGTC),
Mouse Hdac7-R (GAGTGGGTTCGTGCCGTAGAGG),
Mouse Nrg1-F (AGGAACTCAGCCACAAACAACA),
Mouse Nrg1-R (AAGCACTCGCCTCCATTCACAC),
Mouse TFIIb-F (CTCTGTGGCGGCAGCAGCTATTT),
Mouse TFIIb-R (CGAGGGTAGATCAGTCTGTAGGA),
Human FOXM1-F (AGCAGCGACAGGTTAAGGTTGA),
Human FOXM1-R (TGCTGTTGATGGCGAATTGTAT),
Human BRG1-F (AGTGCTGCTGTTCTGCCAAAT),
Human BRG1-R (GGCTCGTTGAAGGTTTTCAG),
Human ACE-F (CCTGGGACTTCTACAACGGCAA),
Human ACE-R (AGACACTGAGAGGGCTAGCACG),
Human ACE2-F (AAGCCGAAGACCTGTTCTATCA),
Human ACE2-R (GACCATTTGTCCCCAGCATTAT),
Human H3F3A-F (AAAACAGATCTGCGCTTCCA),
Human H3F3A-R (TTGTTACACGTTTGGCATGG).
ChIP-qPCR.
Hearts from adult mice were used for ChIP assay as described (24). Chromatin was sonicated to generate average fragment sizes of 200–600 bp and then immunoprecipitated by using anti-BRG1 J1 antibody (24, 53), anti-FoxM1 antibody (catalog no. H00002305-M02, Abnova), or normal control IgG. Isolation and purification of immunoprecipitated and input DNA were done according to the manufacturer’s protocol (Magna ChIP Protein G Magnetic Beads, catalog no. 16-662, Millipore), and RT-qPCR analysis of immunoprecipitated DNA was performed. ChIP-qPCR signals of individual ChIP reaction were standardized to their own input RT-qPCR signals and normalized to IgG ChIP signals. PCR primers (listed below) were designed to amplify the promoter regions of mouse Ace and mouse Ace2.
PCR Primers for ChIP-qPCR.
Mouse ChIP-Ace-a1-F (TCCCATGTGAACTCCATCACC),
Mouse ChIP-Ace-a1-R (TCTAAATGCATCAGCAGCCT),
Mouse ChIP-Ace-a2-F (ATCCAACGTGCAATACAAGTGT),
Mouse ChIP-Ace-a2-R (CGATCTATGAAGAACCAAACCC),
Mouse ChIP-Ace-a3-F (TAGGGTGGCTTATACATTTACA),
Mouse ChIP-Ace-a3-R (TATGAGGGTTCTTTTAGGGTGA),
Mouse ChIP-Ace-a4-F (AGAATGAGCCAGCAGAAAGCAC),
Mouse ChIP-Ace-a4-R (GAGGCCCAACTGTCTCTGAAGA),
Mouse ChIP-Ace2-b1-F (AGTGCCCAACCCAAGTTCAAA),
Mouse ChIP-Ace2-b1-R (CCCCGTGCGCCAAGATCCCAT),
Mouse ChIP-Ace2-b2-F (TTCATATTTCCACGATCCCAT),
Mouse ChIP-Ace-b2-R (CCTCTTTCCCTTTCACTTACC),
Mouse ChIP-Ace2-b3-F (TCAATGAAGAGTGAACCCAAA),
Mouse ChIP-Ace2-b3-R (GCTAAAAGTAGAAGGACCAGA),
Mouse ChIP-Ace2-b4-F (AATGTCCCTGAAGGATTGTCT),
Mouse ChIP-Ace2-b4-R (CATAATGAAAGTGGCAGTGTA),
Mouse ChIP-Ace2-b5-F (CAGGGAGACTTACAGTGGGTGA),
Mouse ChIP-Ace2-b5-R (ACGCCAAGGAGTTTTATTGCTA).
Western Blot Analysis.
The blots were reacted with antibodies of anti-Brg1 (H-10) (catalog no. sc-374197, Santa Cruz Biotechnology), anti-ACE (catalog no. ab75762, Abcam), anti-ACE2 (catalog no. ab59351, Abcam), and anti-GAPDH (catalog no. G9545, Sigma), followed by HRP-conjugated secondary antibodies (Jackson ImmunoResearch Laboratories) or IRDye secondary antibodies (LI-COR Biosciences). Chemiluminescence was detected with ECL Western blot detection kits (GE) with the LI-COR Odyssey imaging system.
Coimmunoprecipitation.
Adult mouse heart ventricles were minced and homogenized by cell extraction buffer (25 mM Hepes, pH 7.5, 25 mM KCl, 0.1% Nonidet P-40, 1 mM DTT, and protease inhibitor) to enrich nuclei. The nuclei were then washed and lysed by using nuclear lysis buffer (50 mM Hepes, pH 7.6, 50 mM KCl, 0.1 mM EDTA, 10% glycerol, 1 mM DTT, 0.3 M ammonium sulfate, protease inhibitors, and 1 mM PMSF). The lysates were precleared with Pierce Protein G Magnetic Beads (catalog no. PI88803, Pierce). Immunoprecipitation with antibodies and Western blotting were performed as described above and in ref. 24. A total of 2 µg of primary antibodies of anti-Brg1 (J1) (24), anti-FoxM1 (catalog no. H00002305-M02, Abnova), or normal control IgG, were used.
ELISA.
Peptide extraction from plasma and heart tissues was performed by using the Sep-Pak C18 cartridge (Millipore). Samples were evaporated to dryness and dissolved in RIA buffer (Phoenix Pharmaceuticals). AngI and AngII level were detected by an ELISA kit following the protocol (EK-002-01 and EK-002-12, Phoenix Pharmaceuticals). The immunoplate was read under the absorbance O.D. at 450 nm with a microplate reader (Synergy2 Bio-Tek).
Proximity Ligation (Duolink) Assay.
Proximity ligation assay was performed by using the Duolink In Situ Red Starter Kit mouse/rabbit (DUO92101, Sigma-Aldrich). Slides were deparaffinized in deionized water and incubated in blocking solution for 30 min at room temperature. Slides were incubated with primary anti-Brg1 (J1) and anti-FoxM1 (catalog no. H00002305-M02, Abnova) antibodies, the ligation buffer, and amplification solution. The slides were mounted in the mounting medium with DAPI and analyzed with a Leica confocal microscope.
Luciferase Reporter Assay.
The assay was performed as described (24). The reporter constructs were transfected into mouse cardiac endothelial cells (36) with Lipofectamine 2000 (Invitrogen) along with pREP7-RL (a transfection efficiency control) and with Brg1 or FoxM1 expression vector and associated empty vector control. The mouse cardiac endothelial cells were used because they were derived from cardiac endothelial cells on which the present studies were focused. Luciferase activity was measured and normalized to that of Renilla luciferase by using the Dual-Luciferase Reporter System (Promega).
Construction of Regression Curves and Derivation of Equations.
The regression curve, equation, and r2 for Fig. 6F were derived by using the Levenburg–Marquardt nonlinear regression method and statistics/curve modeling software (XLfit, 2005). Different curve models, including linear, polynomial, exponential/log, power series, hyperbolic, and sigmoidal curves, were tested.
Acknowledgments
We thank Dr. Peng-Sheng Chen for advice and support; Dr. Zhenhui Chen, Jian Tan, and Glen A. Schmeisser for technical support; and Dr. Vladimir V. Kalinichenko (Cincinnati Children's Hospital Medical Center) for providing the FoxM1fl/fl mice. C.-P.C. is the Charles Fisch Scholar of Cardiology and was supported by American Heart Association Established Investigator Award 12EIA8960018; National Institutes of Health (NIH) Grants HL118087 and HL121197; March of Dimes Foundation Grant 6-FY11-260; California Institute of Regenerative Medicine (CIRM) Grant RN2-00909; the Oak Foundation; the Stanford Heart Center Research Program; the Indiana University (IU) School of Medicine–IU Health Strategic Research Initiative; and the IU Physician-Scientist Initiative, endowed by Lilly Endowment, Inc. C.S. was supported by an NIH fellowship. H.-S.V.C. was supported by CIRM Grants RB2-01512 and RB4-06276; and NIH Grant HL105194. J.Y. was supported by the Dr. Charles Fisch Cardiovascular Research Award, endowed by Dr. Suzanne B. Knoebel of the Krannert Institute of Cardiology.
Footnotes
The authors declare no conflict of interest.
This article is a PNAS Direct Submission.
This article contains supporting information online at www.pnas.org/lookup/suppl/doi:10.1073/pnas.1525078113/-/DCSupplemental.
References
- 1.Mozaffarian D, et al. American Heart Association Statistics Committee and Stroke Statistics Subcommittee Heart disease and stroke statistics—2015 update: A report from the American Heart Association. Circulation. 2015;131(4):e29–e322. doi: 10.1161/CIR.0000000000000152. [DOI] [PubMed] [Google Scholar]
- 2.Canetti M, et al. Evaluation of myocardial blood flow reserve in patients with chronic congestive heart failure due to idiopathic dilated cardiomyopathy. Am J Cardiol. 2003;92(10):1246–1249. doi: 10.1016/j.amjcard.2003.08.002. [DOI] [PubMed] [Google Scholar]
- 3.Dini FL, et al. Coronary flow reserve in idiopathic dilated cardiomyopathy: Relation with left ventricular wall stress, natriuretic peptides, and endothelial dysfunction. J Am Soc Echocardiogr. 2009;22(4):354–360. doi: 10.1016/j.echo.2009.01.013. [DOI] [PubMed] [Google Scholar]
- 4.Bitar F, et al. Variable response of conductance and resistance coronary arteries to endothelial stimulation in patients with heart failure due to nonischemic dilated cardiomyopathy. J Cardiovasc Pharmacol Ther. 2006;11(3):197–202. doi: 10.1177/1074248406292574. [DOI] [PubMed] [Google Scholar]
- 5.Mathier MA, et al. Coronary endothelial dysfunction in patients with acute-onset idiopathic dilated cardiomyopathy. J Am Coll Cardiol. 1998;32(1):216–224. doi: 10.1016/s0735-1097(98)00209-5. [DOI] [PubMed] [Google Scholar]
- 6.Elesber AA, et al. Coronary endothelial dysfunction and hyperlipidemia are independently associated with diastolic dysfunction in humans. Am Heart J. 2007;153(6):1081–1087. doi: 10.1016/j.ahj.2007.03.007. [DOI] [PubMed] [Google Scholar]
- 7.Shantsila E, Wrigley BJ, Blann AD, Gill PS, Lip GY. A contemporary view on endothelial function in heart failure. Eur J Heart Fail. 2012;14(8):873–881. doi: 10.1093/eurjhf/hfs066. [DOI] [PubMed] [Google Scholar]
- 8.Paul M, Poyan Mehr A, Kreutz R. Physiology of local renin-angiotensin systems. Physiol Rev. 2006;86(3):747–803. doi: 10.1152/physrev.00036.2005. [DOI] [PubMed] [Google Scholar]
- 9.Lindpaintner K, et al. Intracardiac generation of angiotensin and its physiologic role. Circulation. 1988;77(6 Pt 2):I18–I23. [PubMed] [Google Scholar]
- 10.Danser AH, et al. Cardiac renin and angiotensins. Uptake from plasma versus in situ synthesis. Hypertension. 1994;24(1):37–48. doi: 10.1161/01.hyp.24.1.37. [DOI] [PubMed] [Google Scholar]
- 11.Dell’Italia LJ, et al. Compartmentalization of angiotensin II generation in the dog heart. Evidence for independent mechanisms in intravascular and interstitial spaces. J Clin Invest. 1997;100(2):253–258. doi: 10.1172/JCI119529. [DOI] [PMC free article] [PubMed] [Google Scholar]
- 12.Heller LJ, Opsahl JA, Wernsing SE, Saxena R, Katz SA. Myocardial and plasma renin-angiotensinogen dynamics during pressure-induced cardiac hypertrophy. Am J Physiol. 1998;274(3 Pt 2):R849–R856. doi: 10.1152/ajpregu.1998.274.3.R849. [DOI] [PubMed] [Google Scholar]
- 13.van Kats JP, et al. Angiotensin production by the heart: A quantitative study in pigs with the use of radiolabeled angiotensin infusions. Circulation. 1998;98(1):73–81. doi: 10.1161/01.cir.98.1.73. [DOI] [PubMed] [Google Scholar]
- 14.de Lannoy LM, et al. Renin-angiotensin system components in the interstitial fluid of the isolated perfused rat heart. Local production of angiotensin I. Hypertension. 1997;29(6):1240–1251. doi: 10.1161/01.hyp.29.6.1240. [DOI] [PubMed] [Google Scholar]
- 15.Falkenhahn M, et al. Cellular distribution of angiotensin-converting enzyme after myocardial infarction. Hypertension. 1995;25(2):219–226. doi: 10.1161/01.hyp.25.2.219. [DOI] [PubMed] [Google Scholar]
- 16.Vickers C, et al. Hydrolysis of biological peptides by human angiotensin-converting enzyme-related carboxypeptidase. J Biol Chem. 2002;277(17):14838–14843. doi: 10.1074/jbc.M200581200. [DOI] [PubMed] [Google Scholar]
- 17.Ocaranza MP, et al. Angiotensin-(1-9) regulates cardiac hypertrophy in vivo and in vitro. J Hypertens. 2010;28(5):1054–1064. doi: 10.1097/hjh.0b013e328335d291. [DOI] [PubMed] [Google Scholar]
- 18.Loot AE, et al. Angiotensin-(1-7) attenuates the development of heart failure after myocardial infarction in rats. Circulation. 2002;105(13):1548–1550. doi: 10.1161/01.cir.0000013847.07035.b9. [DOI] [PubMed] [Google Scholar]
- 19.Silva GJ, et al. ACE gene dosage modulates pressure-induced cardiac hypertrophy in mice and men. Physiol Genomics. 2006;27(3):237–244. doi: 10.1152/physiolgenomics.00023.2006. [DOI] [PubMed] [Google Scholar]
- 20. Zhong J, et al. (2010) Angiotensin-converting enzyme 2 suppresses pathological hypertrophy, myocardial fibrosis, and cardiac dysfunction. Circulation 122(7):717–728. [DOI] [PubMed]
- 21.Epelman S, et al. Detection of soluble angiotensin-converting enzyme 2 in heart failure: Insights into the endogenous counter-regulatory pathway of the renin-angiotensin-aldosterone system. J Am Coll Cardiol. 2008;52(9):750–754. doi: 10.1016/j.jacc.2008.02.088. [DOI] [PMC free article] [PubMed] [Google Scholar]
- 22.Mehta PK, Griendling KK. Angiotensin II cell signaling: Physiological and pathological effects in the cardiovascular system. Am J Physiol Cell Physiol. 2007;292(1):C82–C97. doi: 10.1152/ajpcell.00287.2006. [DOI] [PubMed] [Google Scholar]
- 23.Crackower MA, et al. Angiotensin-converting enzyme 2 is an essential regulator of heart function. Nature. 2002;417(6891):822–828. doi: 10.1038/nature00786. [DOI] [PubMed] [Google Scholar]
- 24.Hang CT, et al. Chromatin regulation by Brg1 underlies heart muscle development and disease. Nature. 2010;466(7302):62–67. doi: 10.1038/nature09130. [DOI] [PMC free article] [PubMed] [Google Scholar]
- 25.Kalin TV, Ustiyan V, Kalinichenko VV. Multiple faces of FoxM1 transcription factor: lessons from transgenic mouse models. Cell Cycle. 2011;10(3):396–405. doi: 10.4161/cc.10.3.14709. [DOI] [PMC free article] [PubMed] [Google Scholar]
- 26.Bella L, Zona S, Nestal de Moraes G, Lam EW. FOXM1: A key oncofoetal transcription factor in health and disease. Semin Cancer Biol. 2014;29:32–39. doi: 10.1016/j.semcancer.2014.07.008. [DOI] [PubMed] [Google Scholar]
- 27.Wierstra I. The transcription factor FOXM1 (Forkhead box M1): Proliferation-specific expression, transcription factor function, target genes, mouse models, and normal biological roles. Adv Cancer Res. 2013;118:97–398. doi: 10.1016/B978-0-12-407173-5.00004-2. [DOI] [PubMed] [Google Scholar]
- 28.Han P, et al. A long noncoding RNA protects the heart from pathological hypertrophy. Nature. 2014;514(7520):102–106. doi: 10.1038/nature13596. [DOI] [PMC free article] [PubMed] [Google Scholar]
- 29.Brutsaert DL. Cardiac endothelial-myocardial signaling: Its role in cardiac growth, contractile performance, and rhythmicity. Physiol Rev. 2003;83(1):59–115. doi: 10.1152/physrev.00017.2002. [DOI] [PubMed] [Google Scholar]
- 30.Dong QG, et al. A general strategy for isolation of endothelial cells from murine tissues. Characterization of two endothelial cell lines from the murine lung and subcutaneous sponge implants. Arterioscler Thromb Vasc Biol. 1997;17(8):1599–1604. doi: 10.1161/01.atv.17.8.1599. [DOI] [PubMed] [Google Scholar]
- 31.Göthert JR, et al. Genetically tagging endothelial cells in vivo: Bone marrow-derived cells do not contribute to tumor endothelium. Blood. 2004;104(6):1769–1777. doi: 10.1182/blood-2003-11-3952. [DOI] [PubMed] [Google Scholar]
- 32.Sumi-Ichinose C, Ichinose H, Metzger D, Chambon P. SNF2beta-BRG1 is essential for the viability of F9 murine embryonal carcinoma cells. Mol Cell Biol. 1997;17(10):5976–5986. doi: 10.1128/mcb.17.10.5976. [DOI] [PMC free article] [PubMed] [Google Scholar]
- 33.Sano M, et al. p53-induced inhibition of Hif-1 causes cardiac dysfunction during pressure overload. Nature. 2007;446(7134):444–448. doi: 10.1038/nature05602. [DOI] [PubMed] [Google Scholar]
- 34.Stankunas K, et al. Endocardial Brg1 represses ADAMTS1 to maintain the microenvironment for myocardial morphogenesis. Dev Cell. 2008;14(2):298–311. doi: 10.1016/j.devcel.2007.11.018. [DOI] [PMC free article] [PubMed] [Google Scholar]
- 35.Liu R, et al. Regulation of CSF1 promoter by the SWI/SNF-like BAF complex. Cell. 2001;106(3):309–318. doi: 10.1016/s0092-8674(01)00446-9. [DOI] [PubMed] [Google Scholar]
- 36.Barbieri SS, Weksler BB. Tobacco smoke cooperates with interleukin-1beta to alter beta-catenin trafficking in vascular endothelium resulting in increased permeability and induction of cyclooxygenase-2 expression in vitro and in vivo. FASEB J. 2007;21(8):1831–1843. doi: 10.1096/fj.06-7557com. [DOI] [PubMed] [Google Scholar]
- 37.Hannenhalli S, et al. Transcriptional genomics associates FOX transcription factors with human heart failure. Circulation. 2006;114(12):1269–1276. doi: 10.1161/CIRCULATIONAHA.106.632430. [DOI] [PubMed] [Google Scholar]
- 38.Song HK, Hong SE, Kim T, Kim H. Deep RNA sequencing reveals novel cardiac transcriptomic signatures for physiological and pathological hypertrophy. PLoS One. 2012;7(4):e35552. doi: 10.1371/journal.pone.0035552. [DOI] [PMC free article] [PubMed] [Google Scholar]
- 39.Bhat UG, Halasi M, Gartel AL. Thiazole antibiotics target FoxM1 and induce apoptosis in human cancer cells. PLoS One. 2009;4(5):e5592. doi: 10.1371/journal.pone.0005592. [DOI] [PMC free article] [PubMed] [Google Scholar]
- 40.Hegde NS, Sanders DA, Rodriguez R, Balasubramanian S. The transcription factor FOXM1 is a cellular target of the natural product thiostrepton. Nat Chem. 2011;3(9):725–731. doi: 10.1038/nchem.1114. [DOI] [PubMed] [Google Scholar]
- 41.Krupczak-Hollis K, et al. The mouse Forkhead Box m1 transcription factor is essential for hepatoblast mitosis and development of intrahepatic bile ducts and vessels during liver morphogenesis. Dev Biol. 2004;276(1):74–88. doi: 10.1016/j.ydbio.2004.08.022. [DOI] [PubMed] [Google Scholar]
- 42.Söderberg O, et al. Direct observation of individual endogenous protein complexes in situ by proximity ligation. Nat Methods. 2006;3(12):995–1000. doi: 10.1038/nmeth947. [DOI] [PubMed] [Google Scholar]
- 43.Fredriksson S, et al. Protein detection using proximity-dependent DNA ligation assays. Nat Biotechnol. 2002;20(5):473–477. doi: 10.1038/nbt0502-473. [DOI] [PubMed] [Google Scholar]
- 44.Fu Z, et al. Plk1-dependent phosphorylation of FoxM1 regulates a transcriptional programme required for mitotic progression. Nat Cell Biol. 2008;10(9):1076–1082. doi: 10.1038/ncb1767. [DOI] [PMC free article] [PubMed] [Google Scholar]
- 45.Park HJ, et al. An N-terminal inhibitory domain modulates activity of FoxM1 during cell cycle. Oncogene. 2008;27(12):1696–1704. doi: 10.1038/sj.onc.1210814. [DOI] [PMC free article] [PubMed] [Google Scholar]
- 46.Yusuf S, et al. The Heart Outcomes Prevention Evaluation Study Investigators Effects of an angiotensin-converting-enzyme inhibitor, ramipril, on cardiovascular events in high-risk patients. N Engl J Med. 2000;342(3):145–153. doi: 10.1056/NEJM200001203420301. [DOI] [PubMed] [Google Scholar]
- 47.Radhakrishnan SK, Gartel AL. FOXM1: The Achilles' heel of cancer? Nat Rev Cancer. 2008;8(3):c1; author reply c2. doi: 10.1038/nrc2223-c1. [DOI] [PubMed] [Google Scholar]
- 48.Tachibana M, Nozaki M, Takeda N, Shinkai Y. Functional dynamics of H3K9 methylation during meiotic prophase progression. EMBO J. 2007;26(14):3346–3359. doi: 10.1038/sj.emboj.7601767. [DOI] [PMC free article] [PubMed] [Google Scholar]
- 49.Thomas LR, et al. Functional analysis of histone methyltransferase g9a in B and T lymphocytes. J Immunol. 2008;181(1):485–493. doi: 10.4049/jimmunol.181.1.485. [DOI] [PMC free article] [PubMed] [Google Scholar]
- 50.Wu B, et al. Inducible cardiomyocyte-specific gene disruption directed by the rat Tnnt2 promoter in the mouse. Genesis. 2010;48(1):63–72. doi: 10.1002/dvg.20573. [DOI] [PMC free article] [PubMed] [Google Scholar]
- 51.Chang CP, et al. A field of myocardial-endocardial NFAT signaling underlies heart valve morphogenesis. Cell. 2004;118(5):649–663. doi: 10.1016/j.cell.2004.08.010. [DOI] [PubMed] [Google Scholar]
- 52.Trivedi CM, et al. Hdac2 regulates the cardiac hypertrophic response by modulating Gsk3 beta activity. Nat Med. 2007;13(3):324–331. doi: 10.1038/nm1552. [DOI] [PubMed] [Google Scholar]
- 53.Khavari PA, Peterson CL, Tamkun JW, Mendel DB, Crabtree GR. BRG1 contains a conserved domain of the SWI2/SNF2 family necessary for normal mitotic growth and transcription. Nature. 1993;366(6451):170–174. doi: 10.1038/366170a0. [DOI] [PubMed] [Google Scholar]


