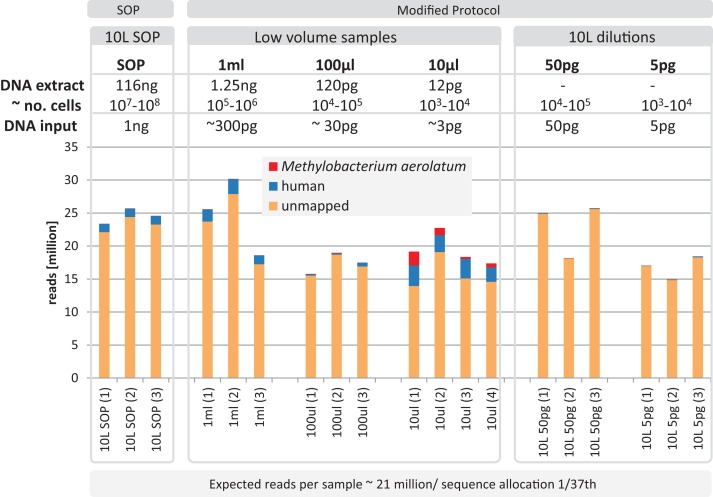
Figure 5. Yield and quality assessment of marine samples.
Reads are color coded based on the reference they aligned to, including the known contaminant Methylobacterium aerolatum (red) and the human genome (blue). The remaining reads are shown as unmapped (orange). The amount of DNA extracted with the modified extraction protocol is given as total DNA in 20 µl elution buffer (DNA extract). Number of cells (∼no. cells) was calculated based on an average DNA content of 1–10 fg per cell. The amount of input DNA for library preparation was measured for the SOP and the 1 ml libraries, and was estimated for the 100 and 10 µl samples based on the 1 ml sample measurements. The bar above the figure indicates when the standard protocol (SOP) or our modified protocol was used to create the libraries. All libraries were sequenced at an allocation of 1/37 of an Illumina NextSeq500 2×150 bp High Output v. 1 run. Sample replicate numbers are given in parenthesis.

