Figure 4.
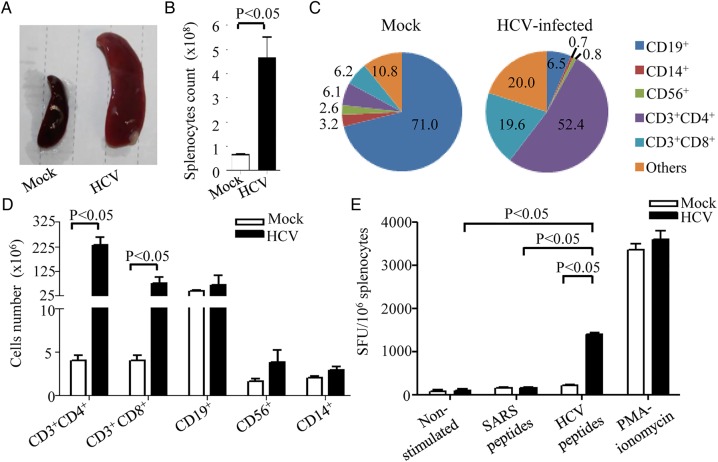
HCV infection induces HCV-specific human T cell response in HIL mice. HIL mice were mock-infected or HCV-infected for 9 weeks (n=4 mice per group). (A) Representative images showing gross appearance of spleen obtained from mock-infected or HCV-infected HIL mice. (B) The number of splenocytes in the mock-infected and HCV-infected HIL mice were counted and represented in the graph. (C) Graph representing the different immune cell populations in the splenocytes of mock-infected and HCV-infected HIL mice. Numbers are in percentages. (D) The total number of each immune cell types in mock-infected and HCV-infected HIL mice is represented in the graph. (E) Spleen mononuclear cells (MNCs) were isolated and 1×10⁵ MNCs were used for stimulation with 16 20-mer HCV core peptides for 24 h for human interferon (IFN)γ ELISPOT assay. Representative ELISPOT results for non-stimulated (Ctrl), SARS peptides-stimulated and HCV peptides-stimulated MNCs from mock-infected and HCV-infected mice are shown. Phorbol myristate acetate (PMA)-ionomycin stimulated cells were used as positive control. The human IFNγ T cell responses from each group are shown as spots forming units per 106 MNCs. Data represent mean±SEM.

