Abstract
Perinatal hypoxic–ischemic brain injury results in neonatal hypoxic–ischemic encephalopathy and serious long-term neurodevelopmental sequelae. Magnetic resonance imaging (MRI) of the brain is an ideal and safe imaging modality for suspected hypoxic–ischemic injury. The pattern of injury depends on brain maturity at the time of insult, severity of hypotension, and duration of insult. Time of imaging after the insult influences the imaging findings. Mild to moderate hypoperfusion results in germinal matrix hemorrhages and periventricular leukomalacia in preterm neonates and parasagittal watershed territory infarcts in full-term neonates. Severe insult preferentially damages the deep gray matter in both term and preterm infants. However, associated frequent perirolandic injury is seen in term neonates. MRI is useful in establishing the clinical diagnosis, assessing the severity of injury, and thereby prognosticating the outcome. Familiarity with imaging spectrum and insight into factors affecting the injury will enlighten the radiologist to provide an appropriate diagnosis.
Key words: Cortical highlighting, germinal matrix hemorrhage, hypoxic ischemic encephalopathy, hypoxic ischemic injury, periventricular leukomalacia
Introduction
Insufficient cerebral blood flow (ischemia) and decreased oxygenation in the blood (hypoxia) lead to loss of normal cerebral autoregulation. This results in diffuse brain injury and thereby causes hypoxic–ischemic encephalopathy (HIE). The incidence of HIE is 2.5 per 1000 nonanomalous term live births[1] and approximately 7 per 1000 preterm births.[2] Despite improvements in perinatal care, hypoxic–ischemic injury (HII) results in 23% of world's neonatal deaths[3] and causes permanent neurological deficits in 25% of the affected term neonates.[4]
The clinical diagnosis of HIE is based on evidence of fetal distress, low umbilical cord pH of <7.1 (acidosis), a poor Apgar score (0–3) at 5 min, necessity for resuscitation, abnormal neurology (seizure, coma, hypotonia), and multiorgan dysfunction. Even when all the criteria for HIE are fulfilled, it may be due to a pre-existing neurological condition predisposing to an abnormal delivery and HII. Hence, screening for infection, metabolic disorders, and congenital malformations are always warranted.
Although ultrasonography (USG), computed tomography (CT) and magnetic resonance imaging (MRI) comprise the imaging armamentarium, MRI is the most sensitive and specific modality. Because of the cost advantage, portability, and availability, USG remains the first investigation of choice. USG is sensitive for the detection of hemorrhage, hydrocephalus, and cystic variant of periventricular leukomalacia (PVL), however, it is operator dependent. It is less sensitive to structural abnormalities in the cerebral convexity and brainstem. It is less reliable in PVL and cerebral edema.[5] CT is the least sensitive modality for the evaluation of HII because of poor parenchymal contrast resolution of neonatal brain. It also has the inherent disadvantage of radiation exposure.
Findings in HII are highly variable and depend on brain maturity, severity, and duration of asphyxia, as well as timing of imaging studies. Pattern of injury in preterm neonates (<37 weeks gestational age) is distinct from that of the full-term neonates (≥37 weeks gestational age). Treatment is primarily supportive and aims at limiting the extent of brain injury. The role of MRI is in excluding structural anomalies and mainly in assessing the extent and nature of injury. Thereby, it helps in prognosticating the outcome and planning neurodevelopmental therapy. In this pictorial essay, we intend to familiarize the readers with the different MRI patterns of HII and to provide a brief insight into the factors influencing the patterns of injury. An understanding on normal MRI appearances of neonatal brain is essential for appreciation of abnormal findings in perinatal HII.
Magnetic Resonance Imaging Technique, Protocol and Basics of Interpretation
A coil of an appropriate size, ideally a dedicated neonatal head coil, is used. As the diameter of the coil decreases, the signal-to-noise ratio (SNR) increases. The standard MR sequences used in an adult brain should be optimized for use in neonates. This is because of the higher water content and lower protein and lipid contents of neonatal brain. It is achieved by increasing the repetition time (TR) of both T1 and T2 weighted images (WI). Ideally for T1WI, the standard TR (400 ms) is increased to 800 ms, and for T2WI, the standard TR (4000 ms) is increased to 6500 ms.[6] This optimizes the SNR and gray-white differentiation of the images.
MRI images accompanying the essay was done in a 1.5-T scanner (Magnetom Vision, Siemens Medical Solutions, Erlangen and GE Signa HDxt, GE healthcare, United States). T1 and T2 WI in axial plane, T2WI in coronal and sagittal planes, Diffusion WI (DWI) in axial plane with apparent diffusion coefficient (ADC) map generation, gradient-echo T2* WI, and fluid-attenuated inversion recovery (FLAIR) in axial plane are the key protocol employed.
Axial T1WI is ideal for detecting myelination, ischemia, and subacute hemorrhage. Axial T2WI provides good contrast between gray and white matter and is useful in delineating white matter signal abnormalities. Gradient-echo T2* or susceptibility WI (SWI) is ideal for demonstrating hemorrhage and distinguishing it from ischemic gray matter lesions and astrogliosis.
DWI with ADC maps between 24 hours and 7 days of life is more sensitive for the detection of cytotoxic edema than conventional T1 or T2WI. The ischemic areas show restricted diffusion in this time period, which is manifested as bright signal on DWI and reduced signal intensity on ADC maps. DWI abnormalities generally peak 3–5 days after the insult and subsequently normalize despite the tissue injury. Early DWI is excellent for the detection of white matter injury. However, few (15%) of the basal ganglia and thalamic lesions show normal DWI because of the antenatal insult or delayed cell death.[6,7]
The FLAIR sequence is useful for perception of abnormally increased T2 consistent with glial tissue and cystic lesions. It is considered less useful in the neonatal period but becomes useful after that by utilizing the slightly different signal intensities between unmyelinated white matter and gliosis. Once myelination has occurred (after 8 months), the sequence is particularly useful for demonstrating periventricular and cortical gliosis.[8]
MR spectroscopy (MRS) performed at an intermediate echo time (TE) of 135–144 ms and a short TE of 35 ms, with region of interest placed at basal ganglia, is a recommended additional sequence in full-term neonates. MRS shows increased sensitivity and high specificity for HII in the first 24 hours than that of any other technique. MRS mainly relies on detecting lactate peak in term neonatal brains with HII in the first few days of life. Lactate peak is identified by characteristic doublet peak at 1.3 ppm on spectra obtained with short TE and inversion below the baseline on spectra obtained with intermediate TE. This feature distinguishes the lactate peak from the adjacent lipid peak at 0.9–1.3 ppm. Premature neonates usually show higher lactate and lower N-acetylaspartate (NAA) peaks. As the brain matures, lactate will diminish and NAA will increase. Therefore, it is not recommended in preterm infants. It warrants MRS to be interpreted always in consideration with gestational age. Increased lactate-to-creatinine and lactate-to-choline ratios and reduced absolute concentrations of NAA and choline in the basal ganglia of full-term neonates with asphyxia are predictive of worse neurologic outcome.[9] Lactate is a normal finding in cerebrospinal fluid (CSF), hence, care should be taken in selecting the voxel of interest for MRS to avoid CSF contamination. MRS should always be interpreted in tandem with conventional and diffusion weighted MRI.
HII to gray matter (deep gray matter and cortex) results in characteristic T1 hyperintensity and variable T2 signal intensity. White matter injury results in abnormal T1 hyperintensity without marked T2 hypointensity, denoting astrogliosis, and low T1 signal intensity, denoting cavitation or edema.[6] In general, DWI is most useful in the first week of life and conventional T1 and T2WI are most diagnostically useful from the second week onwards. The recommended timing for MRI is between 5 and 14 days from birth. Early neonatal imaging (before 5 days) may underestimate the injury, however, it is useful in taking decision on ventilated patients.[7]
Normal Magnetic Resonance Imaging Appearances of Neonatal Brain
Adult brain differs from neonatal brain in degrees of myelination. MR signal intensities of myelinated and unmyelinated white matter differ. Myelination appears as increased signal intensity on T1WI and reduced signal intensity on T2WI relative to the gray matter. Myelination starts in the second trimester and the child brain appears almost like an adult brain by 18 months of age.
Our interest is specifically confined to the posterior limb of internal capsule and to a lesser degree to the ventrolateral nucleus of the thalamus. Increased T1 signal intensity of myelination is seen in the posterior half of the posterior limb of the internal capsule in normal neonates after 37 weeks of gestational age. This should be seen at least for one-third of the length of the posterior limb of the internal capsule [Figure 1A–D]. This and the corresponding T2 hypointensity can be seen usually during the first 24 hours of life.
Figure 1 (A-D).
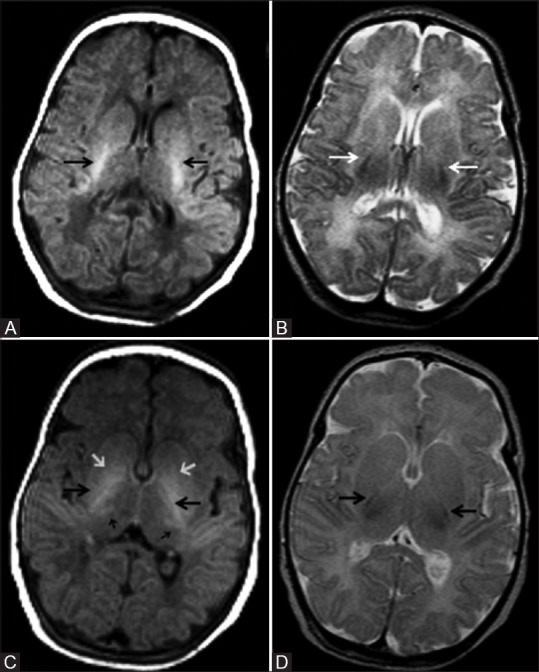
(A, B): Axial magnetic resonance imaging (MRI) of a 5 day old full-term neonate at the level of internal capsule. (A) T1 weighted image (WI) shows normally increased signal intensity (SI) of the posterior limb of internal capsule relative to the basal ganglia and thalamus; (B) Corresponding T2WI shows normal hypointense signal of the posterior limb of internal capsule; (C, D): Just above (A, B), shows normal variation in SI of the basal ganglia and thalamus. (C) T1WI shows normally increased SI of the posterior limb of internal capsule (large black arrow) and ventrolateral thalamus (small black arrows). Note the moderate hyperintensity of globus pallidus, which is a normal variation (small white arrow). (D) Corresponding T2WI shows normal hypointense signal of the posterior limb of internal capsule
In normal neonates, the thalamus may occasionally show subtly increased signal intensity confined to the posterolateral quadrant [Figure 1C and D]. This corresponds to myelination of the ventrolateral nucleus of the thalamus[10] (just medial to the terminal portion of the posterior limb of the internal capsule).
Patterns of Distribution of Brain Injury in Hypoxia–Ischemia
A hypoxic–ischemic event lasting for more than 10–15 min is required to induce brain damage in the perinatal period. Basal ganglia and thalami, internal capsule, cortex, subcortical and periventricular white matter, and medial temporal lobe are the usual sites of brain injury in HII. Although some overlapping features exist, four major patterns of brain injury are observed. These patterns are influenced by the combinations of the level of brain maturity at the time of the insult and the severity and duration of the hypoperfusion event.
Mild-to-moderate asphyxia pattern of brain injury (less severe)
During mild-to-moderate hypoperfusion, autoregulation causes redistribution of blood flow to the hypermetabolically active deep gray matter structures. This results in injury predominantly to the watershed zones of the cerebrum. The vascular supply of the brain changes with brain maturation. In the preterm brain, ventriculopetal penetrating arteries supply the periventricular regions by extending inward from the surface of the brain. Thus, hypoperfusion results in a periventricular border zone of white matter injury [Figure 2]. In the full-term, ventriculofugal vessels also extend into the brain from the lateral ventricles and the intervascular border zone moves peripherally to a parasagittal location [Figure 2]. This results in subcortical white matter and parasagittal cortical injury during hypotension.
Figure 2.
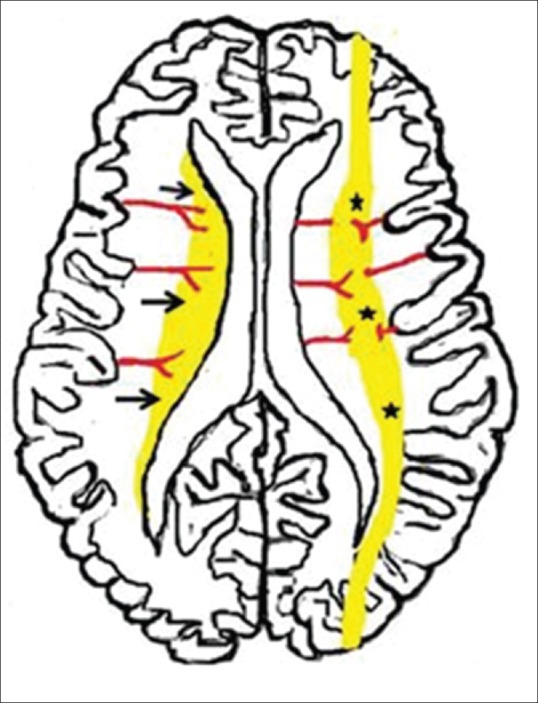
Diagrammatic illustration shows usual patterns of hypoxic ischemic brain injury in mild-to-moderate hypoperfusion in preterm and term neonates. Premature neonatal brain (left half) shows a periventricular border zone (black arrows) of white matter injury due to ventriculopetal vasculature The term neonate (right half) shows a more peripheral border zone (black stars) injury involving subcortical white matter and parasagittal cortex due to a ventriculofugal vasculature
Profound asphyxia pattern of brain injury (severe)
In severe hypoperfusion, there is loss of autoregulation. The vulnerable regions are the deep gray matter and the early or actively myelinating fibers with higher concentrations of neurotransmitter receptors. In preterm neonates, severe asphyxia preferentially injures the thalami, dorsal brainstem, and anterior vermis with relative sparing of the basal ganglia and cortex. Severe asphyxia in term neonates causes injury to the posterior putamina, ventrolateral thalami, hippocampi and dorsal brainstem, and occasionally the sensorimotor cortex.
Hypoxic–Ischemic Injury in Preterm Neonates
HII is more common in preterm neonates than in term neonates. Clinical diagnosis of early HII is difficult in very low birth weight preterm neonates. The prevalence of injury shows an inverse relationship to gestational age at birth.
Mild-to-moderate hypoxic–ischemic injury in preterm neonates
The spectrum of brain injury in this group is broad and include white matter injury of prematurity (WMIP), germinal matrix–intraventricular hemorrhage, or a combination of both.
White matter injury of prematurity or periventricular leukomalacia
The most recent concept is that PVL is caused by the selective vulnerability of cells of oligodendrocyte precursors to changes of HII and damage to subplate neurons.[11] Histological evolution of PVL follows a characteristic pattern-initially necrosis, often progressing to cavitation; then cysts collapse and result in gliosis and marked loss of the periventricular white matter.
DWI usually show early restriction of diffusion (after 24 hours of birth) and pseudonormalize within 5–7 days. Usually by 3–4 days, early white matter injury causes reactive astrogliosis and manifests as periventricular foci of T1 hyperintensity (without corresponding T2 hypointensity). Subsequently, by 6–7 days, these foci show mild reduction in T2 signal intensity. In contrast, hemorrhage manifests as T2 hypointensity initially itself and show blooming artifact on T2* or SWI. By 2–6 weeks of age, some cases show periventricular cysts (cystic variant) [Figures 3 and 4] and end-stage PVL occurs by 6 months of life.
Figure 3 (A-C).
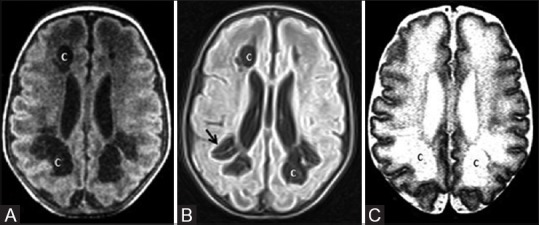
A 31-day-old infant born preterm (31 weeks) shows mild-to-moderate hypoxic ischemic injury. The infant also had refractory hypoglycemia. (A) Axial T1WI at the level of lateral ventricles shows frontal and posterior periventricular white matter cysts. (B) Axial fluid-attenuated inversion recovery (FLAIR) and T2WI at the level of lateral ventricles show frontal and posterior periventricular white matter cysts (C) with gliosis (arrows)
Figure 4 (A and B).
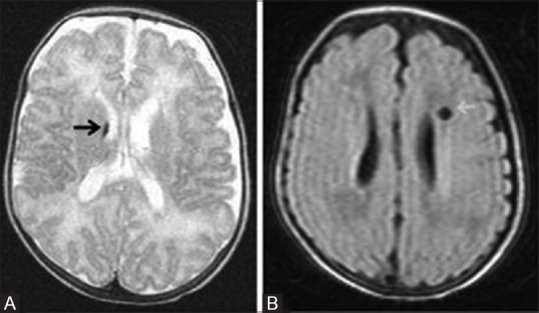
A 76-day-old infant born preterm (30 weeks + 4 days) with maternal h/o pre-eclampsia and born by lower segment Cesarian section (LSCS) shows mild-to-moderate hypoxic ischemic injury to the brain. (A) Axial T2WI at the level of lateral ventricles shows germinal matrix hemorrhage at right caudothalamic groove (black arrow). (B) Axial FLAIR image at the level of lateral ventricles shows left periventricular white matter cyst (white arrow)
End-stage PVL shows a characteristic appearance due to gliosis and loss of volume of the periventricular white matter and centrum semiovale [Figures 5 and 6]. This results in ventriculomegaly with dilatation of the trigones and occipital horns, as well as wavy ventricular contour. Thinning of the corpus callosum is a characteristic late feature and is particularly noted posteriorly [Figure 6] (involving the posterior body and splenium). PVL is most commonly seen as white matter hyperintensity adjacent to lateral ventricle at peritrigonal and foramen of Monro region [Figure 6].[6] PVL may also present as scattered punctate white matter abnormalities. Approximately two-third of PVL cases are associated with hemorrhage. If PVL is seen as isolated white matter hyperintensity at peritritrigonal region [Figure 7], then it should be differentiated from the terminal zones of myelination (TZM). TZM show a thin band of low signal between the ependymal margin of ventricle and high intensity zone in coronal T2 weighted and FLAIR images [Figure 8]. However, in PVL, the high intensity zone generally extends to the ventricular ependyma [Figures 6 and 7]. TZM also show a triangular shape with superior orientation of apex in coronal images.[12]
Figure 5 (A and B).

A 3½-year-old child with cerebral palsy, born preterm with low birth weight, shows features of periventricular leukomalacia as sequelae to hypoxic ischemic brain injury. (A, B) Axial T2WI at the level of lateral ventricles shows significant reduction in volume and gliosis of the periventricular white matter. Also note mild dilatation and wavy margins of the lateral ventricle (black arrows)
Figure 6 (A-C).
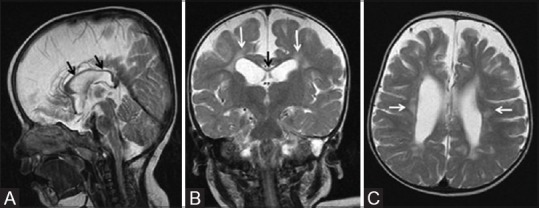
An 18-month-old child born preterm at 32 weeks of gestation with prolonged mild-to-moderate hypoxic ischemic injury. (A) Mid-sagittal plane T2WI shows thinning of corpus callosum (black arrows). Coronal T2WI (B) and axial T2WI (C) show thinning of corpus callosum (black arrows), lateral ventriculomegaly, and volume loss with hyperintensity (gliosis) of the periventricular white matter (white arrow)
Figure 7 (A-D).
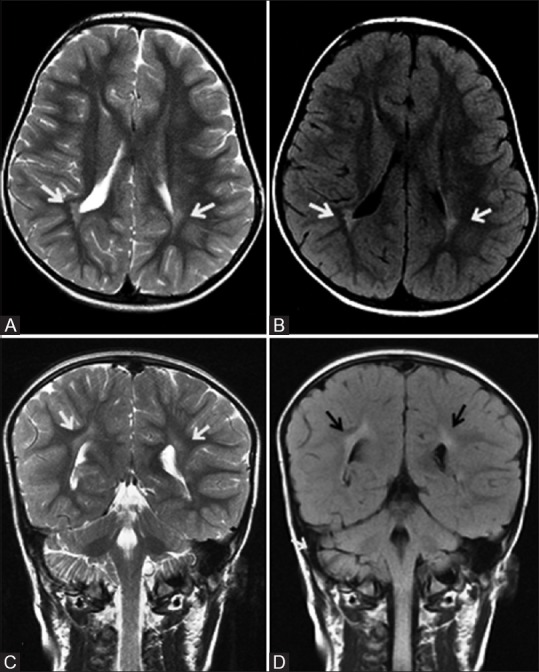
A 4-year-old child, born preterm with history of developmental delay, showing periventricular leukomalacia. Axial T2 (A) and FLAIR (B) images at the level of lateral ventricles show peritrigonal white matter hyperintensity extending to ependymal margin (arrows). Coronal T2 (C) and FLAIR (D) images at the level of atrium of lateral ventricles show peritrigonal white matter hyperintensity extending to ependymal margin (arrows)
Figure 8 (A-C).

A 2-year-old child, born preterm, showing terminal zones of myelination. Axial T2 (A) and FLAIR (B) images at the level of lateral ventricles shows peritrigonal white matter hyperintensity (arrows). (C) Coronal FLAIR image at the level of atrium of lateral ventricles shows peritrigonal white matter hyperintensity (arrows) with a thin band of hypointensity representing myelinated white matter, separating from high signal intensity ventricular ependyma
Germinal matrix–intraventricular hemorrhage
Germinal matrix–intraventricular hemorrhage (GM-IVH) is unique to the immature brain and is never seen beyond the neonatal period. GM-IVH occurs approximately in one-fourth of the low birth weight preterm neonates. It is found in late antenatal or immediate postnatal period in at one-third of the cases.[13] The spectrum of GM-IVH [Figures 4, 9, and 10] is classically described in the literature as follows.
Figure 9 (A-F).
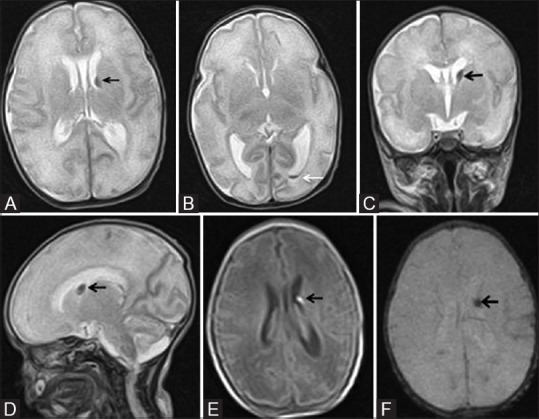
A 24-day-old neonate born preterm (32 weeks) with germinal matrix intraventricular hemorrhage (GM-IVH) grade II. (A, B) Axial T2WI at the level of lateral ventricles show left germinal matrix hemorrhage (black arrow) with extension in to the occipital horn (white arrow) and mild ventricular dilatation. Coronal (C) and sagittal (D) T2WI show left germinal matrix hemorrhage (black arrow). (E) Axial TIWI at the level of lateral ventricles shows T1 hyperintensity at left germinal matrix hemorrhage (black arrow). (F) Axial gradient image shows corresponding subependymal blooming area (black arrow)
Figure 10 (A and B).
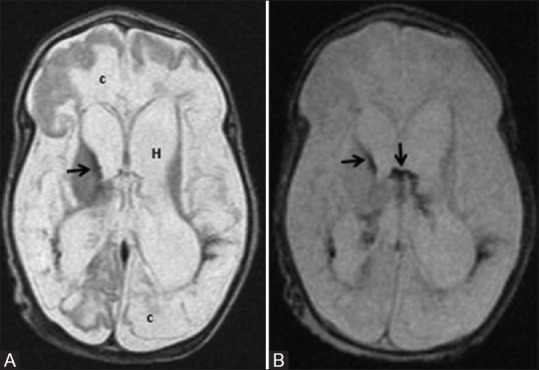
A 58-day-old infant born preterm with neonatal seizures shows features of prolonged mild-to-moderate hypoxic ischemic injury. Axial T2WI (A) and GRE image (B) at the level of lateral ventricles show germinal matrix hemorrhage with intraventricular extension (black arrows), hydrocephalus (H) and cystic encephalomalacia (c)
Grade I: Subependymal germinal matrix hemorrhage (GMH) ± minimal ventricular extension [Figure 4]
Grade II: GMH extending into the ventricle, intraventricular hemorrhage (IVH)
Grade III: IVH with hydrocephalus [Figures 9 and 10]
Grade IV: Periventricular parenchymal hemorrhagic infarction (PVHI).
GM is a highly cellular and vascularized zone of fetal brain. It is most active between 8 and 28 weeks of gestation and gives rise to both neurons and glia. GM lines the walls of the lateral ventricles. It is also seen at the external granular cell layer of the cerebellum and subependymally at the roof of the fourth ventricle. It regresses gradually in the first half of third trimester, and the last area to involute is at the posterior aspect of caudothalamic groove. Hence, GM hemorrhages mostly originate from here.
Hypoxic ischemia causes damage to the capillaries of the GM and subsequent reperfusion results in GMH. Cerebellar GMH is usually crescentic in shape and located peripherally at the dorsal aspects of the hemispheres. Cranial ultrasound is generally adequate in this group, and MRI is used to detect concomitant deep grey matter injury and PVL.
PVHI is not a true GMH but a complication of it. Usually, it manifests as unilateral (83%) triangular hemorrhagic lesion, however, bilateral lesions (17%) can also occur.[14] PVHI results from thrombosis of the periventricular medullary veins. It may be localized to the frontoparietal (26%), parietooccipital (46%), or may involve the entire periventricular region (28%). Sequelae of GM-IVH include GM destruction and encephalomalacia. A combination of GM-IVH and PVL is also seen in prolonged mild-to-moderate asphyxia [Figures 4 and 10].
Profound Hypoxic–Ischemic Injury in Preterm Neonates
Severe hypotension most frequently injures the early myelinating and metabolically active thalami, dorsal brainstem, and anterior vermis. Relatively low involvement of the basal ganglia, hippocampus, perirolandic cortex, and corticospinal tract are also observed. This regional preference of injury is explained by the early myelination of thalamus and globus pallidus by 24–25 weeks of gestation and late myelination of corpus striatum (caudate nucleus and putamen) and perirolandic cortex beyond 35–36 weeks of gestation.[7,15] There may be associated GMH or PVL.
The earliest MRI finding is diffusion abnormality in thalami, which is usually evident within the first 24 hours. Increased T2 signal intensity is seen by the 3rd day of injury and increased T1 signal intensity by the 4th day. The increased T1 signal intensity persists into the chronic stage, and the decreased T2 signal intensity replaces the T2 hyperintensity by approximately 7 days. When involved, the basal ganglia shows cavitation and volume loss without gliosis.
Magnetic Resonance Imaging Spectrum of Hypoxic–Ischemic Injury in Term Neonates
The pattern of injury in full-term neonates is broadly divided into two groups depending on the involvement of the deep gray matter structures. The mild-to-moderate group have watershed predominant pattern of injury and the profound type has basal ganglia and thalamus injury. Injury to corpus callosum and internal capsule is also seen.
Profound hypoxic–ischemic injury in full-term neonates (acute severe asphyxia, basal ganglia-thalamus pattern, selective neuronal necrosis)
This pattern of injury is usually seen following an acute sentinel event such as ruptured uterus, placental abruption, or cord prolapse. Hence, this is also referred as a pattern following “acute near severe asphyxia.” Because the injury primarily involves the bilateral ventrolateral thalami and posterior putamina, it is also known as basal ganglia–thalamus pattern (BGT) [Figure 11].
Figure 11 (A-D).
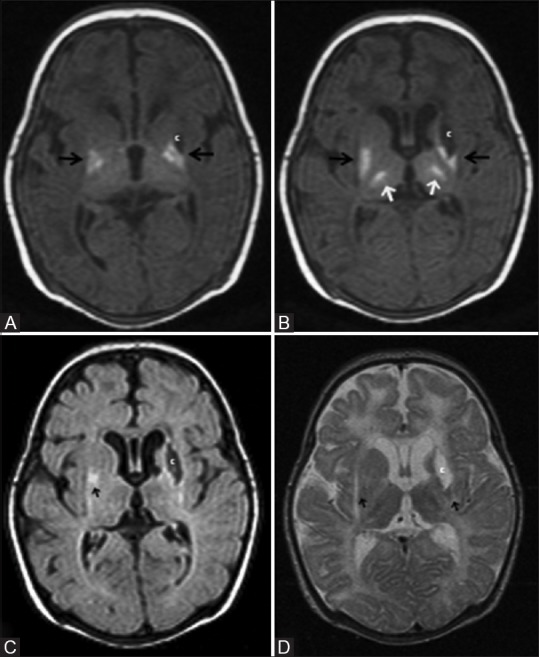
A 29-day-old term neonate, with severe hypoxic ischemic encephalopathy (stage III) at birth, shows basal ganglia thalamic pattern of injury. (A, B) Axial T1WI at the level of lateral and third ventricles show hyperintensity at the bilateral ventrolateral thalami and posterior putamina, and T1 hypointensity (cyst) at left globus pallidus. Also note the nonvisualization of myelination (T1 hyperintensity) at the posterior limb of internal capsule. Axial FLAIR (C) and (D) T2WI at the level of lateral ventricles show cerebrospinal fluid (CSF) intensity cyst (T2 hyperintensity and suppression of signals on FLAIR) with peripheral gliosis at the left globus pallidus. Note the subtle T2 hyperintensity at the bilateral posterior putamina and ventrolateral thalami and the minimal cystic changes at the bilateral frontal periventricular white matter
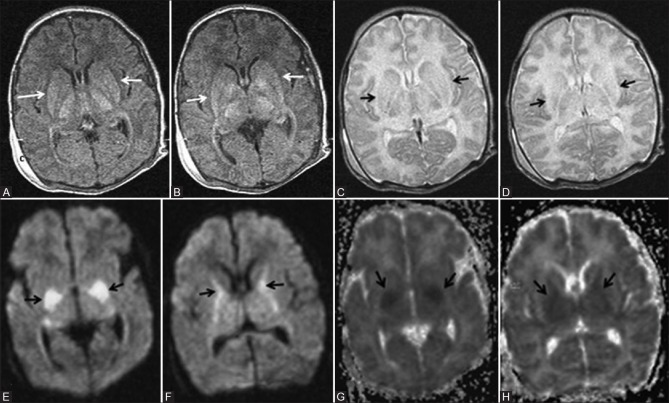
The injury primarily affects the deep gray matter–posterior putamina, ventrolateral thalami, hippocampi, and dorsal brainstem, and occasionally involves the perirolandic cortex. Usually minor cortical injuries may be seen, and more prolonged insults result in diffuse cortical involvement [Figure 12]. As described, DWI is the first sensitive modality beginning from the first day of life [Figure 13E and F]. The involved regions show T1 hyperintensity beginning from the 2nd day of life and persist for several months [Figure 11A and B, 12A and B, 13A and B]. These regions may show mildly increased T2 signal intensity (denoting edema), beginning from the 3rd day of life [Figure 13C and D]. By 7–10 days, basal ganglia and thalami show T2 hypointensity [Figure 12C and D). Chronic stage is marked by atrophy and T2 hyperintensity of the injured regions, particularly in the ventrolateral thalami and posterior putamina [Figure 11C and D]. Extensive injury involving gray and white matter finally results in cystic encephalomalacia [Figure 12].
Figure 12 (A-H).
A 12-day-old full-term neonate; HIE stage II—severe hypoxic ischemic injury involving deep grey matter structures. (A, B) Axial T1WI at the level of basal ganglia shows abnormal T1 hyperintensity of the ventrolateral thalamus and posterior putamen (black arrows). Note the absence of normal T1 hyperintensity of the posterior limb of internal capsule. (C, D) Axial T2WI at the level of basal ganglia shows abnormal T2 hyperintensity of the thalamus and putamen (black arrows). Note the absence of normal T2 hypointense signal of the posterior limb of internal capsule. (E, F) Axial DWI at the level of basal ganglia shows diffusion restriction involving the posterior putamina and internal capsules (black arrows). (G, H) Axial ADC maps at the level of basal ganglia show corresponding hypointensity in the posterior putamen and internal capsules, denoting diffusion restriction (black arrows)
Figure 13 (A-F).
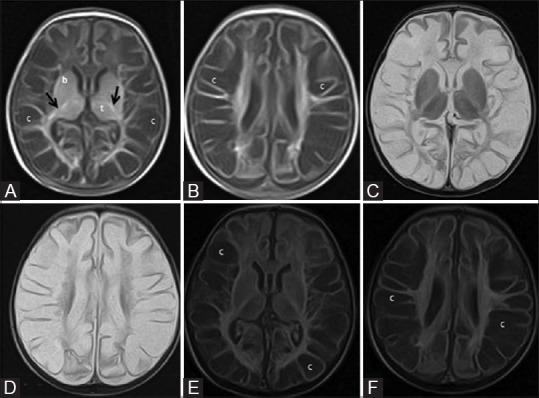
A 24-day-old term neonate with low birth weight, CSF proven meningitis, and meconium-stained amniotic fluid showing prolonged severe hypoxic ischemic injury; mixed pattern involving deep grey matter and white matter. Axial T1WI at the level of basal ganglia (A) and lateral ventricles (B). Note the abnormal T1 hyperintensity of the basal ganglia and thalami (compare with Figure 1) and T1 hypointensity of cystic changes in the periventricular and subcortical white matter. Also note the false positive T1 hyperintensity of the posterior limb of internal capsule. Axial T2WI at the level of basal ganglia (C) and lateral ventricles (D). Note the abnormal T2 hypointensity of the basal ganglia and thalami (compare with Figure 1) and T2 hyperintensity at the level of posterior limb of internal capsule. Also note the T2 hyperintensity of cystic changes in the periventricular and subcortical white matter. (E, F) Axial FLAIR images at the level of basal ganglia and lateral ventricles. Note the cystic changes in the periventricular and subcortical white matter
Another noteworthy finding is the absent posterior limb sign. It is the nonvisualization of the normal increased signal intensity of the posterior limb of the internal capsule (PLIC) on T1WI in a term neonate (after 37 weeks' of gestational age). T2WI shows corresponding decreased signal intensity in the PLIC and is more useful for determining the exact location of PLIC. Although absent posterior limb sign is usually evident in the first 24 hours of life, it attains acceptable specificity only by the end of the first week [Figure 11 and 13]. Rutherford described three stages of this injury pattern, namely, mild, moderate, and severe.[16]
Normal signal of PLIC and focal nature of the basal ganglia lesion are typical of mild variety. Moderate form is characterized by abnormal signal from the PLIC and focal lesions, involving the posterolateral lentiform nucleus and lateral thalamus. A severe form is marked by abnormal PLIC and widespread changes in the basal ganglia and thalamus, often extending to mesencephalon. Involvement of the cerebral cortex and white matter is also frequently observed in the severe form if the insult is prolonged [Figure 12].
The abnormal mild T1 hyperintensity noted in the basal ganglia and thalami is nonspecific in the first week of life because of some overlap between the MRI findings of normal and severe hypoxic neonates [Figure 1C and D]. Hence, these findings should not be interpreted in isolation.
Mild-to-moderate hypoxic–ischemic injury in full-term neonates (prolonged partial asphyxia, watershed pattern)
Prolonged partial asphyxia results in injury to the watershed zones of cerebrum, i.e., parasagittal white matter, and whenever severe, extending to the overlying cortex [Figures 14–17]. This is due to the relative hypoperfusion of these areas as the result of autoregulation. The major etiologies for this type of injury are prolonged difficult delivery and long standing antenatal risk factors. Again, DWI is the earliest to change and show cortical and subcortical white matter restriction [Figure 14A]. By the 2nd day, T2WI may often show cortical swelling, loss of gray-white differentiation, and hyperintensity in the cortex and subcortical white matter. T1WI show abnormal cortical high signal intensity beginning from the 3rd day of life, reaches the maximum during the 2nd week, and lasts for several weeks. This is referred to as cortical highlighting [Figure 14C and 15C and D). On T2WI, the abnormal cortex may show subtle low signal intensity [Figure 14E].
Figure 14 (A-E).
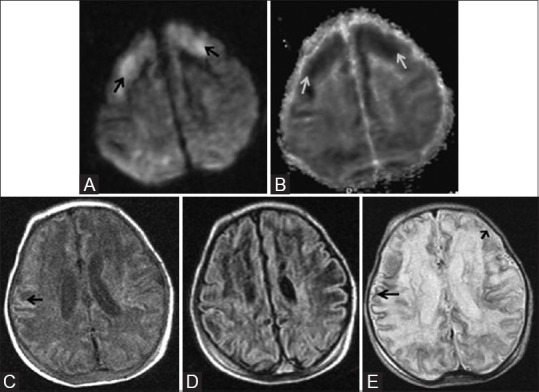
An 11-day-old full-term neonate with h/o birth asphyxia and neonatal seizures shows features of prolonged mild-to-moderate hypoxic–ischemic injury. Axial diffusion weighted (A) and ADC map (B) images above the level of lateral ventricles show diffusion restriction (DWI hyperintensity, black arrow, and ADC map hypointensity, white arrow) involving the cortex and subcortical white matter of bilateral frontal lobes. Axial T1WI (C) and FLAIR image (D) at the level of lateral ventricles shows subtle cortical highlighting (black arrow) at the right parietal lobe. (E) Axial T2WI at the level of lateral ventricles shows subtle low signal intensity of the cortex (black arrow) at the right parietal lobe. Also note the loss of gray-white differentiation and abnormal hyperintensity of cortex and subcortical white matter at left frontal lobe (small black arrow)
Figure 17 (A-D).
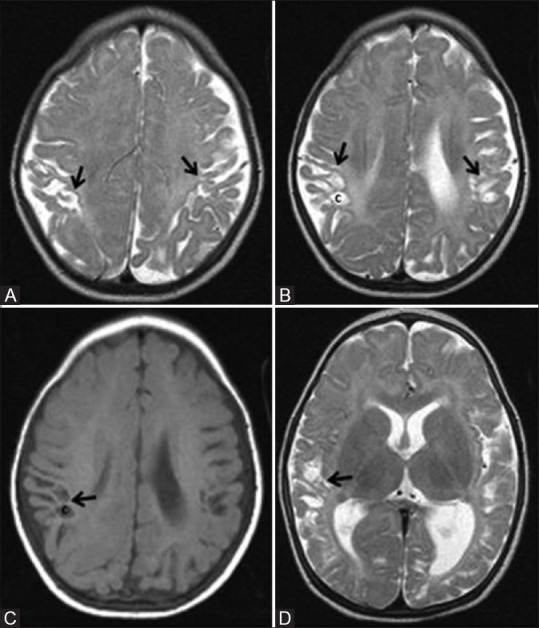
A 7-month-old infant with h/o term birth, low birth weight, HIE stage II, and neonatal seizures shows features of mild-to-moderate hypoxic–ischemic injury involving the parasagittal border zone. Axial T2WI above (A) and at (B) lateral ventricles show gliosis and volume loss involving bilateral parasagittal gyri and subcortical white matter (ulegyria, black arrow). Also note few cysts in the subcortical white matter (C). Axial T1WI (C) at the level of lateral ventricles and Axial T2WI (D) at basal ganglia level show volume loss and cysts (c) involving bilateral parasagittal cortex and subcortical white matter. Also note the uninvolved basal ganglia and thalamus
Figure 15 (A-D).
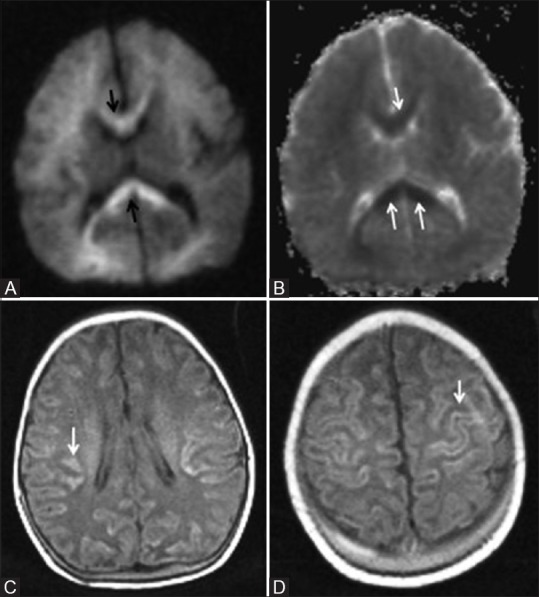
An 8-day-old term neonate with history of perinatal depression and prolonged mild-to-moderate hypoxic ischemic injury. Axial DW (A) and ADC (B) images show restricted diffusion in the corpus callosum (arrow) and faint restriction in frontal and parietal deep white matter. (C, D) Axial T1WI show cortical highlighting (arrow) in the frontoparietal lobes involving perirolandic region
Figure 16 (A and B).
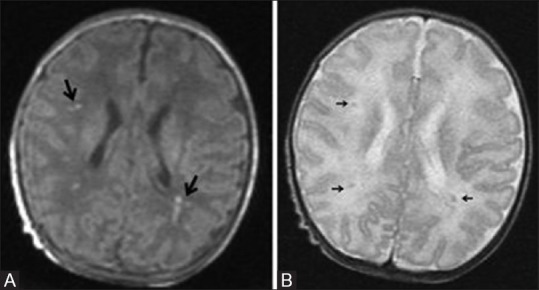
A 20-day-old full-term neonate presenting with seizures shows mild hypoxic ischemic brain injury. Axial T1 (A) and T2 (B) WI at the level of lateral ventricles show few punctuate T1 hyperintensities (large black arrows) and subtle T2 hypointensities (small black arrows) representing astrogliosis in the parasagittal subcortical white matter. No blooming in the gradient images rules out hemorrhage
Ulegyria (shrunken cortex with flattened mushroom shaped gyri) and diminished white matter volume, predominantly in the parietooccipital region, is seen in the chronic stage [Figure 17C].
Neonatal Encephalopathy—Few Other Causes Concerning Radiologist
If MRI reveals a different pattern or evolution of brain injury, other causes of neonatal encephalopathy such as perinatal stroke, metabolic causes, infections, or birth trauma need consideration. However, in reality, a neonatologist excludes common metabolic causes and infection before ordering MRI. Neurosonogram in neonatal intensive care unit also aids in forming a working diagnosis. In our practice, neonates after stabilization undergo MRI for confirmation of the diagnosis and prognostication of outcome.
Perinatal stroke
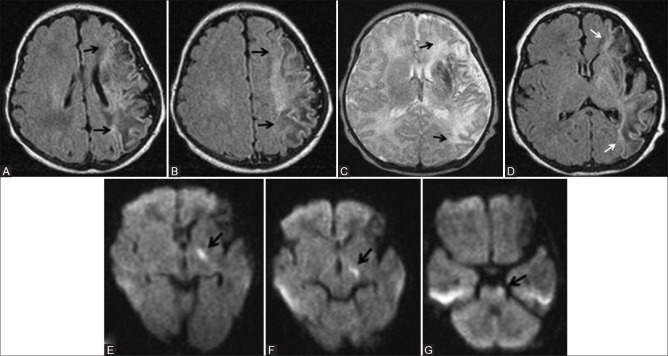
Perinatal stroke comprises perinatal arterial ischemic stroke (PAIS), perinatal hemorrhagic stroke (PHS), and sinovenous thrombosis. PAIS is defined as cerebrovascular accident occurring between 28 weeks of gestational age and 28 days after delivery, with radiological or pathological evidence of focal arterial infarction.[17] The incidence of perinatal arterial ischemic stroke recognized during neonatal period was 1 in 2300 in term infants.[18] The most common type of PAIS is ischemic lesions involving the middle cerebral artery [Figure 18). DWI has the highest sensitivity at acute phase and also detects prewallerian degeneration of the corticospinal tract (Figure 18E and F).
Figure 18 (A-G).
A 10-day-old full-term neonate with perinatal left middle cerebral artery territory infarction. (A, B) Axial T1WI at and above the level of lateral ventricles show T1 hypointense (edema) and hyperintense (astrogliosis) areas involving left the middle cerebral artery (MCA) territory. No blooming in the gradient images rules out haemorrhage. (C, D) Axial T2 and FLAIR images at the level of lateral ventricles show predominant T2 hyperintensity and few hypointense areas involving the left MCA territory. No blooming in the gradient images rules out hemorrhage. (E-G) Axial DWI at the level of lateral ventricles, midbrain and pons show diffusion restriction involving left corticospinal tract
PHS was coined by Armstrong-Wells et al.[19] and included intracerebral hemorrhage or subarachnoid hemorrhage, excluding pure GM-IVH. They found a population prevalence of 6.2 in 100,000 live births for PHS. However, some overlap exists between these conditions due to hemorrhagic transformation of PAIS and venous infarcts [Figure 19].
Figure 19 (A and B).
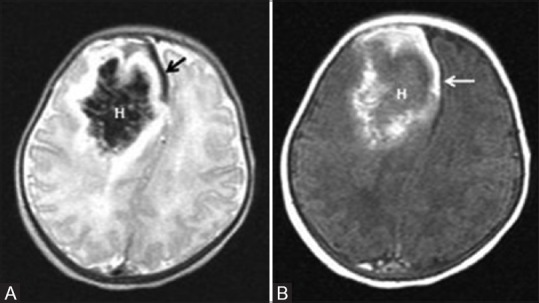
A 6-day-old term neonate, with history of perinatal depression. Axial T2 (A) and Axial T1 (B) WI show parenchymal subacute hematoma (H) in the right frontal lobe with mass effect. Also note subacute SDH in the right frontal region and anterior interhemispheric fissure (arrow)
Cerebral sinovenous thrombosis (CSVT) should be suspected in neonates presenting with seizures and/or lethargy and without a history of perinatal asphyxia. It showed an incidence of 1.4 to 12 per 100,000 term live births.[20] Presence of an IVH with a unilateral thalamic hemorrhage should arouse suspicion for CSVT.[21] MRI combined with MR venography is the preferred diagnostic modality.
Hypoglycemic brain injury
Neonatal hypoglycaemia (<46 mg/dL) can occur in 5 to 15% of normal term neonates. The injury patterns described are white matter abnormalities (most common), cortical abnormalities, white matter hemorrhage, basal ganglia–thalamic lesions, and PLIC abnormalities. A predominant parietooccipital distribution of abnormalities is seen in approximately 30% of the patients [Figure 20].[22] Neonates with hypoxic ischemic encephalopathy (HIE) are at increased risk developing concurrent hypoglycemia [Figure 3]. These neonates show predominant pattern of HII as well as specific imaging features of hypoglycemia [Figure 21]. It is impossible to differentiate hypoglycemic brain injury from HII by imaging alone, unless it is of parietooccipital distribution.
Figure 20 (A-D).
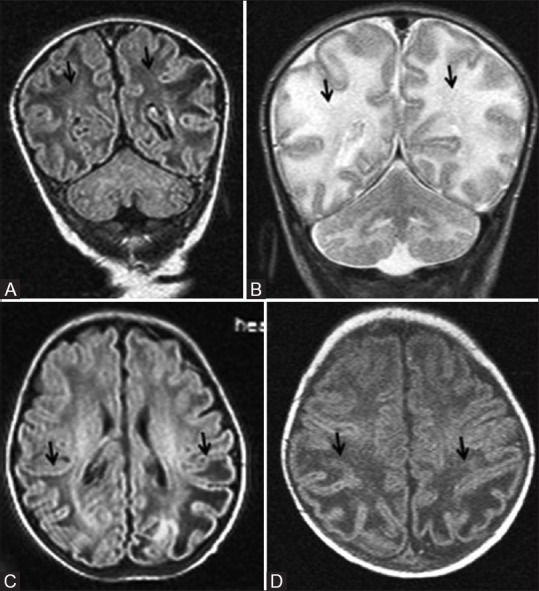
A 22-day-old early term neonate with documented hypoglycemia and seizures. Coronal FLAIR (A) and T2WI (B) images at the level of parietooccipital lobes show cystic changes and edema (black arrows) involving white matter and increased gray-white differentiation. Axial FLAIR (C) at lateral ventricular level and T1WI (D) above lateral ventricles show white matter cystic changes and edema confined to parietooccipital lobes (black arrows)
Figure 21 (A and B).
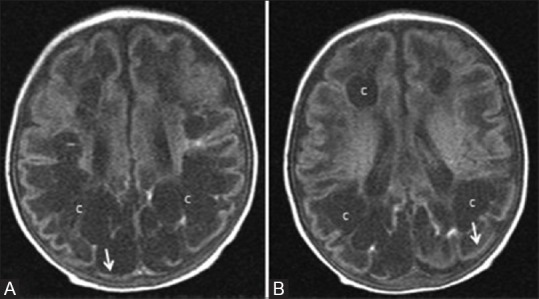
An 8-month-old infant born late preterm (36 weeks 3 days), small for gestational age with symptomatic hypoglycemia and hypoxic brain injury. (A, B) Axial T1WI at the level of lateral ventricles show cystic changes (c) involving frontal and parietooccipital white matter. Note the predominant involvement of parietooccipital region and cortical thinning (arrows)
Clinical features and outcome in relation to regions of injury
Pattern of brain injury can dictate neurodevelopmental outcome. The clinical features and the history (ante and perinatal events) also points toward the pattern of injury.
Neonates with the BGT pattern had the most intensive need for resuscitation at birth, severe encephalopathy, and clinical seizures. BGT pattern is associated with cerebral palsy and cognitive deficits. Abnormal PLIC, a structure involved in the BGT pattern is associated with abnormal motor outcome (ability to walk at 2 years of age).[23] Cognitive deficits are better explained by the frequent occurrence of watershed injury in the BGT group. Watershed pattern is associated with predominant cognitive, visual, language, behavioral, and seizure problems at a median age of 2 years.[24,25]
The most common long-term neurologic outcome of PVL is motor and visual impairment. Majority of children with minimal changes of PVL progresses with normal psychomotor development and rest shows high frequency of neuromotor delay. Most of the children with severe changes of PVL show severe neurodevelopmental problems (cerebral palsy, different cognitive deficits, vision impairment, and epilepsy).[26]
Thus, a radiologist can likely predict the neurodevelopmental outcome of the infant, depending on the pattern of injury. However, the amazing plasticity of the infantile brain should not be forgotten, and at least in few cases, the appropriate neurodevelopmental therapy may surprise, both the radiologists and clinicians.
Conclusion
There are three main patterns of HII depending on the severity of the insult and maturity of the neonatal brain.
Watershed pattern (WS): Seen in term neonates affected by mild-to-moderate asphyxia and injury involves the parasagittal cortex and subcortical white matter.
PVL or GM-IVH: Associated with mild-to-moderate asphyxia in preterm neonates.
Deep gray matter or basal ganglia thalamic pattern: Associated with profound hypoxia, irrespective of maturity.
Preterm neonates show less severe involvement of basal ganglia. Term neonates show frequent involvement of perirolandic cortex. There are varying degrees of cortical or white matter injury, depending on the nature of insult.
Financial support and sponsorship
Nil.
Conflicts of interest
There are no conflicts of interest.
References
- 1.Graham EM, Ruis KA, Hartman AL, Northington FJ, Fox HE. A systematic review of the role of intrapartum hypoxia-ischemia in the causation of neonatal encephalopathy. Am J Obstet Gynecol. 2008;199:587–95. doi: 10.1016/j.ajog.2008.06.094. [DOI] [PubMed] [Google Scholar]
- 2.Chalak LF, Rollins N, Morriss MC, Brion LP, Heyne R, Sánchez PJ. Perinatal Acidosis and Hypoxic-Ischemic Encephalopathy in Preterm Infants of 33 to 35 Weeks' Gestation. J Pediatr. 2012;160:388–94. doi: 10.1016/j.jpeds.2011.09.001. [DOI] [PMC free article] [PubMed] [Google Scholar]
- 3.Lawn JE, Cousens S, Zupan J. 4 million neonatal deaths: When? Where? Why? Lancet. 2005;365:891–900. doi: 10.1016/S0140-6736(05)71048-5. [DOI] [PubMed] [Google Scholar]
- 4.Vannucci RC, Perlman JM. Interventions for Perinatal Hypoxic-Ischemic Encephalopathy. Pediatrics. 1997;100:1004–114. doi: 10.1542/peds.100.6.1004. [DOI] [PubMed] [Google Scholar]
- 5.Barkovich AJ. The encephalopathic neonate: Choosing the proper imaging technique. Am J Neuroradiol. 1997;18:1816–20. [PMC free article] [PubMed] [Google Scholar]
- 6.Shroff MM, Soares-Fernandes JP, Whyte H, Raybaud C. MR Imaging for Diagnostic Evaluation of Encephalopathy in the Newborn. Radiographics. 2010;30:763–80. doi: 10.1148/rg.303095126. [DOI] [PubMed] [Google Scholar]
- 7.Huang BY, Castillo M. Hypoxic-Ischemic Brain Injury: Imaging Findings from Birth to Adulthood. Radiographics. 2008;28:417–39. doi: 10.1148/rg.282075066. [DOI] [PubMed] [Google Scholar]
- 8.Rutherford MA. MRI of the neonatal brain. London: Saunders; 2002. The asphyxiated term infant; pp. 99–128. [Google Scholar]
- 9.Boichot C, Walker PM, Durand C, Grimaldi M, Chapuis S, Brunotte F. Term neonate prognoses after perinatal asphyxia: Contributions of MR imaging, MR spectroscopy, relaxation times, and apparent diffusion coefficients. Radiology. 2006;239:839–48. doi: 10.1148/radiol.2393050027. [DOI] [PubMed] [Google Scholar]
- 10.Heinz ER, Provenzale JM. Imaging findings in neonatal hypoxia: A practical review. Am J Roentgenol. 2009;192:41–7. doi: 10.2214/ajr.08.1321. [DOI] [PubMed] [Google Scholar]
- 11.Volpe JJ. Brain injury in premature infants: A complex amalgam of destructive and developmental disturbances. Lancet Neurol. 2009;8:110–24. doi: 10.1016/S1474-4422(08)70294-1. [DOI] [PMC free article] [PubMed] [Google Scholar]
- 12.Welker KM, Patton A. Assessment of normal myelination with magnetic resonance imaging. Semin Neurol. 2012;32:15–28. doi: 10.1055/s-0032-1306382. [DOI] [PubMed] [Google Scholar]
- 13.Paneth N, Pinto-Martin J, Gardiner J, Wallenstein S, Katsikiotis V, Hegyi T, et al. Incidence and timing of germinal matrix/intraventricular hemorrhage in low birth weight infants. Am J Epidemiol. 1993;137:1167–76. doi: 10.1093/oxfordjournals.aje.a116619. [DOI] [PubMed] [Google Scholar]
- 14.Roze E, Kerstjens JM, Maathuis CG, ter Horst HJ, Bos AF. Risk factors for adverse outcome in preterm infants with periventricular hemorrhagic infarction. Pediatrics. 2008;122:e46–e52. doi: 10.1542/peds.2007-3305. [DOI] [PubMed] [Google Scholar]
- 15.Barkovich A J, Sargent S K. Profound asphyxia in the premature infant: Imaging findings. Am J Neuroradiol. 1995;16:1837–46. [PMC free article] [PubMed] [Google Scholar]
- 16.Cabaj A, Bekiesińska-Figatowska M, Mądzik J. MRI patterns of hypoxic-ischemic brain injury in preterm and full term infants – Classical and less common MR findings. Pol J Radiol. 2012;77:71–6. doi: 10.12659/pjr.883379. [DOI] [PMC free article] [PubMed] [Google Scholar]
- 17.Lynch JK, Hirtz DG, DeVeber G, Nelson KB. Report of the National Institute of Neurological Disorders and Stroke Workshop on Perinatal and Childhood Stroke. Pediatrics. 2002;109:116–23. doi: 10.1542/peds.109.1.116. [DOI] [PubMed] [Google Scholar]
- 18.Schulzke S, Weber P, Luetschg J, Fahnenstich H. Incidence and diagnosis of unilateral arterial cerebral infarction in newborn infants. J Perinat Med. 2005;33:170–5. doi: 10.1515/JPM.2005.032. [DOI] [PubMed] [Google Scholar]
- 19.Armstrong-Wells J, Johnston SC, Wu YW, Sidney S, Fullerton HJ. Prevalence and predictors of perinatal hemorrhagic stroke: Results from the Kaiser Pediatric Stroke Study. Pediatrics. 2009;123:823–8. doi: 10.1542/peds.2008-0874. [DOI] [PubMed] [Google Scholar]
- 20.Berfelo FJ, Kersbergen KJ, van Ommen CH, Govaert P, van Straaten HL, Poll-The BT, et al. Neonatal cerebral sinovenous thrombosis from symptom to outcome. Stroke. 2010;41:1382–8. doi: 10.1161/STROKEAHA.110.583542. [DOI] [PubMed] [Google Scholar]
- 21.Wu YW, Miller SP, Chin K, Collins AE, Lomeli SC, Chuang NA, et al. Multiple risk factors in neonatal sinovenous thrombosis. Neurology. 2002;59:438–40. doi: 10.1212/wnl.59.3.438. [DOI] [PubMed] [Google Scholar]
- 22.Burns CM, Rutherford MA, Boardman JP, Cowan F M. Patterns of cerebral injury and neurodevelopmental outcomes after symptomatic neonatal hypoglycaemia. Pediatrics. 2008;122:65–74. doi: 10.1542/peds.2007-2822. [DOI] [PubMed] [Google Scholar]
- 23.Rutherford MA, Pennock JM, Counsell SJ, Mercuri E, Cowan FM, Dubowitz LM, et al. Abnormal Magnetic Resonance Signal in the Internal Capsule Predicts Poor Neurodevelopmental Outcome in Infants with Hypoxic-Ischemic Encephalopathy. Pediatrics. 1998;102:323–8. doi: 10.1542/peds.102.2.323. [DOI] [PubMed] [Google Scholar]
- 24.Miller SP, Ramaswamy V, Michelson D, Barkovich AJ, Holshouser B, Wycliffe N, et al. Patterns of brain injury in term neonatal encephalopathy. J Pediatr. 2005;146:453–60. doi: 10.1016/j.jpeds.2004.12.026. [DOI] [PubMed] [Google Scholar]
- 25.Martinez-Biarge M, Bregant T, Wusthoff CJ, Chew AT, Diez-Sebastian J, Rutherford MA, et al. White Matter and Cortical Injury in Hypoxic-Ischemic Encephalopathy: Antecedent Factors and 2-Year Outcome. J Pediatr. 2012;161:799–807. doi: 10.1016/j.jpeds.2012.04.054. [DOI] [PubMed] [Google Scholar]
- 26.Resić B, Tomasović M, Kuzmanić-Samija R, Lozić M, Resić J, Solak M. Neurodevelopmental outcome in children with periventricular leukomalacia. Coll Antropol. 2008;32(Suppl 1):143–7. [PubMed] [Google Scholar]


