

Abstract
Mass spectrometry (MS) instruments and experimental protocols are rapidly advancing, but the software tools to analyze tandem mass spectra are lagging behind. We present a database search tool MS-GF+ that is sensitive (it identifies more peptides than most other database search tools) and universal (it works well for diverse types of spectra, different configurations of MS instruments and different experimental protocols). We benchmark MS-GF+ using diverse spectral datasets: (i) spectra of varying fragmentation methods; (ii) spectra of multiple enzyme digests; (iii) spectra of phosphorylated peptides; (iv) spectra of peptides with unusual fragmentation propensities produced by a novel alpha-lytic protease. For all these datasets, MS-GF+ significantly increases the number of identified peptides compared to commonly used methods for peptide identifications. We emphasize that while MS-GF+ is not specifically designed for any particular experimental set-up, it improves upon the performance of tools specifically designed for these applications (e.g., specialized tools for phosphoproteomics).
Introduction
Mass spectrometry (MS) instruments and experimental protocols have greatly advanced over the last decade. New fragmentation technologies have emerged and high-precision mass spectrometers like Orbitrap have become widely available. While trypsin remains a dominant protease in proteomics studies, digesting proteins with diverse proteases is becoming popular [1]. Empowered by these changes, MS researchers now have diverse choices with respect to the questions: “what fragmentation method to use?”, “how accurate should be the measurements of the mass-to-charge (m/z) ratios?”, “what proteases to use?”, and “what post-translational modification (PTM) to focus on (e.g. phosphorylation)?”. Depending on these choices, the resulting tandem mass (MS/MS) spectra vary in fragmentation propensities and precision. Therefore, unlike in the past when low-precision Collision Induced Dissociation (CID) spectra of tryptic peptides dominated the field, spectral datasets generated today are very diverse. Unfortunately, the popular MS/MS database search tools such as SEQUEST [2] and Mascot [3] have not kept pace with the increased diversity of the data. While several new MS/MS database search engines were recently developed including Andromeda [4], Morpheus [5], and MS Amanda [6]), they have resulted in only minor improvements as compared to SEQUEST and Mascot.
Many efforts have been invested into making existing MS/MS search tools compatible with new types of data. For example, several pre- or post-processing strategies have been proposed [7, 8], resulting in small improvement in the performance of database search tools. To further boost the performance, MS/MS database search tools are combined with statistical modeling tools like PeptideProphet [9], Percolator [10], and IDPicker [11]. These tools do not find new Peptide-Spectrum Matches (PSMs), but rather re-score PSMs reported by a database search tool using more complex scoring and output high-scoring PSMs. While they often improve the performance of a database search tool, their performance is negatively affected when the database search tool fails to find correct PSMs [12]. Another downside of the pre- or post-processing strategies and statistical modeling tools is that, since they are often not integrated into database search tools, using them complicates the analysis of MS/MS spectra. Moreover, since different laboratories employ different combinations of tools (see Figure 1), even for the same data, capabilities of analyzing the data vary widely and results obtained in one laboratory are often difficult to reproduce in another laboratory [13].
Figure 1.
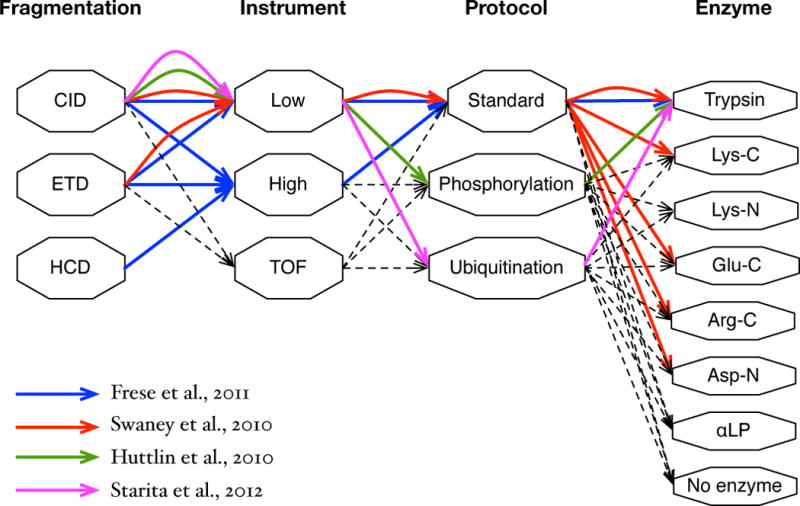
Various spectral types. Spectral types are represented as paths in the graph representing possible choices of the fragment method (Fragmentation), the instrument measuring product ion m/z (Instrument), the protocol used to prepare a sample (Protocol), and the enzyme used to digest proteins (Enzyme). ‘Low’ in Instrument indicates low-resolution instruments (e.g. linear ion-trap), ‘High’ indicates high-resolution instruments (e.g. Orbitrap), and ‘TOF’ indicates time-of-flight instruments. ‘Phosphorylation’ and ‘Ubiquitination’ in Protocol indicate that spectra are generated from phosphopeptides and ubiquitinated peptides, respectively. A path in the graph represents a spectral type. For example, the green path (CID, Low, Phosphorylation, Trypsin) represents low-precision CID spectra of trypsin digests generated from a sample enriched for phosphopeptides. The blue, red, green, and magenta paths represent spectral types of the datasets used in recent studies by Frese et al. [20], Swaney et al. [1], Huttlin et al. [21], and Starita et al. [22], respectively. Different combinations of analysis tools were used for different studies. Frese et al. used an in-house tool for peak filtering, de-isotoping, and charge deconvolution, Mascot for database search, Percolator for re-scoring, and RockerBox [58] for peptide-level FDR control. Swaney et al. used an in-house tool for peak filtering, OMSSA [27] for database search, and an in-house tool for both peptide- and protein-level FDR control. Huttlin et al. used an in-house tool for re-calibrating peak masses, SEQUEST for database search, an in-house tool for re-scoring, and peptide- and protein-level FDR control. Starita et al. used the Trans-Proteomics Pipeline [45] along with SEQUEST for database search. The same datasets were analyzed by MS-GF+ without using any additional tool with scoring parameters trained separately for different spectral types.
In a recent review, Noble and MacCoss pointed out that “the field (of MS) is still missing a generic analysis platform that can be adapted automatically and in a principled fashion to handle spectra produced by any given fragmentation protocol” [14]. Our MS-GF+ is a step towards achieving this goal, representing a universal database search tool that performs well for diverse types of spectral datasets. MS-GF+ works well (i.e., identifies more peptides than other MS/MS tools that we tested) for spectra generated using diverse configurations of MS instruments and experimental protocols. But the main contribution of the paper is not the increase in the number of identifications for dozens of various fragmentation methods and experimental protocols but rather the fact that it represents the first truly universal MS/MS database search tool. We emphasize that MS-GF+ is not customized for specific spectral datasets but rather uses a robust probabilistic model that works well across all datasets.
MS-GF+ is universal because it automatically derives scoring parameters from thousand PSMs without prior knowledge of the type of the spectra [12]. We represent various types of spectra as a graph where paths represent spectral types (Figure 1). For each spectral type, MS-GF+ learns scoring parameters separately and scores a PSM using a different set of scoring parameters depending on the spectral type. MS-GF+ can train scoring parameters for any spectral type (including spectral types not specified in Figure 1) or use pre-trained scoring parameters. It takes over the authority to train scoring parameters to the users and makes the training easy.
The key advantage of MS-GF+ over existing approaches is its ability to compute rigorous E-values (using the generating function approach [15]) and thus to boost the number of peptide identifications. While the generating function approach from [15] worked well in a variety of studies [16, 17, 18, 19], the question of applying it to modified peptides and to high-precision MS/MS spectra remains open. In this paper, we address these issues, thus making the generating function approach applicable to all types of spectra.
We demonstrate the performance of MS-GF+ using various previously studied datasets [1, 20, 21, 22, 23]: spectra of tryptic peptides generated using CID, Higher-energy Collisional Dissociation (HCD) and Electron Transfer Dissociation (ETD) in combination with either linear ion trap or Orbitrap readout; spectra of multiple enzyme digests; spectra of phosphopeptides; and spectra or a novel protease alpha-lytic protease (αLP). For all these datasets, we show that MS-GF+ outperforms popular tools for peptide identification such as Mascot+Percolator.
Results
MS-GF+ scoring
Database search tools use a scoring function Score(P, S) to evaluate a PSM of a peptide P and a spectrum S, and further compute statistical significance of the resulting PSMs. In this paper, we use E-values to evaluate statistical significance of individual PSMs (referred as spectral E-values) and the target-decoy approach to estimate FDRs. See Gupta et al., 2011 [24] for the details of our probabilistic framework.
Let PS be a peptide that generated S. A scoring function is adequate for S (with respect to a protein database ProteinDB) if the correct peptide attains the maximal score in the database, i.e., maxP∈ProteinDB Score(P, S) = Score(PS, S). A “good” scoring function should satisfy the following three conditions. First, it should be adequate for the great majority of spectra. Second, the algorithm for PSM scoring should be fast. Third, the algorithm for computing statistical significance (e.g. E-values) of PSMs should be fast and accurate.
MS-GF+ uses a very simple dot-product scoring Score(P, S) = P* · S* after converting peptide P and spectrum S into peptide vector P* and spectral vector S* (the spectral vector was called the prefix-residue-mass spectrum in the previous publications [12, 25]). Conversion of a spectrum S into a spectral vector S* uses a probabilistic model that ensures that the resulting dot-product scoring is adequate [26] (first condition). At the same time, it makes scoring and computing accurate E-values fast [15] (second and third condition). This simple “dot-product” scoring model contrasts with many other database search [2, 4, 27, 28] and re-scoring [9, 10] tools, using sophisticated scoring functions that often make it difficult to satisfy the third condition.
MS-GF+ workflow
MS-GF+ takes a spectral dataset Spectra and a protein database ProteinDB as an input and outputs a set of scored PSMs along with E-value estimates. It uses open source application programming interfaces jmzML [29], jmzReader [30], and jmzIdentML [31], and supports the HUPO Proteomics Standard Initiative standard file formats – mzML [32] and mzIdentML [33]. Due to these developments, MS-GF+ has been already adopted in many proteomics pipelines and post-processing tools.
The workflow of MS-GF+ comprises the following 4 steps: generating spectral vectors, searching a protein database, computing E-values of PSMs, and estimating FDRs. Below, we describe each step as well as how MS-GF+ takes advantage of high precision spectra.
Generating spectral vectors
A (non-modified) peptide is defined as a string over the alphabet of 20 standard amino acids. Let be an extended amino acid set containing both unmodified and modified amino acids. For an (unmodified) amino acid , let Mod(a) be the set that contains a and all its modified amino acids. For example, if T (Thr) and T* (phosphorylated Thr) are in , Mod(T) = {T,T*}. Given a peptide P = a1…ak, define PV = pv1 …pvk as a variant of P if pvi ∈ Mod(ai) for all i (1 ≤ i ≤ k).
MS-GF+ converts spectra into spectral vectors [12, 25]. A spectral vector of a spectrum S is an M-dimensional vector with integer values, where M = PrecursorMass(S) is the nominal precursor mass of S. Here, we consider nominal precursor masses representing the sum of nominal masses of amino acids of the peptide generated the spectrum. Since in many cases, the precise nominal precursor mass is unknown (e.g. MS instruments often choose 2nd or 3rd isotope peak instead of mono-isotope peak from MS1 spectrum), multiple spectral vectors are generated separately for each possible nominal precursor mass, and the score of a peptide of mass M is computed from the spectral vector of precursor mass M.
The conversion from an experimental spectrum to a spectral vector proceeds as follows. A spectrum S = {(mz1, rank1),…, (mzl, rankl)} is represented as a set of ranked peaks where the ith highest intensity peak gets rank i (mzj and rankj represent m/z and rank of jth peak, respectively). An ion type is represented as a triplet of integers charge, of f set, and sign, where sign represents whether the ion type is a prefix ion (sign = 1) or a suffix ion (sign = −1). For example, singly-charged b-ions and y-ions correspond to ion types (1, 1, 1) and (1, 19, −1), respectively. Neutral losses and hydrogen transfers are also considered as ion types, e.g. singly charged z· ions corresponds to (1, 3, −1). Given an ion type ion = (charge, of f set, sign), one can turn a spectrum S into Sion = {(mass1, rs1),…, (massl, rsl)} using the following transformation:
where [x] represents the closest integer to x, and RankScore(ion, rank) is a pre-computed function that takes an ion type ion and an integer rank and returns a probabilistic log-likelihood score defined in [12, 26]. Note that 0.9995 is a rescaling constant for minimizing rounding errors (see Supplementary Table 1). In practice, RankScore(ion, rank) also accounts for the location of the observed peak and the precursor charge and mass of the spectrum, which are omitted here for simplification. Ion types contributing to scoring are selected from the training set as described in Kim et al., 2010 [12] Assume that ℐ is a set of ion types that are selected. The spectral vector of S (denoted by S = (s1,…, sM) is computed as follows:
where RankScore(ion, ∞) represents the score given when ion is missing.
We also define a peptide vector of a variant as follows. Let Mass(a) be the nominal mass of a (possibly modified) amino acid a. For example, Mass(T) = 101 and the mass of phosphorylated Thr is Mass(T*) = 181. Given a variant PV = pv1 … pvk, define the mass of PV as . Given a variant PV = pv1 … pvk of mass M, we define its peptide vector (denoted by PV) as a 0–1 vector (m1, …, mM) with (n − 1) 1s, such that mi = 1 if i equals to Mass(pv1) + … + Mass(pvj) (1 ≤ j ≤ k).
The MS-GF+ score of a PSM (PV, S) is defined as if Mass(PV) = PrecursorMass(S) and −∞ otherwise. The MS-GF+ score represents the log likelihood ratio described in [26].
Searching a protein database
We define ProteinDB+ as the set of all variants (with respect to an extended amino acid set ) derived from ProteinDB. The goal of MS-GF+ database search is to solve the following problem: Given a spectral dataset Spectra and a protein database ProteinDB, for each spectrum S ∈ Spectra find a variant PVS,ProteinDB such that
In contrast to a traditional spectrum-based MS/MS database search approach that compares each spectrum against all peptides, MS-GF+ uses an alternative peptide-based approach that computes the suffix array to compare each peptide against all spectra with the same precursor mass. See Supplementary Note 1 for the details of MS-GF+ approach to the database search.
Computing E-values of PSMs
The scores of PSMs reported by existing MS/MS database search tools are often poorly correlated with their E-values [34]. It is important to rank PSMs based on their E-values, because such ranking (rather than ranking based on “raw scores”) often dramatically increases the number of identified spectra under a given FDR [15, 35]. Many database search tools estimate an E-value of a PSM based on an approximation of a tail of the score distribution specific to the spectrum using peptides in the database [27, 28]. Since this approach is known to result in biased estimates of E-values [15], MS-GF+ adopted the generating function approach to rigorously compute E-values of PSMs using the score distribution of all peptides [15]. Our scoring model is essential here, because the generating function approach is easily applicable to the scoring functions that can be represented as a dot-product of vectors [24]. Adopting the generating function approach improves the accuracy of E-value estimates and increases the number of identified peptides as was recently confirmed by an independent work on applying it to the XCorr score in SEQUEST [35].
Given a spectrum S, a score threshold t, an extended set of amino acids , and a database size N, we define E-value(S, , t, N) as the expected number of variants PV (as defined by ) with MSGFScore(PV, S) ≥ t in a random protein database of size N. To compute E-value(S, , t, N), we first compute spectral E-value E-value(S, , t), the expected number of variants PV with MSGFScore(PV, S) ≥ t given a single random peptide. A single random peptide models a random peptide starting at a fixed position in a random protein database.
We consider a set of all possible (unmodified) peptides of length k (where k is a large number) and select a random peptide uniformly from this set (i.e. the probability of selecting a peptide is ). In practice, to reflect different frequencies of amino acids in a database (e.g. Leu is usually more common than Trp), we define the probability of a peptide P = a1 … ak as , where Prob(a) is the frequency of amino acid a in a protein database. Note that this does not change the algorithm to compute the spectral E-values. We say that a peptide P produces a variant PV if PV is a variant of a prefix of P. For example, PEPT* and PEPTI are produced by PEPTIDE. Given a spectrum S, let be the set of all variants PV with MSGFScore(PV, S) ≥ t. For every variant PV, there are 20k−|PV| peptides of length k producing a variant PV (|PV| stands for the number of amino acids in PV). Therefore, expected number of variants per random peptide with a score equal or better than t is
Since a variant is a string over the alphabet , this expression can be computed using the generating function approach [15]. Given a spectrum S with S = s1 … sM, consider a directed acyclic graph called an amino acid graph G(V, E, ) with V = {0, …, M} and E = {(i, j)|j − i ∈ Mass(a) for a ∈ }, where the score of a vertex i is defined as si, the probability of an edge is defined as , the score of a path is defined as the sum of scores of its vertices, and the probability of a path is defined as the product of probabilities of its edges. A path in an amino acid graph represents a variant. Therefore, E-value(S, , t) equals to the sum of probabilities of all paths from 0 to M with scores equal or better than t, and can be computed using parametric dynamic programming [15, 26, 36].
While spectral E-values are useful for evaluating statistical significance of individual PSMs (independently of the database), they need to be transformed into E-value(S, , t, N) to take into account the fact that the database search represents “multiple testing” where multiple variants (arising from different database peptides) are scored against a spectrum [37]. E-values can be approximated as follows:
where N is the size of the database. Note that since protein databases contain many repeated peptides, it is important to reflect the effective size of the database that is estimated as the number of unique peptides of certain length.
Estimating FDRs
MS-GF+ estimates FDRs using the target decoy approach [38, 39]. See Supplementary Note 2 for details.
From low-precision to high-precision MS/MS spectra
Mass spectrometers are usually divided into High-precision (denoted by H) and Low-precision (denoted by L) instruments. Depending on whether the precursor and product ions are measured with Low or High-precision, the spectra are divided into LL, LH, HL, and HH spectra (LH spectra are hardly ever used in proteomics studies). While it may appear that extending the generating function approach from LL (as defined in [15]) to HL and HH spectra is a simple matter of tuning parameters that control the error tolerance, the situation is more complex. Here we explain how MS-GF+ takes advantage of high-precision product ion peaks.
Let RMass(a) be the real mass of an amino acid a. For a variant PV = pv1 … pvk, let , RMass(pvi), and RPrecursorMass(S) be the real precursor mass of a spectrum S. We previously assumed that Mass(PV) and PrecursorMass(S) are integers and defined MSGFScore(PV, S) = PV· S if Mass(PV) = PrecursorMass(S) and −∞ otherwise. Note that this condition, while appropriate for LL spectra, is weak for HL and HH spectra, because it may be satisfied even when the real mass RMass(PV) significantly deviates (e.g. up to 0.5 Da) from RPrecursorMass(S). Let represent the condition |a − b| < Δ. To take advantage of accurate precursor masses in HL and HH spectra, the condition Mass(PV) = PrecursorMass(S) has to be redefined to , where Δ is the precursor mass tolerance. The database search problem with this modified definition of MSGFScore, is now described by the following equation:
| (1) |
where SpectraRMass(PV) represents the set of spectra S ∈ Spectra satisfying .
The key part of the generating function approach is the assumption that amino acids have integer masses (otherwise the parametric dynamic programming is difficult to implement). However, rounding amino acid masses to integers introduces errors. These rounding errors reduce after rescaling by 0.9995, making them appropriate for LL and HL spectra. However, for HH spectra, the rounding errors remain too large even after rescaling, prohibiting MS-GF+ from benefiting from precise product ion peaks. A larger rescaling constant could better accommodate the mass accuracy, e.g. the rescaling constant 274.335215 allows one to model spectra with 2.5 ppm accuracy [40]. However, since the time complexity of the generating function algorithm is proportional to the rescaling constant, this rescaling makes computing E-values prohibitively slow.
Here we present a new scoring algorithm taking advantage of the accurate product ion masses while not substantially increasing the running time of MS-GF+. In [26], we introduced an abstract model (seemingly unrelated to mass spectrometry) that described a probabilistic process of transforming a Boolean string (peptide vector) into another Boolean string (spectral vector). This model, while adequate for low-precision spectra, needs to be modified for high-precision spectra. Here we model a peptide as a Boolean string (as before) but model a spectrum as a directed acyclic graph (DAG) and further apply a transformation of a Boolean string into a DAG for scoring real PSMs (see Methods for details).
Our new idea behind the DAG modeling is as follows. Consider peaks at masses 100.01 and 157.4 that will be transformed into integer bins 100 and 157 in the Boolean string representation of the spectrum. After this transformation, we lose information about the exact difference between these two masses. However, in our new spectral DAG model, this information is retained in edges of the spectral DAG and used in the scoring.
Datasets
Overall, we used 19 datasets (≈ 2.83 million spectra from human, yeast, mouse, and Schizosaccharomyces pombe) reflecting the diversity of MS data, corresponding to 17 distinct spectral types shown in Figure 1 (see Methods for details on the datasets). For all these datasets, we benchmarked MS-GF+ against popular tools for peptide identification such as Mascot+Percolator.
Comparison of MS-GF + with Mascot+Percolator
We compared the numbers of identified PSMs at 1% FDR for MS-GF+ and Mascot+Percolator (i.e., PSMs reported by Mascot and re-scored by Percolator). Mascot+Percolator (Mascot version 2.3.02 integrating Percolator) was used for the comparison because it represents a popular choice for peptide identification. We also tested several other tools like SEQUEST, InsPecT [25] and OMSSA but do not report their results because they identified significantly fewer PSMs as compared to Mascot+Percolator. See Supplementary Table 2 for database search parameters.
For all the 19 datasets, MS-GF+ identified significantly more PSMs compared to Mascot+Percolator (Figure 2). Figure 3 (a) shows the benchmarking results for the five human datasets generated with varying fragmentations and instruments [20]. Percolator greatly increased the number of identifications as compared to Mascot, but for all these datasets, MS-GF+ identified significantly more PSMs (17–38%) than Mascot+Percolator (see Supplementary Fig. 1 for Venn diagrams of MS-GF+ and Mascot+Percolator identifications). We also compared the number of identifications reported by the original study [20] which also used Mascot+Percolator along with in-house pre- and post-processing tools. In this comparison, MS-GF+ also showed an improved performance (identifying 16–55% more PSMs).
Figure 2.
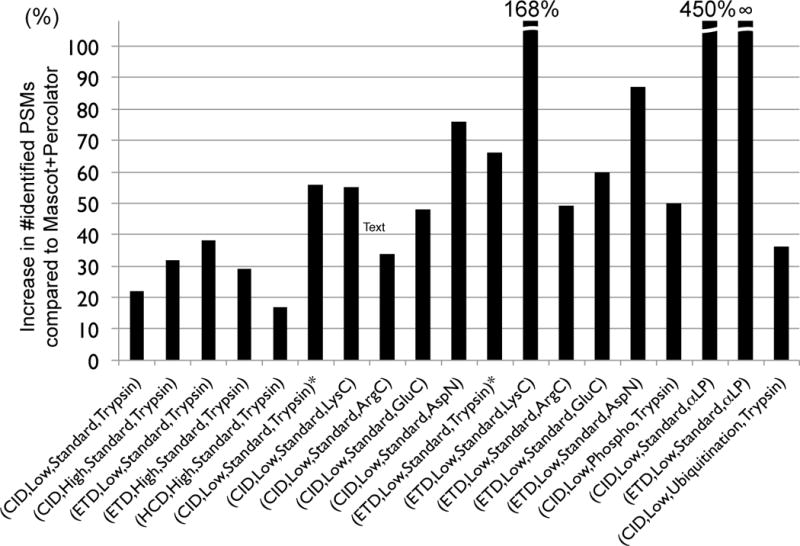
Benchmarking MS-GF+ against Mascot+Percolator. Percent increases in the number of identified PSMs for MS-GF+ compared to Mascot+Percolator for all 19 datasets. Each bar represents a spectral dataset of a specified spectral type. For (CID, Low, Standard, Trypsin) and (ETD, Low, Standard, Trypsin), there are two corresponding datasets, one from human and the other from yeast. We distinguish them by adding ‘*’ to the yeast datasets. For the (CID, Low, Phosphorylation, Trypsin) and (CID, Low, Ubiquitination, Trypsin) datasets, the number of phosphorylated and ubiquitinated PSMs were counted instead of the number of all identified PSMs. For the (ETD,Low,Standard,αLP) dataset, Mascot+Percolator identified no PSM.
Figure 3.
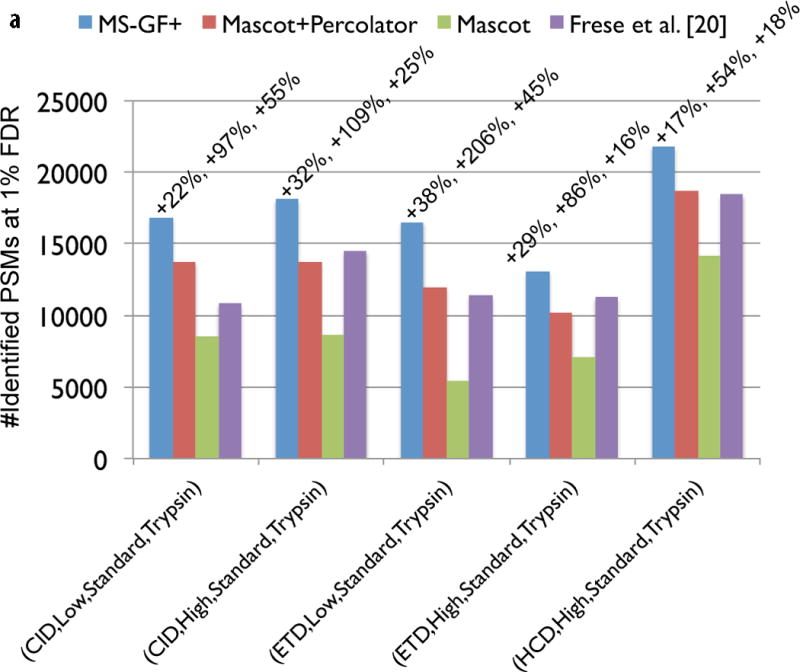
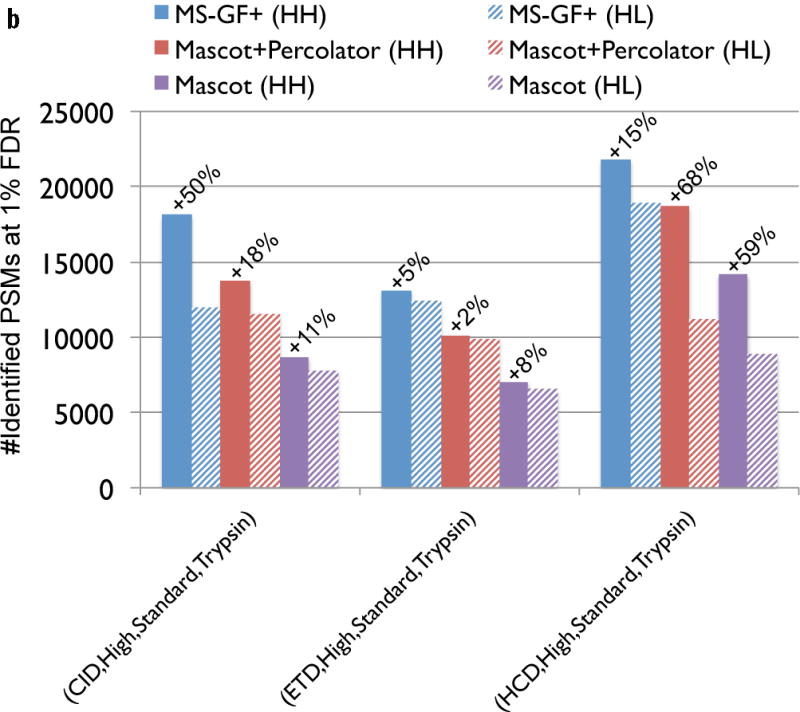
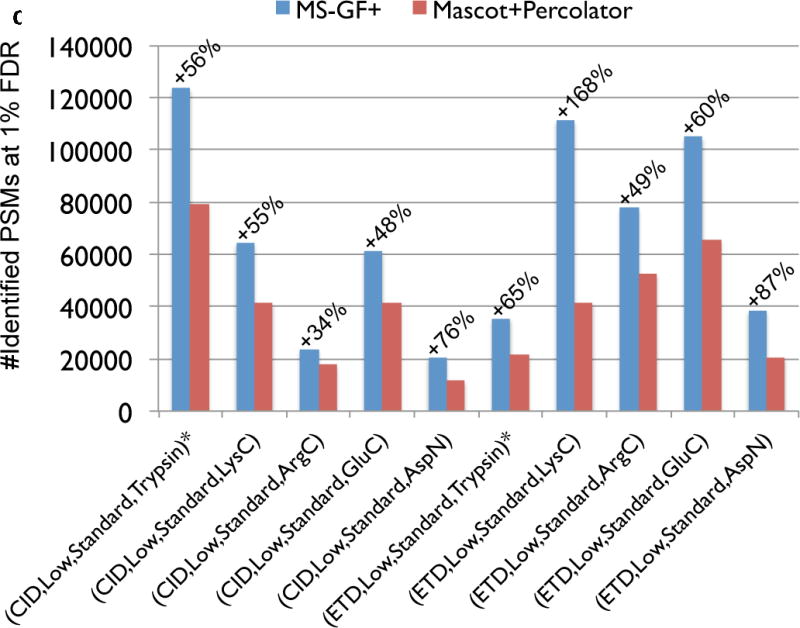
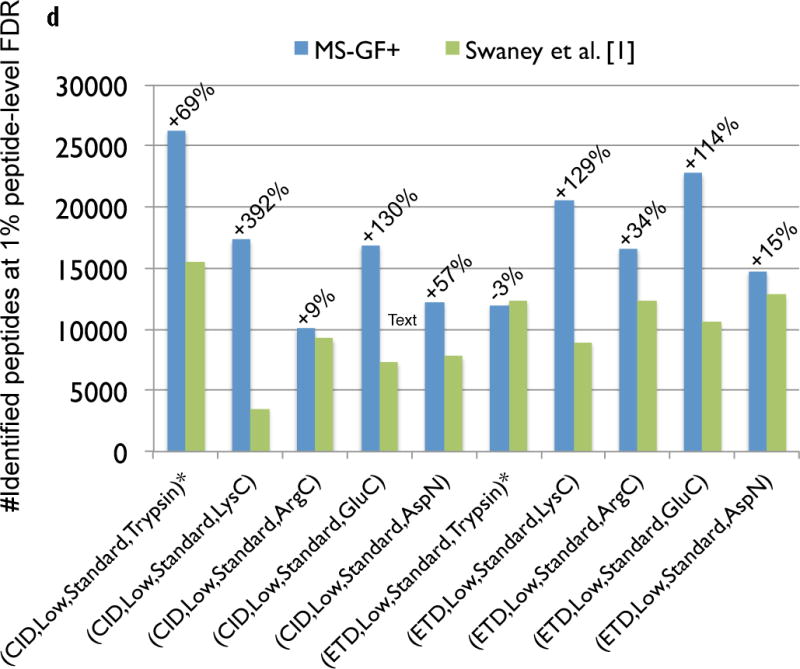
Comparison of MS-GF+ and other tools for diverse spectral types. The numbers of identified PSMs (a–c) or peptides (d) at 1% FDR are shown. Numbers above bars represent the percentages of increase in the number of identifications for MS-GF+ compared to other tools. (a) Results for the human datasets with varying fragmentations and instruments. MS-GF+, Mascot+Percolator, and Mascot results are shown along with the results in [20]. Percolator greatly increased the number of identifications as compared to Mascot, but MS-GF+ outperformed Mascot+Percolator for all the datasets. (b) Increase in the number of identifications due to the availability of high-precision product ion peaks. For the three human datasets representing HH spectra, MS-GF+, Mascot+Percolator, and Mascot were run using search parameters for HL spectra. The results of these searches (denoted by HL) are compared with the numbers of identifications for the regular searches (denoted by HH). HH searches identified more PSMs than HL searches for every tool and every dataset. The difference was larger for CID and HCD than ETD spectra. (c) Results for the yeast datasets with varying fragmentations and enzymes. MS-GF+ and Mascot+Percolator results are shown. MS-GF+ outperformed Mascot+Percolator for all these datasets. (d) Comparison of MS-GF+ and the results in [1] that used OMSSA along with in-house post-processing tools for the yeast datasets. The numbers of (unique) peptides at the peptide-level 1% are shown. In [1], only the number of identified peptides matched to proteins identified at 1% protein-level FDR was counted while for MS-GF+, the number of identified peptides was counted regardless of their matched proteins.
To figure out how each tool benefits from high-precision product ion peaks, for the 3 out of 5 human datasets representing HH spectra, we ran MS-GF+, Mascot+Percolator, and Mascot using the parameters for HL spectra, i.e., using 0.6 Da fragment mass tolerance for Mascot and Mascot+Percolator, and using the scoring model for low-precision spectra for MS-GF+. For every tool, the number of identifications was higher when the parameters for HH spectra were used, but the difference varied depending on the dataset (Figure 3 (b)), and was negligible for ETD spectra.
Figure 3 (c) shows the comparison for the ten yeast datasets generated with varying fragmentations (CID or ETD) and enzymes (Trypsin, LysC, ArgC, GluC, or AspN) [1]. Again, for all these datasets, MS-GF+ identified significantly more PSMs (34–168%) than Mascot+Percolator (Figure 3 (c)). In [1], using OMSSA (and in-house tools for pre- and post-processing), the authors reported the number of identified peptides at 1% peptide-level FDR that are matched to proteins identified at 1% protein-level FDR. We compared these numbers with the numbers of identified peptides at 1% peptide-level FDR using MS-GF+ (Figure 3 (d)). Note that this comparison is unfair because peptide identifications by MS-GF+ were not filtered out according to the protein that they are matched to. However, even after considering that, the results show that for most of the datasets, MS-GF+ identified many more peptides than the original report.
To see whether our scoring model can capture the fragmentation propensities specific to phosphopeptides, we generated a scoring parameter set for (CID, Low, Phosphorylation, Trypsin). For the mouse dataset corresponding to (CID, Low, Phosphorylation, Trypsin), we compared the numbers of identified PSMs for MS-GF+ with and without using the phosphorylation-specific parameter set, Mascot+Percolator, and InsPecT equipped with a dedicated scoring model for (CID, Low, Phosphorylation, Trypsin) [41] (Supplementary Fig. 2 (a)). Interestingly, without phosphorylation-specific scoring parameters, MS-GF+ outperformed both tools, identifying 37% and 44% more PSMs than Mascot+Percolator and InsPecT, respectively. With phosphorylation-specific parameters, MS-GF+ identified 9% more PSMs (and 12% more PSMs of phosphopeptides), confirming that our scoring model successfully captures phosphorylation-specific fragmentation propensities.
A similar result was obtained for a (CID, Low, Ubiquitination, Trypsin) dataset (Supplementary Fig. 3). We emphasize that MS-GF+ does not “know” anything about the peculiarities of the phosphorylation or ubiquitination, and simply trains the scoring parameters in exactly the same way it does for other spectral types. This ability to easily train modification-specific scoring parameters for any modification will greatly benefit MS researchers studying post-translational modifications.
MS-GF+ for identifying peptides produced by a new protease
αLP is a new protease with cleavage specificities somewhat “orthogonal” to trypsin [23]. MS-GF+ was applied to the study of αLP using two S. pombe datasets corresponding to (CID, Low, Standard, αLP) and (ETD, Low, Standard, αLP). We ran Mascot+Percolator, OMSSA, and MS-GF+ by specifying ‘None’ as an enzyme. Since αLP produces peptides with different fragmentation propensities than tryptic peptides, Mascot+Percolator and OMSSA performed very poorly for this novel spectral type. In contrast, MS-GF+ identified 3,535 and 2,829 PSMs from the (CID, Low, Standard, αLP) and (ETD, Low, Standard, αLP) dataset using the scoring parameters for (CID, Low, Standard, Trypsin) and (ETD, Low, Standard, Trypsin), respectively (Supplementary Fig. 2 (b)). The superior performance of MS-GF+ over Mascot+Percolator and OMSSA is because its scoring function is adequate for αLP peptides (correct peptide attains the maximal score) for a large portion of the spectra even when the search space is large (i.e. no enzyme is specified). In fact, for the human dataset corresponding to (ETD, Low, Standard, Trypsin), when no enzyme was specified and precursor mass tolerance 2.5Da was used, MS-GF+ identified 10,937 PSMs, only 34% less as compared to the fully-tryptic search with 7 ppm precursor mass tolerance.
Using the identified PSMs by MS-GF+, we trained scoring parameters for (CID, Low, Standard, αLP) and (ETD, Low, Standard, αLP). When these αLP-specific scoring parameters were used, the number of identified PSMs further increased to 4,788 (+35%) and 3,313 (+17%) for (CID, Low, Standard, αLP) and (ETD, Low, Standard, αLP), respectively, showing the usefulness of MS-GF+ for studies of new proteases.
Thus, αLP represents a new alternative to trypsin, greatly increasing the PTM and protein sequence coverages, but generating spectra with unusual fragmentation propensities. We emphasize that the capabilities of αLP are not obvious when Mascot+Percolator or another tool is used, because it fails to identify αLP peptides. The details on αLP protease have been discussed in a separate paper [23].
Running time of MS-GF+
We measured the running time of MS-GF+ and Mascot+Percolator for LL, HL, and HH spectra for various spectral types. For all the searches, MS-GF+ and Mascot+Percolator showed similar running times (Supplementary Fig. 2 (c,d)).
Discussion
Our analysis and recent independent studies [42, 43, 44, 35] showed that for diverse types of spectral datasets, MS-GF+ identifies more PSMs as compared to existing database search tools like Mascot, X!Tandem, OMSSA, Crux, Comet, and InsPecT, and statistical modeling tools like Percolator. We emphasize that the generating function approach for accurately computing E-values significantly contributes to the improved performance of MS-GF+. For example, when E-values instead of MS-GF scores were used to cut-off the results, the number of identified PSMs increased approximately by 70%, 50%, and 20% for LL, HL, and HH spectra, respectively.
While we focused on demonstrating MS-GF+ as a stand-alone tool, we emphasize that MS-GF+ can be combined with various other proteomics analysis tools. Since we have decided to release MS-GF+ in 2012 well before this paper was prepared for a journal submission, MS-GF+ has already been integrated into the following pipelines and statistical modeling tools: Trans-Proteomics Pipeline [45], Galaxy-P [46], ProteoSuite [47], IDPicker [11], SearchGUI [48], Scaffold [48], ProteoSAFe, Skyline [49], and Percolator [10, 50]. Peptide identification tools that combine the results of multiple database search tools such as MSblender [51], Peptide-Shaker [52], and PepArML [53] also currently support MS-GF+. MS-GF+ is freely available at http://proteomics.ucsd.edu.
Methods
Spectral DAG model
Given an extended alphabet , we first explain how to convert a spectrum S into a labeled DAG G. G = (V, E) has a vertex set V = {0, …, M = PrecursorMass(S)} and an edge set . For simplicity, suppose that the set of ion types ℐ = {(1, 0, 1)} (i.e. only singly charged prefix ions with an of f set zero contribute to the scoring). Given a constant δ called a fragment mass tolerance, two peaks of S with m/z x and y form a duo if y − x is approximately equal to a mass of an amino acid, i.e., . The vertex label si and the edge label si,j of G are defined as follows: si = 1 if there exists a peak of mass x satisfying [0.9995 · x] = i and si = 0 otherwise; si,j = 1, if there exists a duo of peaks with masses x and y such that [0.9995 · x] = i and [0.9995 · y] = j, and si,j = 0 otherwise (see Figure 4 for an example).
Figure 4.
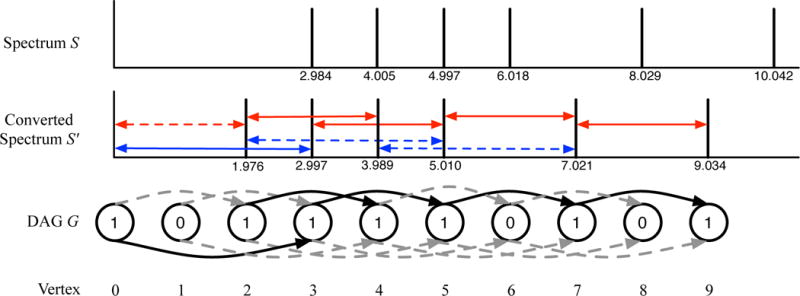
Constructing a Directed Acyclic Graph (DAG) in the case of two “amino acids” with real masses 2.012 and 2.996. Assume that only singly-charged b-ion with a real of f set 1.008 contributes to the scoring. The spectrum S is converted into S′ by shifting each peak by 1.008 to the left. Each arrowed line in S′ represents a pair of peaks separated approximately by 2 Da (blue) or 3 Da (red) that form a duo (solid) or does not form a duo (dashed) for a fragment mass tolerance 0.01 Da. A DAG G is constructed from S′. The number in the vertex represents its label. The color of the edge represents its label (0 for dashed grey and 1 for solid black).
Let P = p1 … pM be a Boolean string representing a peptide. Similar to Kim et al., 2009 [26] where a peptide string generates a spectrum string, we now assume that a peptide string generates a DAG. The probability of a peptide P generating a DAG G is defined as follows:
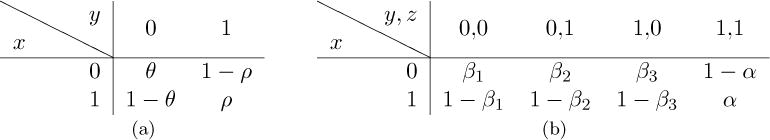
where Prob(x|y) is a 2 × 2 matrix representing the probability of a peptide character y (0 or 1) generating a vertex label x, and Prob(x|y, z) is a 2 × 4 matrix representing the probability of a pair of peptide characters y and z generating an edge label x (Table 1). In practice, β1 ≈ β2 ≈ β3 (see Table 1 (b)).
Table 1.
|
Probability table for generating directed acyclic graphs. (a) Probability Prob(x|y) of a peptide character y generating a vertex lavel x. (b) Probability Prob(x|y, z) of peptide characters generating an edge label x.
When applying this model for scoring a peptide P and a DAG G, we consider a test comparing two hypotheses: one assuming G is generated by P and the other assuming G is generated by an “empty” string consisting of all zeros (denoted by O). The log-likelihood score of (P, G) (denoted Score(P, G)) is defined as follows (see Figure 5 for an example):
| (2) |
Note that the last equation assumes that only the edges (i, j) with pi = pj = 1 contribute to the edge scoring because β1 ≈ β2 ≈ β3.
Figure 5.
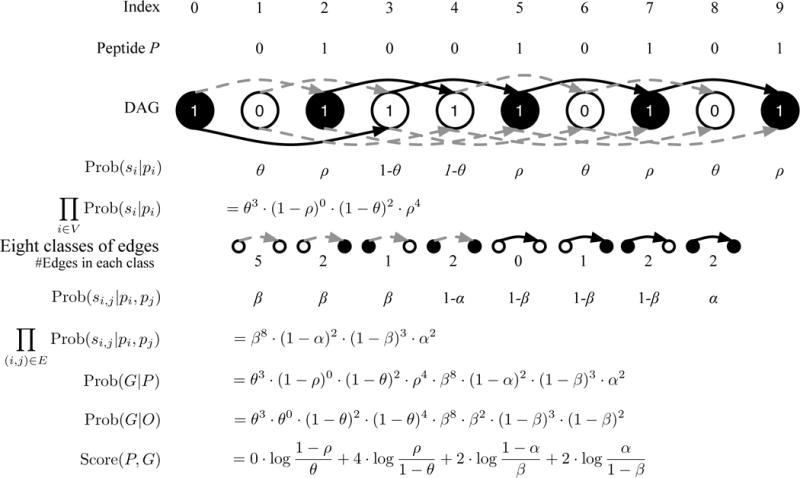
Illustration of the MS-GF+ Directed Acyclic Graph (DAG) scoring. The peptide ABAA is converted into its Boolean string P = 010010101 and the spectrum S is converted into a labeled DAG G as described in the text. The number in the vertex represents its label. The color of the edge represents its label (0 for grey and 1 for black). The vertex i is colored depending on the peptide character i (white for 0 and black for 1). We also color vertex 0 as black. The procedure to compute Score(P, G) is illustrated. All edges are partitioned into 8 classes depending on si,j, pi, and pj. For example, there are 5 edges with si,j = pi = pj = 0.
In practice, we generate multiple DAGs for a single spectrum, one for each ion ∈ ℐ. To generate an ion DAG for ion = (charge, of f set, sign) with a real of f set r of f set, (e.g. real of f set of the singly-charged b-ion is 1.008), we first convert S = {(mz1, rank1), …, (mzl, rankl)} into S′ = {(mass1, rank1), …, (massl, rankl)} using the following transformation:
Each peak of S representing ion corresponds to a peak of this converted spectrum S′ representing an ion type (1, 0, 1). Therefore, the vertex and edge labels of the ion DAG for ion are defined as outlined before, but using S′ instead of S (Figure 4).
In reality, vertex and edge labels in the ion DAGs are integers rather than Boolean values. Given a converted spectrum S′, we first remove all peaks (x, rank) if there exists another peak (x′, rank′) where [0.9995 · x] = [0.9995 · x′] and rank > rank′. The vertex label si is defined as follows: si = rank if there exists a peak (x, rank) satisfying [0.9995 · x] = i and si = 0 otherwise. For an integer m, let AminoAcid(m) be the set of amino acids satisfying Mass(a) = m (e.g. AminoAcid(128) = {Gln, Lys}). The edge label si,j is defined as follows: si,j = [100 · mina∈AminoAcid(j−i)(y − x − RMass(a))] if there exists a duo of peaks with masses x and y such that [0.9995 · x] = i and [0.9995 · y] = j, and si,j = ∞ otherwise. The constant 100 is multiplied to discretize the real-valued errors into bins of size 0.01 Da.
In this ion DAG representation, vertex labels encode the information on the intensities of individual peaks, and the edge labels encode the information on the mass errors of pairs of peaks assuming they represent consecutive peaks of the same ion type. Note that edge labels take into account the spacing between peaks but do not take into account the peak intensities.
Supplementary Note 3 describes how to integrate information from various ion DAGs into a single spectral DAG.
Human datasets with varying fragmentations and instruments
Five human datasets corresponding to the spectral types (CID, Low, Standard, Trypsin), (CID, High, Standard, Trypsin), (ETD, Low, Standard, Trypsin), (ETD, High, Standard, Trypsin), and (HCD, High, Standard, Trypsin) contain 38,401, 33,586, 30,451, 25,734, and 37,810 spectra respectively. These datasets are generated in the Heck laboratory (Utrecht University). HEK293 whole cell lysates were digested by trypsin and analyzed by LTQ-Orbitrap Velos (Thermo Fisher Scientific, Bremen), using combinations of one of the 3 fragmentation modes CID, ETD, and HCD, and either ion trap or Orbitrap readout for product ion m/z. The detailed experimental procedures are described in [20].
Yeast datasets with varying enzymes
Ten yeast datasets corresponding to the spectral types (CID, Low, Standard, Trypsin), (CID, Low, Standard, LysC), (CID, Low, Standard, ArgC), (CID, Low, Standard, GluC), (CID, Low, Standard, AspN), (ETD, Low, Standard, Trypsin), (ETD, Low, Standard, LysC), (ETD, Low, Standard, ArgC), (ETD, Low, Standard, GluC), and (ETD, Low, Standard, AspN), contain 333,203, 278,336, 114,351, 81,669, 251,974, 72,463, 246,428, 204,860, 88,403, and 262,635 spectra, respectively. These datasets were generated in the Coon laboratory (University of Wisconsin Madison). Yeast whole cell lysates were digested separately, with either trypsin, LysC, ArgC, GluC, or AspN, separated into 12 fractions via strong cation exchange (SCX) chromatography and analyzed in triplicate with an ETD-enabled LTQ-Orbitrap mass spectrometer, where peptide fragmentation was accomplished either with CID or ETD using the decision-tree acquisition mode [54]. We downloaded 180 (5 enzymes × 12 fractions × 3 replicates) spectrum files (Thermo RAW format) and converted each raw file into two mgf files one containing CID and the other containing ETD spectra using “msconvert” in ProteoWizard [55] with “no filtering” option. The conversion was unsuccessful for 6 out of 180 files (5 from Arg-C and 1 from Glu-C digests). These 6 files were removed in the further analyses. The detailed experimental procedures are described in [1].
Mouse dataset of phosphopeptides
A mouse dataset corresponding to the spectral type (CID, Low, Phosphorylation, Trypsin) contains 181,093 spectra. This dataset was generated from the Gygi laboratory (Harvard Medical School). Nine mouse organ proteins were digested with trypsin and the resulting peptides were fractionated via SCX. Phosphopeptides were enriched via immobilized metal affinity chromatography and analyzed in duplicates via LC-MS/MS on an LTQ-Orbitrap mass spectrometer. Out of 9 organ tissues analyzed, we used the spectra generated from the brain tissue. The detailed experimental procedures are described in [21].
S. Pombe datasets with αLP digest
Two datasets corresponding to the spectral type (CID, Low, Standard, αLP) and (ETD, Low, Standard, αLP) contain 49,167 spectra each. These datasets were generated in the Komives laboratory (University of California, San Diego). The detailed experimental procedures to generate these datasets are as follows. Wild-type S. pombe cells were lysed in: 50mM Tris-HCl pH: 8.0; 150mM NaCl; 5mM EDTA; 10% Glycerol; 50mM NaF; 0.1mM Na3VO4; 0.2% NP40 and stored at −80°C. The debris was pelleted and then the supernatant was collected. The pellet was extracted according to [56]. Briefly, the pellet was resuspended in 200 ul of 0.1 M NaOH, 0.05 M ETDA, 2% SDS, and 2% beta-mercaptoethanol and incubated at 90°C for 10 minutes. Acetic acid was added to 0.1M and vortexed followed by an additional incubation at 90°C for 10 minutes before clarification by centrifugation and Methanol/chloroform extraction. The pellet was resuspended in 100 mM Tris containing 0.1% sodium deoxycholate with TCEP at 5 mM. Free thiols were capped with n-ethylmaleimide. Excess reagent was removed by ultrafiltration with amicon-4 10 kDa centrifugal devices. The protein was then quantified and exchanged into 6M guanidine for digestion overnight by αLP. The digests were quenched by the addition of formic acid to 1%, followed by desalting by sep-pak (Waters, Milford, MA). Peptides were then fractionated with Electrostatic Repulsion-Hydrophilic Interaction Chromatography [57]. Fractions were assayed for protein concentration using a BCA assay and pooled into 18 fractions of equal protein concentration, evaporated to dryness and resuspended in 100 uL of 0.2% FA. Nano liquid chromatography tandem mass spectrometry (nLC-MS/MS) was performed with a LTQ XL mass spectrometer equipped with ETD. 10 ul of each fraction (≈ 1 ug) was injected onto a 12 cm × 75 um I.D.C18 column prepared in house and eluted in 0.2% FA with a gradient of 5% to 40% ACN over 60 min followed by wash and re-equilibration totaling 90 minutes of MS data per run. The flow was split about 1:500 to a flow rate of about 250 nL/min. A survey scan was followed by data dependent fragmentation of the 4 most abundant ions with both CID and ETD with supplemental activation. The maximum MS/MS ion accumulation time was set to 100 ms. Fragmented precursors were dynamically excluded for 45 seconds with one repeat allowed.
Training scoring parameters
At the beginning of this study, we had 5 scoring parameter sets used in [12] for the following 5 spectral types: (CID, Low, Standard, Trypsin), (CID, Low, Standard, LysN), (ETD, Low, Standard, Trypsin), (ETD, Low, Standard, LysN), and (ETD, Low, Standard, LysC). For this study, we constructed 20 new parameter sets using these 5 parameter sets as a starting point using a newly developed program called ScoringParamGen within the MS-GF+ package. To train scoring parameters for a new spectral type, MS-GF+ was run with an existing parameter set to identify PSMs at 1% FDR threshold, and using the identified PSMs as a training set, a new parameter set was constructed. Supplementary Fig. 4 shows the scoring parameter sets contained in MS-GF+ and how they were constructed. We also tried to construct another generation of parameter sets using the existing parameter sets for the same spectral types, but this “iterative training” hardly changed the number of identified PSMs.
For some datasets, the same dataset was used for both training and testing of the performance, raising concerns about over-fitting. However, as shown in [12], MS-GF+ scoring parameter set characterizes a particular spectral type and is rather stable with respect to specific data sets. For example, for the Human (CID, Low, Standard, Trypsin) dataset, when the scoring parameter set trained from the same dataset was used instead of the dataset used in [12], the number of identified PSMs hardly changed.
Supplementary Material
Acknowledgments
We thank Jesse Meyer and Elizabeth Komives for providing the αLP datasets, Nuno Bandeira, Matthew Monroe, and Taejoon Kwon for providing feedback to improve MS-GF+. This work was supported by US National Institutes of Health grant 1-P41-RR024851 from the National Center for Research Resources.
Footnotes
Contributions
S.K. and P.P. designed the algorithms and the experiments and wrote the manuscript. S.K. implemented the algorithms and performed the data analysis. The authors declare no conflict of interest.
References
- 1.Swaney DL, Wenger CD, Coon JJ. Value of using multiple proteases for large-scale mass spectrometry-based proteomics. J Proteome Res. 2010;9:1323–9. doi: 10.1021/pr900863u. [DOI] [PMC free article] [PubMed] [Google Scholar]
- 2.Eng J, McCormack A, Yates J. An approach to correlate tandem mass spectral data of peptides with amino acid sequences in a protein database. J Am Soc Mass Spectrom. 1994;5:976–89. doi: 10.1016/1044-0305(94)80016-2. [DOI] [PubMed] [Google Scholar]
- 3.Perkins D, Pappin D, Creasy D, Cottrell J. Probability-based protein identification by searching sequence databases using mass spectrometry data. Electrophoresis. 1999;20:3551–67. doi: 10.1002/(SICI)1522-2683(19991201)20:18<3551::AID-ELPS3551>3.0.CO;2-2. [DOI] [PubMed] [Google Scholar]
- 4.Cox J, et al. Andromeda: A peptide search engine integrated into the maxquant environment. J Proteome Res. 2011;10:1794–805. doi: 10.1021/pr101065j. [DOI] [PubMed] [Google Scholar]
- 5.Wenger CD, Coon JJ. A proteomics search algorithm specifically designed for high-resolution tandem mass spectra. Journal of proteome research. 2013;12:1377–86. doi: 10.1021/pr301024c. [DOI] [PMC free article] [PubMed] [Google Scholar]
- 6.Dorfer V, et al. Ms amanda, a universal identification algorithm optimized for high accuracy tandem mass spectra. Journal of proteome research. 2014;13:3679–84. doi: 10.1021/pr500202e. [DOI] [PMC free article] [PubMed] [Google Scholar]
- 7.Sweet SMM, et al. Database search strategies for proteomic data sets generated by electron capture dissociation mass spectrometry. J Proteome Res. 2009;8:5475–84. doi: 10.1021/pr9008282. [DOI] [PMC free article] [PubMed] [Google Scholar]
- 8.Hsieh EJ, Hoopmann MR, Maclean B, Maccoss MJ. Comparison of database search strategies for high precursor mass accuracy ms/ms data. J Proteome Res. 2009;9:1138–43. doi: 10.1021/pr900816a. [DOI] [PMC free article] [PubMed] [Google Scholar]
- 9.Keller A, Nesvizhskii A, Kolker E, Aebersold R. Empirical statistical model to estimate the accuracy of peptide identifications made by ms/ms and database search. Anal Chem. 2002;74:5383–92. doi: 10.1021/ac025747h. [DOI] [PubMed] [Google Scholar]
- 10.Käll L, Canterbury JD, Weston J, Noble WS, Maccoss MJ. Semi-supervised learning for peptide identification from shotgun proteomics datasets. Nat Methods. 2007;4:923–5. doi: 10.1038/nmeth1113. [DOI] [PubMed] [Google Scholar]
- 11.Ma ZQ, et al. Idpicker 2.0: Improved protein assembly with high discrimination peptide identification filtering. Journal of proteome research. 2009;8:3872–81. doi: 10.1021/pr900360j. [DOI] [PMC free article] [PubMed] [Google Scholar]
- 12.Kim S, et al. The generating function of cid, etd, and cid/etd pairs of tandem mass spectra: Applications to database search. Mol Cell Proteomics. 2010;9:2840–52. doi: 10.1074/mcp.M110.003731. [DOI] [PMC free article] [PubMed] [Google Scholar]
- 13.Yates JR, et al. Toward objective evaluation of proteomic algorithms. Nat Methods. 2012;9:455–6. doi: 10.1038/nmeth.1983. [DOI] [PMC free article] [PubMed] [Google Scholar]
- 14.Noble WS, Maccoss MJ. Computational and statistical analysis of protein mass spectrometry data. PLoS Comput Biol. 2012;8:e1002296. doi: 10.1371/journal.pcbi.1002296. [DOI] [PMC free article] [PubMed] [Google Scholar]
- 15.Kim S, Gupta N, Pevzner P. Spectral probabilities and generating functions of tandem mass spectra: A strike against decoy databases. J Proteome Res. 2008;7:3354–63. doi: 10.1021/pr8001244. [DOI] [PMC free article] [PubMed] [Google Scholar]
- 16.Zhou J-Y, et al. Simple sodium dodecyl sulfate-assisted sample preparation method for lc-ms-based proteomics applications. Anal Chem. 2012;84:2862–7. doi: 10.1021/ac203394r. [DOI] [PMC free article] [PubMed] [Google Scholar]
- 17.Dresang LR, et al. Coupled transcriptome and proteome analysis of human lymphotropic tumor viruses: insights on the detection and discovery of viral genes. BMC Genomics. 2011;12:625. doi: 10.1186/1471-2164-12-625. [DOI] [PMC free article] [PubMed] [Google Scholar]
- 18.Wang L, et al. Mapping n-linked glycosylation sites in the secretome and whole cells of aspergillus niger using hydrazide chemistry and mass spectrometry. J Proteome Res. 2012;11:143–56. doi: 10.1021/pr200916k. [DOI] [PMC free article] [PubMed] [Google Scholar]
- 19.Wrighton KC, et al. Fermentation, hydrogen, and sulfur metabolism in multiple uncultivated bacterial phyla. Science. 2012;337:1661–5. doi: 10.1126/science.1224041. [DOI] [PubMed] [Google Scholar]
- 20.Frese CK, et al. Improved peptide identification by targeted fragmentation using cid, hcd and etd on an ltq-orbitrap velos. J Proteome Res. 2011;10:2377–88. doi: 10.1021/pr1011729. [DOI] [PubMed] [Google Scholar]
- 21.Huttlin EL, et al. A tissue-specific atlas of mouse protein phosphorylation and expression. Cell. 2010;143:1174–89. doi: 10.1016/j.cell.2010.12.001. [DOI] [PMC free article] [PubMed] [Google Scholar]
- 22.Starita LM, Lo RS, Eng JK, von Haller PD, Fields S. Sites of ubiquitin attachment in saccharomyces cerevisiae. Proteomics. 2012;12:236–40. doi: 10.1002/pmic.201100166. [DOI] [PMC free article] [PubMed] [Google Scholar]
- 23.Meyer JG, et al. Expanding proteome coverage with orthogonal-specificity-lytic proteases. Molecular & cellular proteomics: MCP. 2014;13:823–35. doi: 10.1074/mcp.M113.034710. [DOI] [PMC free article] [PubMed] [Google Scholar]
- 24.Gupta N, Bandeira N, Keich U, Pevzner PA. Target-decoy approach and false discovery rate: when things may go wrong. J Am Soc Mass Spectrom. 2011;22:1111–20. doi: 10.1007/s13361-011-0139-3. [DOI] [PMC free article] [PubMed] [Google Scholar]
- 25.Tanner S, et al. Inspect: identification of posttranslationally modified peptides from tandem mass spectra. Anal Chem. 2005;77:4626–39. doi: 10.1021/ac050102d. [DOI] [PubMed] [Google Scholar]
- 26.Kim S, Gupta N, Bandeira N, Pevzner P. Spectral dictionaries: Integrating de novo peptide sequencing with database search of tandem mass spectra. Mol Cell Proteomics. 2009;8:53–69. doi: 10.1074/mcp.M800103-MCP200. [DOI] [PMC free article] [PubMed] [Google Scholar]
- 27.Geer LY, et al. Open mass spectrometry search algorithm. J Proteome Res. 2004;3:958–64. doi: 10.1021/pr0499491. [DOI] [PubMed] [Google Scholar]
- 28.Craig R, Beavis RC. Tandem: matching proteins with tandem mass spectra. Bioinformatics. 2004;20:1466–7. doi: 10.1093/bioinformatics/bth092. [DOI] [PubMed] [Google Scholar]
- 29.Côté RG, Reisinger F, Martens L. jmzml, an open-source java api for mzml, the psi standard for ms data. Proteomics. 2010;10:1332–5. doi: 10.1002/pmic.200900719. [DOI] [PubMed] [Google Scholar]
- 30.Griss J, Reisinger F, Hermjakob H, Vizcaíno J. A jmzreader: A java parser library to process and visualize multiple text and xml-based mass spectrometry data formats. Proteomics. 2012;12:795–8. doi: 10.1002/pmic.201100578. [DOI] [PMC free article] [PubMed] [Google Scholar]
- 31.Reisinger F, et al. jmzidentml api: A java interface to the mzidentml standard for peptide and protein identification data. Proteomics. 2012;12:790–4. doi: 10.1002/pmic.201100577. [DOI] [PMC free article] [PubMed] [Google Scholar]
- 32.Martens L, et al. mzml - a community standard for mass spectrometry data. Mol Cell Proteomics. 2010 doi: 10.1074/mcp.R110.000133. [DOI] [PMC free article] [PubMed] [Google Scholar]
- 33.Jones AR, et al. The mzidentml data standard for mass spectrometry-based proteomics results. Mol Cell Proteomics. 2012 doi: 10.1074/mcp.M111.014381. [DOI] [PMC free article] [PubMed] [Google Scholar]
- 34.Granholm V, Noble WS, Käll L. On using samples of known protein content to assess the statistical calibration of scores assigned to peptide-spectrum matches in shotgun proteomics. J Proteome Res. 2011;10:2671–8. doi: 10.1021/pr1012619. [DOI] [PMC free article] [PubMed] [Google Scholar]
- 35.Howbert JJ, Noble WS. Computing exact p-values for a cross-correlation shotgun proteomics score function. Molecular & cellular proteomics: MCP. 2014;13:2467–79. doi: 10.1074/mcp.O113.036327. [DOI] [PMC free article] [PubMed] [Google Scholar]
- 36.Jeong K, Kim S, Bandeira N, Pevzner PA. Gapped spectral dictionaries and their applications for database searches of tandem mass spectra. Mol Cell Proteomics. 2011;10:M110.002220. doi: 10.1074/mcp.M110.002220. [DOI] [PMC free article] [PubMed] [Google Scholar]
- 37.Noble WS. How does multiple testing correction work? Nat Biotechnol. 2009;27:1135–7. doi: 10.1038/nbt1209-1135. [DOI] [PMC free article] [PubMed] [Google Scholar]
- 38.Elias JE, Gygi SP. Target-decoy search strategy for increased confidence in large-scale protein identifications by mass spectrometry. Nat Methods. 2007;4:207–14. doi: 10.1038/nmeth1019. [DOI] [PubMed] [Google Scholar]
- 39.Jeong K, Kim S, Bandeira N. False discovery rates in spectral identification. BMC Bioinformatics. 2012;13(Suppl 16):S2. doi: 10.1186/1471-2105-13-S16-S2. [DOI] [PMC free article] [PubMed] [Google Scholar]
- 40.Liu X, Segar MW, Li SC, Kim S. Spectral probabilities of top-down tandem mass spectra. BMC Genomics. 2014;15(Suppl 1):S9. doi: 10.1186/1471-2164-15-S1-S9. [DOI] [PMC free article] [PubMed] [Google Scholar]
- 41.Payne SH, et al. Phosphorylation-specific ms/ms scoring for rapid and accurate phosphoproteome analysis. J Proteome Res. 2008;7:3373–81. doi: 10.1021/pr800129m. [DOI] [PMC free article] [PubMed] [Google Scholar]
- 42.Stekhoven DJ, Omasits U, Quebatte M, Dehio C, Ahrens CH. Proteome-wide identification of predominant subcellular protein localizations in a bacterial model organism. J Proteomics. 2014;99:123–37. doi: 10.1016/j.jprot.2014.01.015. [DOI] [PubMed] [Google Scholar]
- 43.Risk BA, Edwards NJ, Giddings MC. A peptide-spectrum scoring system based on ion alignment, intensity, and pair probabilities. Journal of proteome research. 2013;12:4240–7. doi: 10.1021/pr400286p. [DOI] [PMC free article] [PubMed] [Google Scholar]
- 44.Lange PF, Huesgen PF, Nguyen K, Overall CM. Annotating n termini for the human proteome project: N termini and n-acetylation status differentiate stable cleaved protein species from degradation remnants in the human erythrocyte proteome. Journal of proteome research. 2014;13:2028–44. doi: 10.1021/pr401191w. [DOI] [PMC free article] [PubMed] [Google Scholar]
- 45.Deutsch EW, et al. A guided tour of the trans-proteomic pipeline. Proteomics. 2010;10:1150–9. doi: 10.1002/pmic.200900375. [DOI] [PMC free article] [PubMed] [Google Scholar]
- 46.Goecks J, Nekrutenko A, Taylor J, Team G. Galaxy: a comprehensive approach for supporting accessible, reproducible, and transparent computational research in the life sciences. Genome Biol. 2010;11:R86. doi: 10.1186/gb-2010-11-8-r86. [DOI] [PMC free article] [PubMed] [Google Scholar]
- 47.Gonzalez-Galarza FF, et al. A critical appraisal of techniques, software packages, and standards for quantitative proteomic analysis. OMICS. 2012;16:431–42. doi: 10.1089/omi.2012.0022. [DOI] [PMC free article] [PubMed] [Google Scholar]
- 48.Vaudel M, Barsnes H, Berven FS, Sickmann A, Martens L. Searchgui: An open-source graphical user interface for simultaneous omssa and x!tandem searches. Proteomics. 2011;11:996–9. doi: 10.1002/pmic.201000595. [DOI] [PubMed] [Google Scholar]
- 49.MacLean B, et al. Skyline: an open source document editor for creating and analyzing targeted proteomics experiments. Bioinformatics. 2010;26:966–8. doi: 10.1093/bioinformatics/btq054. [DOI] [PMC free article] [PubMed] [Google Scholar]
- 50.Granholm V, et al. Fast and accurate database searches with ms-gf+percolator. Journal of proteome research. 2014;13:890–7. doi: 10.1021/pr400937n. [DOI] [PMC free article] [PubMed] [Google Scholar]
- 51.Kwon T, Choi H, Vogel C, Nesvizhskii AI, Marcotte EM. Msblender: A probabilistic approach for integrating peptide identifications from multiple database search engines. J Proteome Res. 2011;10:2949–58. doi: 10.1021/pr2002116. [DOI] [PMC free article] [PubMed] [Google Scholar]
- 52.Kroksveen AC, et al. Cerebrospinal fluid proteome comparison between multiple sclerosis patients and controls. Acta Neurol Scand, Supplc. 2012:90–6. doi: 10.1111/ane.12029. [DOI] [PubMed] [Google Scholar]
- 53.Edwards N. Peparml: A meta-search peptide identification platform for tandem mass spectra. Current Protocols in Bioinformatics. 2013:13.23.1–13.23.23. doi: 10.1002/0471250953.bi1323s44. [DOI] [PMC free article] [PubMed] [Google Scholar]
- 54.Swaney DL, McAlister GC, Coon JJ. Decision tree-driven tandem mass spectrometry for shotgun proteomics. Nat Methods. 2008;5:959–64. doi: 10.1038/nmeth.1260. [DOI] [PMC free article] [PubMed] [Google Scholar]
- 55.Kessner D, Chambers M, Burke R, Agus D, Mallick P. Proteowizard: open source software for rapid proteomics tools development. Bioinformatics. 2008;24:2534–6. doi: 10.1093/bioinformatics/btn323. [DOI] [PMC free article] [PubMed] [Google Scholar]
- 56.von der Haar T. Optimized protein extraction for quantitative proteomics of yeasts. PLoS ONE. 2007;2:e1078. doi: 10.1371/journal.pone.0001078. [DOI] [PMC free article] [PubMed] [Google Scholar]
- 57.Hao P, et al. Novel application of electrostatic repulsion-hydrophilic interaction chromatography (erlic) in shotgun proteomics: comprehensive profiling of rat kidney proteome. J Proteome Res. 2010;9:3520–6. doi: 10.1021/pr100037h. [DOI] [PubMed] [Google Scholar]
- 58.van den Toorn HWP, et al. Rockerbox: analysis and filtering of massive proteomics search results. J Proteome Res. 2011;10:1420–4. doi: 10.1021/pr1010185. [DOI] [PubMed] [Google Scholar]
Associated Data
This section collects any data citations, data availability statements, or supplementary materials included in this article.