

Abstract
Safety concerns have emerged regarding the potential long-lasting effects due to developmental exposure to xenobiotics. The pregnane X receptor (PXR) and constitutive androstane receptor (CAR) are critical xenobiotic-sensing nuclear receptors that are highly expressed in liver. The goal of this study was to test our hypothesis that neonatal exposure to PXR- or CAR-activators not only acutely but also persistently regulates the expression of drug-processing genes (DPGs). A single dose of the PXR-ligand PCN (75 mg/kg), CAR-ligand TCPOBOP (3 mg/kg), or vehicle (corn oil) was administered intraperitoneally to 3-day-old neonatal wild-type mice. Livers were collected 24 h post-dose or from adult mice at 60 days of age, and global gene expression of these mice was determined using Affymetrix Mouse Transcriptome Assay 1.0. In neonatal liver, PCN up-regulated 464 and down-regulated 449 genes, whereas TCPOBOP up-regulated 308 and down-regulated 112 genes. In adult liver, there were 15 persistently up-regulated and 22 persistently down-regulated genes following neonatal exposure to PCN, as well as 130 persistently up-regulated and 18 persistently down-regulated genes following neonatal exposure to TCPOBOP. Neonatal exposure to both PCN and TCPOBOP persistently down-regulated multiple Cyp4a members, which are prototypical-target genes of the lipid-sensor PPARα, and this correlated with decreased PPARα-binding to the Cyp4a gene loci. RT-qPCR, western blotting, and enzyme activity assays in livers of wild-type, PXR-null, and CAR-null mice confirmed that the persistent down-regulation of Cyp4a was PXR and CAR dependent. In conclusion, neonatal exposure to PXR- and CAR-activators both acutely and persistently regulates critical genes involved in xenobiotic and lipid metabolism in liver.
Keywords: neonatal exposure, PXR, CAR, PPARα, drug-processing genes
Liver is the major organ for xenobiotics biotransformation and nutrient homeostasis. Many Phase-I and Phase-II drug-metabolizing enzymes, as well as transporters (together called “drug-processing genes” [DPGs]) are highly expressed in liver (Fu et al., 2016; Parkinson et al., 2013). The expression of DPGs is transcriptionally regulated by nuclear receptors, such as the pregnane X receptor (PXR/Nr1i2) and constitutive androstane receptor (CAR/Nr1i3), which are the major xenobiotic sensors that are activated by a wide range of natural and synthetic compounds (Aleksunes and Klaassen, 2012; Hernandez et al., 2009; Kliewer et al., 2002; Moore et al., 2003). In liver, PXR and CAR trans-activate a large battery of genes involved in xenobiotic biotransformation, including their prototypical target genes CYP3A/Cyp3a and CYP2B/Cyp2b, respectively (Aleksunes and Klaassen, 2012; Gao and Xie, 2010; Salem et al., 2013; Topletz et al., 2013). There are species differences in PXR and CAR between mice and humans. For example, the pregnenolone-16α-carbonitrile (PCN) is a prototypical ligand for PXR in mice, whereas the antibiotic drug rifampicin is a specific activator for PXR in humans. The mouse CAR is activated by the chemical 1,4-bis-[2-(3,5-dichloropyridyloxy)] benzene (TCPOBOP), whereas the human CAR is activated by CITCO (Romano et al., 1986; Swales and Negishi, 2004). In addition to modulate xenobiotic metabolism, PXR and CAR are also involved in the regulation of glucose, fatty acid and lipid metabolism (Gao and Xie, 2010; Wada et al., 2009). However, relatively less is known regarding the exact molecular target(s) that these xenobiotic sensors interact with in intermediary metabolism. The peroxisome proliferator-activated receptor (PPARα) is an important lipid-sensing nuclear receptor that is known to regulate the expression of numerous genes involved in lipid and glucose metabolism (Kassam et al., 2000). The prototypical target genes of PPARα are the CYP4A family members, which are important for the fatty acid oxidation in the endoplasmic reticulum (Sanderson et al., 2009). An absence of PPARα in mice increased lipids and blood pressure, decreased insulin sensitivity, and promoted atherosclerosis (Tordjman et al., 2001).
During liver development, many DPGs display distinct ontogenic expression patterns. For example, CYP1A2 enzyme activity in 1-year-old human is only 50% of adults (Hines and McCarver, 2002). CYP2A6 and CYP2B6 activities are not detectable in humans before birth, but are markedly increased after birth (Hines and McCarver, 2002). The CYP3A7 enzyme is highly expressed in fetal liver microsomes but decreases rapidly during the first week after birth. Conversely, CYP3A4 is minimally expressed before birth but increases rapidly thereafter and reaches 50% of adult levels between 6 and 12 months of age (Hines, 2013; Hines and McCarver, 2002). Regarding transporters, hepatic expression of MRP2, OATP1B1 and OATP1B3 in all pediatric age groups is significantly lower than in adults, whereas MDR1 mRNA expression in fetuses, neonates, and infants is lower than in adults (Mooij et al., 2014). In mouse livers, this distinct ontogenic expression pattern of DPGs has also been characterized (Cui et al., 2012; Lu et al., 2013; Peng et al., 2012, 2013). The unique ontogenic expression of DPGs leads to altered pharmacokinetics and toxicokinetics of chemicals in newborns and children, making them at a much higher risk of adverse drug reactions as compared to adults.
Neonatal exposure to drugs or environmental chemicals have been associated with increased risks of various diseases such as cancer, diabetes, and obesity in adults (Blake et al., 2005; Jirtle and Skinner, 2007). We have recently demonstrated in mouse liver that the inducibility of DPGs at various ages is age-specific following acute exposure to PXR and CAR ligands (Li et al., 2015); however, very little is known on a genomic scale regarding the potential long-lasting effects following the neonatal exposure to xenobiotics that are PXR or CAR activators. It was thought that xenobiotic exposure at neonatal ages may persistently alter the chromatin epigenetic architecture and subsequently alter the expression of genes that are involved in xenobiotic biotransformation and other critical metabolic processes (Chen et al., 2012; Tien et al., 2015). However, a systematic investigation regarding the effect of neonatal CAR activation on expression of DPGs in liver is lacking; there is also little information regarding the potential effect of neonatal activation of PXR on expression of DPGs in liver during and beyond the neonatal period. Therefore, the goal of the present study was to test the hypothesis that neonatal exposure to PXR- and CAR-activators not only produces acute but also persistent changes in the expression of genes involved in xenobiotic and/or intermediary metabolism.
MATERIALS AND METHODS
Chemicals
The 1,4-bis-[2-(3,5-dichloropyridyloxy)] benzene (TCPOBOP) and pregnenolone-16α-carbonitrile (PCN) were purchased from Sigma-Aldrich (St Louis, Missouri).
Animals
Eight-week-old wild-type (WT) C57BL/6J mouse breeders were purchased from Jackson Laboratories (Bar Harbor, Maine). Breeder pairs of PXR-null mice on the C57BL/6 background were kindly provided by Dr. Frank Gonzalez (National Cancer Institute, Bethesda, Maryland). Breeder pairs of the CAR-null mice in the C57BL/6 background were obtained from Amgen (Thousand Oaks, California). The PXR-null and CAR-null mice were described previously (Aleksunes and Klaassen, 2012), and were backcrossed 10 generations in the C57BL/6 background. Mice were housed according to the American Animal Association Laboratory Animal Care Guidelines, and were bred under standard conditions at the University of Washington. All animals were given ad libitum access to water and irradiated Picolab Rodent Diet 20 number 5053 (PMI Nutrition International, Brentwood, Missouri). At 3 days of age, the offspring of WT mice were intraperitoneally injected with a single dose of the prototypical PXR activator PCN (75 mg/kg), the CAR activator TCPOBOP (3 mg/kg), or vehicle (corn oil, 10 ml/kg); the offspring of PXR-null mice were injected with PCN or corn oil; and the offspring of CAR-null mice were injected with TCPOBOP or corn oil, following the same dosing regimen, as described in Figure 1A. A single dose of PCN (75 mg/kg) was selected and TCPOBOP (3 mg/kg) was selected as the model ligands for PXR and CAR activation in 3-day-old mice because this dose has been used in newborn and adult mice in other publications (Chen et al., 2012; Cui et al., 2009; Diwan et al., 1992; Ghaffari et al., 2011; Lickteig et al., 2016; Romano et al., 1986; Wagner et al., 2005; Wei et al., 2000). Newborn mice from different litters were randomly assigned to different treatment groups. For each treatment group, the neonatal mice from at least 3 litters were collected. Livers were collected 24 h post-dose (day 3) or from 60-day-old adult mice (day 60), immediately frozen in liquid nitrogen, and stored at −80 °C. The 60-day age was selected based on the previous findings of the ontogeny of drug-processing genes, when the liver has grown to a mature metabolic organ (Peng et al., 2012; Tien et al., 2015). To avoid the complication of estrous cycles in females, only male pups were used in the present study (n = 3–5 per group). All animal procedures were approved by the Institutional Animal Care and Use Committee at the University of Washington.
FIG. 1.

A, Study design. B, Serum alanine aminotransferase (ALT) level in the blood of wild-type (WT) mice (at both day 3 and day 60) after neonatal exposure to corn oil, 1,4-bis-[2-(3,5-dichloropyridyloxy)] benzene (TCPOBOP) or pregnenolone-16α-carbonitrile (PCN). C, The Venn diagram of genes that were commonly or uniquely differently expressed by PCN or TCPOBOP at 3-day of age in the livers of WT mice. D, The Venn diagram of genes that were commonly or uniquely differentially expressed by PCN or TCPOBOP at 60-day of age in the livers WT mice (differentially expressed genes are defined as >2-fold change and adjusted P <0.05).
Total RNA isolation
Total RNA was extracted from frozen livers using RNAzol Bee reagent (Tel-Test lnc., Friendswood, Texas) according to the protocol of the manufacturer. For the newborn mice (day 3), total RNA was extracted using the whole liver, whereas for the adult mice (day 60), total RNA was extracted from a randomly selected section of liver (around 30–50 mg of frozen liver). RNA concentration was quantified using a NanoDrop Spectrophotometer (Thermo Scientific, Wilmington, Delaware) at 260 nm. The integrity of each RNA sample was evaluated by formaldehyde agarose gel electrophoresis to visualize the 18S and 28S rRNA bands. For the microarray study, the RNA quality was confirmed using an Agilent 2100 Bioanalyzer (Agilent Technologies Inc., Santa Clara, California), and the samples with RNA Integrity Number (RIN) above 8.0 were used.
Microarray and data analysis
Gene expression profiling in livers of 3- and 60-day-old WT mice that were treated with corn oil, PCN, or TCPOBOP at 3 days of age were performed by the Functional Genomics Core Facility at the University of Washington using the Affymetrix Mouse Transcriptome Array 1.0. Three biological replicates per group were hybridized to individual arrays. The raw fluorescence data in CEL files were processed for quality assessment using the Affymetrix Expression ConsoleTM Software 1.4 incorporating the Robust Multi-array Average (RMA) normalization algorithm. According to the quality control metrics, the fluorescence signal intensity across the probes for each array exhibited similar distributions. The log-transformed expression levels of each gene in each array to its median value across all the arrays were below 0.5, indicating the absence of outliers in the dataset. The area-under-the-curve of positive versus negative controls was above 0.8 for all arrays, which reflect the robustness of the array quantification.
The CHP files generated from Affymetrix Expression Console were analyzed using the Transcriptome Analysis Console (TAC) 3.0 to determine the differential expression, based on the adjusted ANOVA P-value (<.05) and a fold-change >2 between the comparison groups. Genes that were differentially expressed were plotted in a Venn diagram, to identify the common and uniquely expressed genes for each treatment (PCN or TCPOBOP) at either day 3 or day 60. A 2-way hierarchical clustering dendrogram (Ward’s minimum variance method, distance scale) was conducted on the DPGs that were differentially expressed in the PCN- or TCPOBOP-treated group compared with the corn oil-treated group of the same age, using JMP 12.0 software (SAS Institute, Cary, North Carolina). Functional and pathway analysis of differentially expressed genes was performed using the Core Analysis feature of Ingenuity Pathway Analysis (IPA, Ingenuity Systems), and the top signaling networks were determined.
RT-qPCR quantification of DPGs
DPGs that were differentially regulated by PCN or TCPOBOP at either day 3 or day 60 were confirmed by RT-qPCR in both the WT and the receptor (PXR or CAR) knockout mice. The total RNAs of male mouse livers from WT, PXR-null, or CAR-null mice collected at day 3 and day 60 (n= 3–5 per group) were reverse-transcribed into cDNAs using the High Capacity cDNA Reverse Transcription Kit (Life Technologies, California). The resulting cDNA products were amplified by qPCR, using the Sso Advanced Universal SYBR Green Supermix in a Bio-Rad CFX384 Real-Time PCR Detection System (Bio-Rad, Hercules, California). The primers for all qPCR reactions were synthesized by Integrity DNA Technologies (Coralville, Iowa), and primer sequences are shown in Supplemental Table 3. Data are expressed as % of the expression of the housekeeping gene β-actin.
Western blotting
The liver homogenates were prepared using sucrose-tris buffer (250 mM sucrose, 10 mM Tris base, pH 7.5) with protease inhibitors. The crude membranes were prepared as described previously (Aleksunes et al., 2006), from WT, PXR-null, and CAR-null mice at 60-day of age. The protein concentrations were determined using the Qubit Protein Assay Kit (Thermo Fisher Scientific, Grand Island, New York) according to the instructions of the manufacturer. The samples (50 μg of protein) were subjected to polyacrylamide gel electrophoresis and transferred onto a polyvinylidene difluoride (PVDF) membrane. The membranes were blocked in phosphate-buffered saline with 0.05% Tween 20 (PBST) with 5% non-fat dry milk for 1 h and incubated overnight with one of the following primary antibodies diluted in PBST with 1% non-fat dry milk: (1) rabbit anti-mouse Cyp2b10 (AB9916, 1:5000, EMD Millipore, Billerica, Massachusetts); (2) goat anti-mouse Cyp4a14 (SC-46087, 1:500, Santa Cruz, Dallas, Texas). Primary antibody against mouse β-actin (ab8227, 1:1000) and Histone H3 (ab72079, 1:500) were purchased from Abcam (Cambridge, Massachusetts) and used as loading controls. Membranes were then incubated with a horseradish peroxidase (HRP)-linked species-appropriate secondary antibody at 1:2000 (Sigma Aldrich, St. Louis, Missouri). Proteins were detected using the Novex ECL Chemiluminescent Substrate Reagent Kit (Life Technologies, Carlsbad, California). Intensities of the protein bands were quantified using the Image J Software (National Institutes of Health, Bethesda, Maryland).
Enzyme activities
The P450 enzyme activities in liver microsomes of WT, PXR-null, and CAR-null mice at 60-day of age were quantified using the P450-GloTM Screening system (Promega, Madison, Wisconsin). Briefly, the liver microsomes were isolated using differential centrifugation as described previously (Pelkonen et al., 1974). Frozen liver samples were weighed and transferred to a Teflon pestle/glass homogenizer with 5 volumes (w/v) ST buffer (250 mM sucrose, 10mM Tris base, pH 7.5) containing protease inhibitor cocktail (1:100). The homogenates were centrifuged at 10 000 g for 10 min at 4 °C. The supernatants were transferred to clean centrifuge tubes and centrifuged at 100 000 g for 60 min at 4 °C. The pellets were washed with 1 ml ST buffer, and dissolved in 100 μl of ST buffer with protease inhibitor. P450 reactions (50 μl) were performed in white opaque 96-well plates. Briefly, a luminogenic P450-GloTM substrate (3 μM Luciferin-2B6 for CYP2B/Cyp2b, and 50 μM Luciferin-4A for CYP4A/Cyp4a) was incubated at 37 °C with 10 μg of liver microsomal protein, or negative control membrane (devoid of CYP activity) for 10 min. The reactions were initiated by adding the NADPH-regeneration system and incubating for 10 min. At the end of the incubation, an equal volume of the luciferin detection reagent (50 μl) was added at room temperature, and luminescence was quantified 20 min later using a GlomaxTM 96 Microplate Luminometer (Promega Corporation, Madison, Wisconsin). The magnitude of the luminescent signal is dependent on and directly proportional to the amount of luciferin product generated by the P450 reaction.
Serum alanine aminotransferase, serum, and hepatic triglyceride quantification
Serum samples were analyzed by standard enzymatic-colorimetric assays using alanine aminotransferase (ALT) and triglyceride (TG) kits according to the protocols of the manufacturer (Pointe Scientific, Canton, MI). The absorbance was quantified spectrophotometrically at wavelengths of 340 and 540 nm, respectively. Hepatic TGs were extracted using 100 mg frozen livers from WT (corn oil, TCPOBOP, PCN), CAR-null (corn oil, TCPOBOP), and PXR-null (corn oil, PCN) mice at 60-day of age. The liver tissues were homogenized in ice cold isopropanol, and then centrifuged at 2000 × g for 10 min at 4 °C. The TG content was collected from the supernatant and quantified according to the manufacturer’s protocols (Pointe Scientific, Canton, MI).
Chromatin immunoprecipitation
Chromatin immunoprecipitation (ChIP) was performed using approximately 200 mg of frozen livers from WT mice (corn oil, TCPOBOP, PCN) at 60-day of age, using the MAGnify Chromatin Immunoprecipitation System (Life Technologies, Grand Island, New York) with minor modifications. Briefly, livers were finely minced into less than 1 mm3 cubes using razor blades in cold 1 × Dulbecco’s Phosphate-Buffered Saline (D-PBS) in a sterile 10 cm culture dish on ice, and transferred into an ice-cold Dounce homogenizer (VWR International, Radnor, Pennsylwania) to further grind the liver into a homogenous solution with a glass pestle. Samples were subjected to cross-linking using freshly prepared formaldehyde (a final concentration of 1%), and were rotated for 20 min at room temperature using an ELMI Intelli Mixer (ELMI Company, Riga, Latvia). The cross-linking was quenched with glycine (a final concentration of 0.125 M) with rotation for 5 min at room temperature, followed by centrifugation to collect the pellets. The pellets were washed with cold D-PBS, and re-suspended using cold ChIP lysis buffer with a protease inhibitor cocktail (Sigma Aldrich, St. Louis, Missouri), rotated at 4 °C for 15 min, and centrifuged to obtain the pellets. The pellets were re-suspended in ChIP nuclear lysis buffer with protease inhibitors, and incubated on ice for 15 min. Chromatin was then fragmented into 300–500 bp average size-range using a Bioruptor UCD200 connected to a water-cooling system (Diagenode, Denville, New Jersey). The sonication condition was 10 × (30 s on + 30 s off) at 4 °C, and was repeated after 10 min cool-down, at the highest intensity. The fragment size was confirmed by electrophoresis. ChIP-grade antibodies, namely NB600-636 (Novus Biologicals, Littleton, Colorado) for PPARα and MMS-126R for RNA polymerase II (Covance, Emeryville, California) were used for immunoprecipitation. An IgG antibody (ab18413, Abcam, Cambridge, Massachusetts) was used as a negative control. The immunoprecipitation procedures are described in detail per the protocol of the manufacturer (MAGnify Chromatin Immunoprecipitation System, Life Technologies, Grand Island, New York).
ChIP-qPCR primer design and qPCR reactions
Positive PPARα-genomic DNA binding sites were obtained by re-analyzing the ChIP-Seq data in control WT male mouse livers from a previous publication (Lee et al., 2014). Nuclear-receptor enrichment peaks were visualized by the Integrated Genome Viewer (IGV) (Robinson et al., 2011). The qPCR primers were designed around the targeted motifs using NCBI Primer Design Tool (http://www.ncbi.nlm.nih.gov/tools/primer-blast/), and their specificities were confirmed using UCSC BLAT (https://genome.ucsc.edu/cgi-bin/hgBlat?command=start). The promoter sequences of Cyp4a clusters were retrieved using the Mammalian Promoter Database (MPromDb, Gupta et al., 2011). The qPCR primers for RNA-Pol-II were designed using the queried promoter sequences. Real-time qPCR reactions of the ChIP DNA were performed using SsoAdvanced Universal SYBR Green Supermix in a Bio-Rad CFX384 Real-Time PCR Detection System (Bio-Rad, Hercules, California). The qPCR primer sequences, targeted genomic regions, as well as putative motifs have been described in a previous publication (Selwyn et al., 2015).
Statistical analysis
Data are presented as mean ± SEM. Differences among multiple groups were determined using an analysis of variance (ANOVA) followed by Duncan’s Post Hoc test (P <.05).
RESULTS
Global Changes in Gene Expression Profiles Following Neonatal PXR or CAR Activation
As described in the study design (Figure 1A), to determine the acute and the potentially persistent alterations in the expression of hepatic transcriptome following neonatal PXR or CAR activation, a single dose of corn oil (CO), PCN or TCPOBOP was intraperitoneally injected to mice at 3-day of age, and the livers were collected 24 h post-dose (day 3) or from adult mice at 60 days of age (day 60). The serum ALT levels were within the normal range for all groups, indicating that there were no apparent hepatic injuries (Figure 1B).
The differential gene expression was determined using the Affymetrix Mouse Transcriptome 1.0 Array. A total of 65 956 transcripts were detected in the microarray analysis. As compared with the vehicle-treated group of the same age, neonatal exposure to PCN altered the expression of 913 genes in WT mouse livers at day 3, whereas neonatal exposure to TCPOBOP altered the expression of 420 genes (Figure 1C). Among the differentially regulated genes 24 h after exposure to PCN or TCPOBOP, 159 genes were co-regulated by both PCN and TCPOBOP; whereas 754 genes were uniquely regulated by PCN, and 261 genes were uniquely regulated by TCPOBOP (Figure 1C). Interestingly, at day 60, there were 37 and 148 genes of which the differential regulation persisted following neonatal exposure to PCN and TCPOBOP, respectively. Among these persistently regulated genes in adult liver, there were 4 genes that were co-regulated by neonatal exposure to both PCN and TCPOBOP, whereas 33 genes were uniquely regulated by PCN, and 144 genes were uniquely regulated by TCPOBOP (Figure 1D). Together these data indicated that neonatal exposure to PCN or TCPOBOP produced not only acute but also persistent changes in the gene expression of mouse livers during development.
In livers of 3-day-old mice, there were 464 up-regulated and 449 down-regulated genes 24 h after PCN exposure (Table 1). Ingenuity Pathway Analysis (IPA) identified that at day 3, the differentially regulated genes 24 h after PCN exposure were mainly related to (1) drug metabolism, lipid metabolism, small molecule biochemistry; (2) energy production, lipid metabolism, small molecule biochemistry; (3) endocrine system development and function, small molecule biochemistry, and lipid metabolism; (4) carbohydrate metabolism; and (5) RNA post-transcriptional modification, cell-to-cell signaling and interaction, skeletal and muscular system development, and function (Supplemental Table 1). In contrast, in livers of 60-day-old adult mice, there were 15 persistently up-regulated genes and 22 persistently down-regulated genes following neonatal exposure to PCN (Table 1). According to the IPA analysis, the majority of these genes were involved in the following IPA networks: (1) connective tissue disorders, inflammatory disease, skeletal, and muscular disorders; (2) cancer, organismal injury and abnormalities, reproductive system diseases; (3) hematological system development and function, inflammatory response, tissue morphology; (4) hereditary disorder, neurological disease, cancer; and (5) cell cycle, cell death and survival, cellular assembly and organization (Supplemental Table 1). The IPA Top Tox (Toxicological) lists of PCN exposure revealed several events persistently occurring throughout development, such as fatty acid metabolism, cytochrome P450 panel, and lipopolysaccharide (LPS)/interleukin-1 (IL-1) mediated inhibition of retinoid X receptor (RXR) function. PCN-regulated gene alteration was also linked to Nrf2-mediated oxidative stress response at day 3, whereas at day 60, it appeared to be highly correlated with acute renal failure panel (Supplemental Table 2).
TABLE 1.
Genes Differentially Expressed by Neonatal Exposure to PCN or TCPOBOP in the Livers of 3-day-old and 60-day-old WT Mice (with >2-Fold Change and Adjusted P < 0.05)
| Age (Days) | Comparison | Number of Genes Up-regulated | Number of Genes Down-regulated | Total Number of Gene Change |
|---|---|---|---|---|
| 3 | PCN vs CO | 464 | 449 | 913 |
| 3 | TCPOBOP vs CO | 308 | 112 | 420 |
| 60 | PCN vs CO | 15 | 22 | 37 |
| 60 | TCPOBOP vs CO | 130 | 18 | 148 |
In livers of 3-day-old mice, there were 308 up-regulated genes and 112 down-regulated genes 24 h after TCPOBOP exposure. Ingenuity pathway analysis identified that the top differentially regulated genes 24 h after TCPOBOP exposure were involved in (1) drug metabolism, lipid metabolism, small molecule biochemistry; (2) molecular transport; 3) endocrine system development and function; and (4) cellular development, cellular growth and proliferation, digestive system development, and function (Supplemental Table 1). The Top Tox lists of TCPOBOP exposure shared a great similarity with those shown in the PCN-treated group in 3-day-old mouse livers (Supplemental Table 2). In contrast, in livers of 60-day-old adult mice, there were 130 persistently up-regulated genes and 18 persistently down-regulated genes following neonatal exposure to TCPOBOP (Table 1). The differentially regulated genes at day 60 were highly related to (1) gene expression, lipid metabolism, small molecular biochemistry; and (2) cancer, hematological disease, and immunological disease (Supplemental Table 1). The Top Tox lists of TCPOBOP exposure at day 60 included glutathione depletion-hepatocellular hypertrophy, cytochrome P450 panel, Nrf2-mediated oxidative stress response, and LPS/IL-1 mediated inhibition of RXR function (Supplemental Table 2). Data are available from the Dryad Digital Repository: http://dx.doi.org/10.5061/dryad.0k90t
Comparative Analysis of Gene Expression Between PCN and TCPOBOP
Considering that PXR and CAR have been shown to share some common target genes in xenobiotic and drug metabolism, it was of interest to identify those genes that were co-regulated by both TCPOBOP and PCN in the same or opposite direction (referred as “common”), and the genes that were regulated by PCN or TCPOBOP only (referred as “unique”). In each category, the top 10 up-regulated or down-regulated genes are listed in Table 2 (day 3) and Table 3 (day 60) according to their fold change (using PCN-induced fold change for the common genes).
TABLE 2.
Top 10 Genes that were Uniquely Regulated by PCN, Uniquely Regulated by TCPOBOP, or Regulated by both PCN and TCPOBOP at 3-Day of Age in the Livers of WT Mice (with >2-Fold Change and Adjusted P <0.05)
| Comparison Group | Regulation | Gene Symbol | Description |
|---|---|---|---|
| PCN vs CO TCPOBOP vs CO (common) | Up-regulated | Cyp2c55 | Cytochrome P450, family 2, subfamily c, polypeptide 55 |
| Gstm3 | Glutathione S-transferase, mu 3 | ||
| Prom1 | Prominin 1 | ||
| Cyp2b10 | Cytochrome P450, family 2, subfamily b, polypeptide 10 | ||
| Inmt | Indolethylamine N-methyltransferase | ||
| Serpina6 | Serine (or cysteine) peptidase inhibitor, clade A, member 6 | ||
| Prg4 | Proteoglycan 4 | ||
| Sult2a5 | Sulfotransferase family 2A, member 5 | ||
| Sulf2 | Sulfatase 2 | ||
| Slfn9 | Schlafen 9 | ||
| Down-regulated | Mup2; Mup1 | Major urinary protein 2; major urinary protein 1 | |
| Mup7 | Major urinary protein 7 | ||
| Mup10; Mup19 | Major urinary protein 10; major urinary protein 19 | ||
| Mup1 | Major urinary protein 1 | ||
| Cyp4a32 | Cytochrome P450, family 4, subfamily a, polypeptide 32 | ||
| Prok1 | Prokineticin 1 | ||
| Mup19; Mup16; Mup9 | Major urinary protein 19; major urinary protein 16; major urinary protein 9 | ||
| Mup19; Mup13 | Major urinary protein 19; major urinary protein 13 | ||
| Cyp4a10; Cyp4a31 | Cytochrome P450, family 4, subfamily a, polypeptide 10 or 31 | ||
| Mup12 | Major urinary protein 12 | ||
| Up-regulated by TCPOBOP, down-regulated by PCN | Cyp2c54 | Cytochrome P450, family 2, subfamily c, polypeptide 54 | |
| Zim1 | Zinc finger, imprinted 1 | ||
| PCN vs CO (unique) | Up-regulated | Ces2a | Carboxylesterase 2A; carboxylesterase 6 |
| Cyp2a5; Cyp2a4 | Cytochrome P450, family 2, subfamily a, polypeptide 5 or 4 | ||
| Sult2a2 | Sulfotransferase family 2A | ||
| G0s2 | G0/G1 switch gene 2 | ||
| Akr1b7 | Aldo–keto reductase family 1, member B7 | ||
| Cyp2a4 | Cytochrome P450, family 2, subfamily a, polypeptide 4 | ||
| Il13ra1 | Interleukin 13 receptor, alpha 1 | ||
| Gpt2 | Glutamic pyruvate transaminase 2 | ||
| Pbk | PDZ binding kinase | ||
| Baat | Bile acid-Coenzyme A: amino acid N-acyltransferase | ||
| Down-regulated | Mbl2 | Mannose-binding lectin (protein C) 2 | |
| Apol7a | Apolipoprotein L 7a | ||
| Qpct | Glutaminyl-peptide cyclotransferase (glutaminyl cyclase) | ||
| Tdo2 | Tryptophan 2,3-dioxygenase | ||
| Acot3 | Acyl-CoA thioesterase 3 | ||
| Etnppl | Ethanolamine phosphate phospholyase | ||
| Hsd17b11 | Hydroxysteroid (17-beta) dehydrogenase 11 | ||
| Ugt3a2 | UDP glycosyltransferases 3 family, polypeptide A2 | ||
| Cyp2f2 | Cytochrome P450, family 2, subfamily f, polypeptide 2 | ||
| Cyp4a14 | Cytochrome P450, family 4, subfamily a, polypeptide 14 | ||
| TCPOBOP vs CO (unique) | Up-regulated | Cyp2c50 | Cytochrome P450, family 2, subfamily c, polypeptide 50 |
| Ugt2b36 | UDP glucuronosyltransferase 2 family, polypeptide B36 | ||
| Pnliprp1 | Pancreatic lipase related protein 1 | ||
| A2m | Alpha-2-macroglobulin | ||
| Ces1g | Carboxylesterase 1G; carboxylesterase 1 | ||
| Dio1 | Deiodinase, iodothyronine, type I | ||
| Tmem86b | Transmembrane protein 86B | ||
| Cyp8b1 | Cytochrome P450, family 8, subfamily b, polypeptide 1 | ||
| Sult1d1 | Sulfotransferase family 1D, member 1 | ||
| Orm1 | Orosomucoid 1 | ||
| Down-regulated | Gzma | Granzyme A | |
| Krt23 | Keratin 23 | ||
| Inhbe | Inhibin beta E | ||
| Ak4 | Adenylate kinase 4; adenylate kinase 3 alpha-like 1 | ||
| Csad | Cysteine sulfinic acid decarboxylase | ||
| Dak | Dihydroxyacetone kinase 2 homolog (yeast) | ||
| Hsd17b6 | Hydroxysteroid (17-beta) dehydrogenase 6 | ||
| Tff3 | Trefoil factor 3, intestinal | ||
| Hamp2 | Hepcidin antimicrobial peptide 2 | ||
| Hamp | Hepcidin antimicrobial peptide |
TABLE 3.
Gene Expression Changes that were Uniquely Regulated by PCN, Uniquely Regulated by TCPOBOP, or Regulated by Both PCN and TCPOBOP at 60-Day of Age in the Livers of WT Mice (with >2-Fold Change and Adjusted P <0.05)
| Comparison Group | Regulation | Gene Symbol | Description |
|---|---|---|---|
| PCN vs CO TCPOBOP vs CO (common) | Up-regulated | Cyp2b13 | Cytochrome P450, family 2, subfamily b, polypeptide 13 |
| Down-regulated | Cyp4a10; Cyp4a31 | Cytochrome P450, family 4, subfamily a, polypeptide 10 or 31 | |
| Afp | Alpha fetoprotein | ||
| Up-regulated by TCPOBOP, down-regulated by PCN | Serpinb1a | Serine (or cysteine) peptidase inhibitor, clade B, member 1a | |
| PCN vs CO (Unique) | Up-regulated | Cxcl1 | Chemokine (C-X-C motif) ligand 1 |
| Mir378c | microrna mir-378c | ||
| Saa2 | Serum amyloid A 2 | ||
| Saa1 | Serum amyloid A 1 | ||
| Zbtb16 | Zinc finger and BTB domain containing 16 | ||
| Steap4 | STEAP family member 4 | ||
| Dbp | D site albumin promoter binding protein | ||
| Asns | Asparagine synthetase | ||
| Down-regulated | Irs2 | Insulin receptor substrate 2 | |
| Cyp4a31 | Cytochrome P450, family 4, subfamily a, polypeptide 31 | ||
| Igfbp1 | Insulin-like growth factor binding protein 1 | ||
| Osgin1 | Oxidative stress induced growth inhibitor 1 | ||
| Igfbp2 | Insulin-like growth factor binding protein 2 | ||
| Npas2 | Neuronal PAS domain protein 2 | ||
| Cyp4a32 | Cytochrome P450, family 4, subfamily a, polypeptide 32 | ||
| Arntl | Aryl hydrocarbon receptor nuclear translocator-like | ||
| Cyp4a14 | Cytochrome P450, family 4, subfamily a, polypeptide 14 | ||
| TCPOBOP vs CO (Unique) | Up-regulated | Cyp2b10 | Cytochrome P450, family 2, subfamily b, polypeptide 10 |
| Cyp2c55 | Cytochrome P450, family 2, subfamily c, polypeptide 55 | ||
| Cyp2c29 | cytochrome P450, family 2, subfamily c, polypeptide 29 | ||
| Gna14 | Guanine nucleotide binding protein, alpha 14 | ||
| Cyp26a1 | Cytochrome P450, family 26, subfamily a, polypeptide 1 | ||
| Orm3 | Orosomucoid 3 | ||
| Gstm3 | Glutathione S-transferase, mu 3 | ||
| Dhrs9 | Dehydrogenase/reductase (SDR family) member 9 | ||
| Sult5a1 | Sulfotransferase family 5A, member 1 | ||
| Mup-ps16 | Major urinary protein, pseudogene 16 | ||
| AF357426 | snoRNA AF357426 | ||
| 2310067E19Rik | RIKEN cDNA 2310067E19 gene | ||
| Prss8 | Protease, serine 8 (prostasin) | ||
| Tmeff2 | Transmembrane protein with EGF-like and two follistatin-like domains 2 | ||
| Cyp2c66 | Cytochrome P450, family 2, subfamily c, polypeptide 66 | ||
| Slc3a1 | Solute carrier family 3, member 1 | ||
| Mir493 | microRNA 493 | ||
| Klk1b4 | Kallikrein 1-related pepidase b4 | ||
| Cyp2c65 | Cytochrome P450, family 2, subfamily c, Polypeptide 65 | ||
| Prg4 | Proteoglycan 4 | ||
| Kcnk1 | Potassium channel, subfamily K, member 1 | ||
| Ccl9 | Chemokine (C-C motif) ligand 9 | ||
| DQ267102 | snoRNA DQ267102 | ||
| Rarres1 | Retinoic acid receptor responder (tazarotene induced) 1 | ||
| Down-regulated | Snord14e | Small nucleolar RNA, C/D box 14E |
By comparing the differentially expressed genes between PCN and TCPOBOP at day 3, we identified 159 common genes, of which 85 genes were up-regulated and 74 genes were down-regulated by both PCN and TCPOBOP, whereas the genes Cyp2c54 and zinc finger imprinted 1 (Zim1) were up-regulated by TCPOBOP but down-regulated by PCN (Table 2). Of the 85 commonly up-regulated genes, cytochrome P450s (Cyp2b10 and Cyp2c55), glutathione S-transferase (Gstm3), indolethylamine N-methyltransferase (Inmt), and hepatic hydroxysteroid sulfotransferase (Sult2a5) are responsible for xenobiotic and steroid metabolism, whereas others are widely associated with cell proliferation (transmembrane glycoprotein Prominin 1 (prom1)) (Takenobu et al., 2011), cell signaling (sulfatase 2 (Sulf2)) (Rosen and Lemjabbar-Alaoui, 2010), glucorticoids transportation (serine peptidase inhibitor member 6 (Serpina6)), skeletal homeostasis (proteoglycan 4 [Prg4]) (Novince et al., 2012), as well as RNA transcription and splicing (Schlafen 9 (Slfn9)) (Mavrommatis et al., 2013) (Table 2). In contrast, neonatal exposure to PCN and TCPOBOP also down-regulated a series of genes, such as Cyp4a family members (Cyp4a10, Cyp4a31, and Cyp4a32), the Major urinary protein (Mup) family members (Mup1, Mup2, Mup7, Mup10, Mup12, and Mup19), which regulate glucose and energy metabolism (Zhou et al., 2009), as well as the prokineticin 1 (Prok1), which modulates cell proliferation and differentiation in immune system (Ngan et al., 2007) (Table 2).
We also identified 754 unique genes that were only regulated by PCN (including 379 up-regulated and 375 down-regulated genes), and 261 unique genes that were only regulated by TCPOBOP (including 221 up-regulated genes and 40 down-regulated genes) in neonatal mouse livers (Table 2). IPA analysis of the 754 PCN uniquely-regulated genes revealed several important networks. The top differentially regulated networks include (1) lipid metabolism, small molecule biochemistry, and drug metabolism (Figure 2); (2) energy production, lipid metabolism, and small molecule biochemistry (Supplemental Figure 1A); (3) cardiovascular disease, hematological disease, and hereditary disorder (Supplemental Figure 1B); (4) cell cycle, cellular assembly and organization, DNA replication, recombination, and repair (data not shown); and (5) inflammatory response, infectious diseases, carbohydrate metabolism (data not shown). As shown in Figure 2, the PXR-target gene Cyp3a family member (Cyp3a25) was significantly up-regulated (5.71-fold increase in microarray data) following PCN-induced PXR activation, which is consistent with previous findings (Down et al., 2007). Along with the decreased expression of the transcription factor CAR (NR1I3), the Cyp2b13/Cyp2b9, Cyp2f1 and Gsta4 genes were all down-regulated by PCN in neonatal mouse livers. The PCN-mediated down-regulation was also observed for Cyp2c40, Cyp2c44, Cyp2c70 and Cyp2e1, but not for Cyp2a4/2a5 (which is the mouse homolog of CYP2A6) that appeared to be up-regulated by PCN. The expression of Cyp4a14, Cyp4a22, and Cyp4f12 were down-regulated after neonatal exposure to PCN (Figure 2). Although the ALT and Glutamate Pyruvate Transaminase 2 (GPT2) genes were up-regulated by PCN, the serum ALT levels were within the normal range for all groups as shown in Figure 1B. Moreover, neonatal exposure to PCN also altered the expression of genes involved in bile acid metabolism, which was evidenced by the reduced expression of Cyp7a1 that encodes the rate-limiting enzyme in bile acid synthesis (Figure 2). In addition, neonatal exposure to PCN also altered the expression of genes involved in the signaling pathways that may influence TG, cholesterol, glucose and energy homeostasis, as well as other physiological functions. For example, PCN uniquely up-regulated genes involved in microsomal TG transfer [Mttp], bile acid conjugation reaction (bile acyl-CoA: amino acid N-acyltransferase [BAAT]), cholesterol esterification (sterol O-acyltransferase [SOAT2]), protein folding and modification (chaperonin containing TCP 1 [CCT3, CCT5, CCT7], arginine methyltransferases [PRMT1, PRMT3], tubulins [TUBB2A, TUBB6]), as well as cell-cycle progression (G0/G1 switch gene [G0S2]) (Supplemental Figs. 1A and B). In contrast, neonatal exposure to PCN down-regulated a variety of genes related to fatty acid oxidation (long-chain and medium-chain acyl-CoA dehydrogenase [ACADL and ACADM]), TGs breakdown (lipoprotein lipase [LPL]), high-density lipoprotein formation (lecithin-cholesterol acyltransferase [LCAT]), growth hormone signaling pathway (apolipoproteins [APOA5, Apoc1], growth hormone receptor [GHR], hydroxysteroid dehydrogenase [HSD11B1]), coagulation (clotting factors [F5, F9, F11], vitamin K epoxide reductase complex [VKORC1]), glucose metabolism (pyruvate dehydrogenase kinase [PDK4], one cut homeobox 1 [ONECUT1]), as well as tryptophan metabolism (tryptophan 2, 3-dioxygenase [TOD2]) (Supplemental Figs. 1A and B).
FIG. 2.

Ingenuity pathway analysis (IPA) identified networks associated with gene expression changes that were uniquely regulated by pregnenolone-16α-carbonitrile (PCN) compared with corn oil at 3-day of age in livers of wild-type (WT) mice (>2-fold change, adjusted P < 0.05). More networks are shown in Supplemental Figure 1. Genes or gene products are represented as nodes. The intensity of the node color indicates the degree of up-regulation (red) or down-regulation (green). The edges (lines and arrows between nodes) represent direct (solid lines) and indirect (dashed lines) interactions between molecules as supported by information in the Ingenuity knowledge base. Node shapes represent functional classes of gene products.
In comparison with PCN, neonatal exposure to TCPOBOP produced less uniquely regulated genes at day 3 (Table 2). IPA analysis of the 261 unique genes revealed the following top networks: (1) energy production, lipid metabolism, small molecule biochemistry (Figure 3); (2) endocrine system development and function, lipid metabolism, small molecule biochemistry (Supplemental Figure 2A); (3) drug metabolism, glutathione depletion in liver, liver hyperbilirubinemia (Supplemental Figure 2B); (4) lipid metabolism, small molecule biochemistry, digestive system development, and function (data not shown); and (5) cellular growth and proliferation, cellular development, tissue development (data not shown). As shown in Figure 3, the CAR-target genes, Aldehyde dehydrogenase (Aldh1a1) and P450 oxidoreductase (Por), were both up-regulated by TCPOBOP as expected (Aleksunes and Klaassen, 2012; Finn et al., 2009). The up-regulated genes were also involved in bile acid metabolism (Cyp8b1), pyruvate metabolism (serine dehydratase [SDS]), energy production (ethylmalonic encephalopathy 1 [ETHE1]), glutathione reduction [Gsta3], fatty acid oxidation (carnitine palmitoyltransferase [CPT2]) and transport (ATP-binding cassette member 3 [Abcd3]), glucose transport (solute carrier family members Slc22a1, Slc2a1), NF-κB-related immune response (toll-like receptor 5 [Tlr5]), bacteria growth inhibition (lipocalin [Lcn2]), post-transcriptional regulation (ring finger protein [Zfp36]), methylation (thiopurine methyltransferase [Tpmt]), and thyroid hormone activation/deactivation (deiodinase [DIO1]) (Figure 3). However, the expression of CPT1B, which functions as the rate-controlling enzyme in the oxidation of fatty acid, appeared to be down-regulated by TCPOBOP in neonatal mouse livers (Figure 3). The other networks revealed more DPGs that were elevated 24 h after TCPOBOP exposure, including carboxylesterases (Ces1e, Ces1g), xanthine dehydrogenase (Xdh), flavin containing monooxygenase (Fmo5), glutathione S-transferases (Gsta3, Gstt1), UDP glucuronosyltransferases (Ugt2b35/36 [mouse ortholog of human UGT2B7], Ugt2b37/38 [mouse ortholog of human UGT2B28]), and transporters (Slc22a7, Slc23a1); whereas the hepcidin antimicrobial peptidase (Hamp), which is involved in the maintenance of iron homeostasis, was down-regulated by TCPOBOP at day 3 (Supplemental Figs. 2A and B).
FIG. 3.

Ingenuity pathway analysis (IPA) identified networks associated with gene expression changes that were uniquely regulated by 1,4-bis-[2-(3,5-dichloropyridyloxy)] benzene (TCPOBOP) compared with corn oil at 3-day of age in livers of wild-type (WT) mice (>2-fold change, adjusted P < 0.05). More networks are shown in Supplemental Figure 2. Genes or gene products are represented as nodes. The intensity of the node color indicates the degree of up-regulation (red) or down-regulation (green). The edges (lines and arrows between nodes) represent direct (solid lines) and indirect (dashed lines) interactions between molecules as supported by information in the Ingenuity knowledge base. Node shapes represent functional classes of gene products.
Interestingly, there were some genes persistently differentially expressed after neonatal exposure to PCN or TCPOBOP in 60-day-old adult mouse livers (Table 3). By comparing the differentially expressed genes between PCN and TCPOBOP at day 60, we identified 4 common genes, including the up-regulated Cyp2b13, down-regulated Cyp4a (Cyp4a10 or Cyp4a31), and alpha fetoprotein (Afp), as well as the serine peptidase inhibitor (Serpinb1a), which was up-regulated by TCPOBOP but down-regulated by PCN (Table 3). As for the unique genes, neonatal exposure to PCN persistently up-regulated the expression of chemokine ligand 1 (Cxcl1) and serum amyloids (Saa1, Saa2), but down-regulated Cyp4a (Cyp4a14, Cyp4a31, Cyp4a32), insulin-like growth factor binding proteins (Igfbp1, Igfbp2) and oxidative stress induced growth inhibitor (Osgin1); whereas neonatal exposure to TCPOBOP persistently up-regulated the expression of Cyp2b10, Cyp2c55, Cyp2c29, but down-regulated the non-coding small nucleolar RNA (Snord14e), which is required for early cleavage of precursor rRNAs (Table 3).
Hierarchical Clustering of DPGs
Because PXR and CAR are well-known xenobiotic-sensing nuclear receptors in the liver, the acute and persistent changes in the DPGs following neonatal activation of these receptors were examined in detail. DPGs that were differentially expressed in at least one experimental condition included 125 DPGs at day 3 (phase I: 60, phase II: 30, transporter: 35) and 13 DPGs at day 60 (phase I: 10, phase II: 2, transporter: 1). Two-way hierarchical clustering dendrograms were plotted as shown in Figure 4A (day 3) and Figure 4B (day 60).
FIG. 4.

Two-way hierarchical clustering dendrogram of drug-processing genes (DPGs) that were differentially expressed by pregnenolone-16α-carbonitrile (PCN) or 1,4-bis-[2-(3,5-dichloropyridyloxy)] benzene (TCPOBOP) at day 3, A, or day 60, B, in the livers of wild-type (WT) mice. Three biological replicates (shown as columns) were tested for each group. Each row represents a different gene. A two-way hierarchical clustering dendrogram was generated of the differentially regulated DPGs by either PCN or TCPOBOP (fold-change > 2, P < 0.05) using the standardized means and Ward’s minimal variance. Distances between genes reflect the significance of associations. Red represents relatively higher and blue represents relatively lower expression. The expression profiles of differentially expressed drug-processing genes (DPGs) were categorized to 3 major patterns of interest at day 3, and two patterns at day 60.
The differentially expressed DPGs in the livers of 3-day-old mice were partitioned into 3 distinct clusters: pattern 1 included 40 genes that were down-regulated by PCN; pattern 2 included 41 genes that were up-regulated preferably by PCN (and to a lesser extent by TCPOBOP); pattern 3 included 44 genes that were up-regulated by TCPOBOP (Figure 4A). The average probe intensities for each pattern were plotted as shown in Figure 4C. On an average, genes in pattern 1 were down-regulated 65% by PCN, whereas genes in pattern 2 were up-regulated by PCN with a 3.5-fold change. In pattern 3, genes were markedly up-regulated by TCPOBOP but not PCN (Figure 4C).
The 13 differentially regulated DPGs in the livers of 60-day-old mice were divided into two clusters (Figure 4B). Pattern 1 included Cyp26a1, Cyp2b10, Cyp2c55, Cyp2c65, Cyp2c66, Dhrs9, Gstm3, Sult5a1, Slc3a1, and Cyp2b13 and they were in general up-regulated by neonatal exposure to TCPOBOP; pattern 2 included Cyp4a14, 4a31, and 4a32 and they were down-regulated by PCN and TCPOBOP (Figure 4B). The average probe intensities of genes in each pattern were plotted as shown in Figure 4D. Overall, genes in pattern 1 were increased 6.3-fold by TCPOBOP, whereas the genes in pattern 2 were down-regulated by both TCPOBOP and PCN with 48.4% and 71.1% decrease, respectively (Figure 4D).
Verification of Microarray Data in WT and receptor-Knockout Mouse Livers Using RT-qPCR and Western Blotting Analysis
Representative DPGs that were differentially regulated by neonatal exposure to PCN or TCPOBOP from microarray were validated as shown in Figures 5 and 6. To rule out the off-target effects of the chemicals, the differentially expressed genes were also examined in livers of PXR-null and CAR-null mice as well. In general, the RT-qPCR data were highly consistent with the microarray data in WT livers.
FIG. 5.

Neonatal pregnane X receptor (PXR) activation caused acute (day 3) and persistent changes (day 60) in the expression of drug-processing genes (DPGs) in the livers of wild-type (WT) mice but not pregnane X receptor knockout mice (PXR-null). The microarray data of the drug-processing genes (DPGs) that indicated up-regulated (eg fold-change > 2, P < 0.05) or down-regulated (eg fold-change<-2, P < 0.05) by pregnenolone-16α-carbonitrile (PCN) at day 3, A, or day 60, B, in livers of wild-type (WT) mice were further validated by RT-qPCR in both WT and PXR-null mice. C, Western blot analysis for protein expression of Cyp4a14 in 60-day-old WT and PXR-null mouse livers. D, Cyp4a enzyme activity in 60-day-old WT and PXR-null mouse liver microsomes using the Promega P450-GloTM CYP4A Luciferin-4A Assay. Asterisk (*) indicates statistically significant differences between PCN and control group (P< 0.05) by Student’s t-test.
FIG. 6.

Neonatal constitutive androstane receptor (CAR) activation caused acute (day 3) and persistent changes (day 60) in the expression of drug-processing genes (DPGs) in the livers of wild-type (WT) mice but not constitutive androstane receptor knockout mice (CAR-null). The microarray data of the DPGs that indicated up-regulated (eg fold change > 2, P < 0.05) or down-regulated (eg fold change<-2, P < 0.05) by 1,4-bis-[2-(3,5-dichloropyridyloxy)] benzene (TCPOBOP) at day 3, A, or day 60, B, in livers of WT mice were further validated by RT-qPCR in both WT and CAR-null mice. C, Western blot analysis for protein expression of Cyp2b10 and Cyp4a14 in 60-day-old WT and CAR-null mouse livers. D, Cyp2b and Cyp4a enzyme activity in 60-day-old mouse liver microsomes using the Promega P450-GloTM CYP2B and CYP4A Assay. Asterisk (*) indicates statistically significant differences between TCPOBOP and control group (P< 0.05) by Student’s t-test.
Regarding the PXR effect, at day 3, Cyp1a2 mRNA was up-regulated by PCN (5.33-fold from microarray) (Table 4). Using RT-qPCR, it was found that Cyp1a2 was also increased in WT mouse livers in a PXR-dependent manner, because such up-regulation disappeared in livers of PXR-null mice (Figure 5A). Similarly, the mRNAs of Cyp2a4, 3a11, 3a25, Aldh1a7, Ugt2b34, Sult2a1, Papss2, Gstm1, Slco1a4, Abcc3, and Abcc4 were all up-regulated by PCN in a PXR-dependent manner; whereas the mRNAs of Cyp4a14, 4a31, and 4a32 were all down-regulated by PCN in a PXR-dependent manner in livers of 3-day-old mice (Figure 5A). At day 60, Cyp2b13 mRNA was up-regulated by neonatal exposure to PCN in a PXR-dependent manner, whereas Cyp4a14, 4a31, and 4a32 were down-regulated by neonatal exposure to PCN in a PXR-dependent manner (Figure 5B). The protein expression of Cyp4a14 in livers of 60-day-old mice was quantified by western blotting analysis as shown in Figure 5C. Consistent with the mRNA data, Cyp4a14 protein was also persistently down-regulated by neonatal exposure to PCN in a PXR-dependent manner. Similarly, the Cyp4a enzyme activity was decreased by neonatal exposure to PCN in a PXR-dependent manner (Figure 5D). However, the Cyp2b enzyme activity was not changed by PCN in either WT or PXR-null mouse livers (Figure 5D), even though Cyp2b13 mRNA was persistently up-regulated in 60-day-old WT mouse livers by neonatal PCN exposure (Figure 5B). This is likely due to the fact that other more abundantly expressed Cyp2bs remained unchanged by neonatal PCN exposure in adult livers.
TABLE 4.
Differentially Regulated DPGs by PCN at 3- or 60-Day of Age in the Livers of WT Mice. The Fold-Change Refers to the Ratio of the Expression Values of the PCN Treatment Over the Corn Oil Treated Averaged at the Same Age
| Day 3 PCN vs Day 3 Corn Oil | ||||
|---|---|---|---|---|
| Gene Symbol | Description | Phase | Fold-Change | ANOVA p-value |
| Cyp2c55 | Cytochrome P450, family 2, subfamily c, polypeptide 55 | Phase I | 202.03 | 0.000002 |
| Gstm3 | Glutathione S-transferase, mu 3 | Phase II | 78.83 | 0.000392 |
| Cyp2b10 | Cytochrome P450, family 2, subfamily b, polypeptide 10 | Phase I | 16.27 | 0.001024 |
| Sult2a5 | Sulfotransferase family 2A, member 5 | Phase II | 10.44 | 0.002128 |
| Ces2a | Carboxylesterase 2A | Phase I | 10.1 | 0.000008 |
| Cyp2a5; Cyp2a4 | Cytochrome P450, family 2, subfamily a, polypeptide 5 or 4 | Phase I | 8.49 | 0.00039 |
| Sult2a1 | Sulfotransferase family 2A, member 1 | Phase II | 8.18 | 0.002287 |
| Sult2a2 | Sulfotransferase family 2A, member 2 | Phase II | 7.57 | 0.000634 |
| Aldh1a7 | Aldehyde dehydrogenase family 1, subfamily A7 | Phase I | 7.46 | 0.000415 |
| Cyp3a59 | Cytochrome P450, family 3, subfamily a, polypeptide 59 | Phase I | 6.83 | 0.001527 |
| Akr1b7 | Aldo–keto reductase family 1, member B7 | Phase I | 6.47 | 0.002692 |
| Cyp2a4 | Cytochrome P450, family 2, subfamily a, polypeptide 4 | Phase I | 6.02 | 0.000527 |
| Cyp3a25 | Cytochrome P450, family 3, subfamily a, polypeptide 25 | Phase I | 5.71 | 0.001775 |
| Cyp1a2 | Cytochrome P450, family 1, subfamily a, polypeptide 2 | Phase I | 5.33 | 0.003019 |
| Slco1a4 | Solute carrier organic anion transporter family, member 1a4 | Transporters | 4.76 | 0.000606 |
| Baat | Bile acid-Coenzyme A: amino acid N-acyltransferase | Phase II | 4.69 | 0.003927 |
| Ephx1 | Epoxide hydrolase 1, microsomal | Phase I | 4.52 | 0.000624 |
| Ugt2b34 | UDP glucuronosyltransferase 2 family, polypeptide B34 | Phase II | 4.16 | 0.000102 |
| Cyp2j5 | Cytochrome P450, family 2, subfamily j, polypeptide 5 | Phase I | 3.81 | 0.006269 |
| Sult2a4 | Sulfotransferase family 2A, member 4 | Phase II | 3.74 | 0.00479 |
| Sult2a3 | Sulfotransferase family 2A, member 3 | Phase II | 3.65 | 0.002052 |
| Cyp3a57 | Cytochrome P450, family 3, subfamily a, polypeptide 57 | Phase I | 3.52 | 0.001399 |
| Gsr | Glutathione reductase; glutathione reductase 1 | Phase I | 3.48 | 0.001057 |
| Gstm1 | Glutathione S-transferase, mu 1 | Phase II | 3.4 | 0.000689 |
| Papss2 | 3-Phosphoadenosine 5-phosphosulfate synthase 2 | Phase II | 3.33 | 0.000854 |
| Gadd45b | Growth arrest and DNA-damage-inducible 45 beta | Epi | 2.95 | 0.002009 |
| Akr1c14 | Aldo–keto reductase family 1, member C14 | Phase I | 2.9 | 0.000391 |
| Ugt2a3 | UDP glucuronosyltransferase 2 family, polypeptide A3 | Phase II | 2.8 | 0.000404 |
| Cyp3a11 | Cytochrome P450, family 3, subfamily a, polypeptide 11 | Phase I | 2.77 | 0.000076 |
| Gstm2 | Glutathione S-transferase, mu 2 | Phase II | 2.76 | 0.009338 |
| Sult1c2 | Sulfotransferase family, cytosolic, 1C, member 2 | Phase II | 2.72 | 0.001618 |
| Abcc3 | ATP-binding cassette, sub-family C (CFTR/MRP), member 3 | Transporters | 2.62 | 0.002583 |
| Slc25a45 | Solute carrier family 25, member 45 | Transporters | 2.55 | 0.039597 |
| Slc41a2 | Solute carrier family 41, member 2 | Transporters | 2.53 | 0.000375 |
| Gsta4 | Glutathione S-transferase, alpha 4 | Phase II | −2.51 | 0.009568 |
| Suox | Sulfite oxidase | Phase I | −2.55 | 0.007792 |
| Cyp2b9 | Cytochrome P450, family 2, subfamily b, polypeptide 9 | Phase I | −2.61 | 0.000017 |
| Cyp2c40 | Cytochrome P450, family 2, subfamily c, polypeptide 40 | Phase I | −2.62 | 0.010139 |
| Slc30a10 | solute carrier family 30, member 10 | Transporters | −2.63 | 0.002622 |
| Cyp4f13 | Cytochrome P450, family 4, subfamily f, polypeptide 13 | Phase I | −2.88 | 0.003594 |
| Slc17a3 | Solute carrier family 17 (sodium phosphate), member 3 | Transporters | −2.88 | 0.007564 |
| Cyp2c69 | Cytochrome P450, family 2, subfamily c, polypeptide 69 | Phase I | −2.91 | 0.002362 |
| Fmo1 | Flavin containing monooxygenase 1 | Phase I | −2.92 | 0.000406 |
| Slc4a4 | Solute carrier family 4 (anion exchanger), member 4 | Transporters | −2.93 | 0.007225 |
| Aldh1l1 | Aldehyde dehydrogenase 1 family, member L1 | Phase I | −2.94 | 0.000932 |
| Slc2a2 | Solute carrier family 2 (facilitated glucose transporter), member 2 | Transporters | −2.99 | 0.018215 |
| Aldh6a1 | Aldehyde dehydrogenase family 6, subfamily A1 | Phase I | −3.18 | 0.000758 |
| Cyp2c67 | Cytochrome P450, family 2, subfamily c, polypeptide 67 | Phase I | −3.26 | 0.007684 |
| Cyp2c54 | Cytochrome P450, family 2, subfamily c, polypeptide 54 | Phase I | −3.28 | 0.002595 |
| Ephx2 | Epoxide hydrolase 2, cytoplasmic | Phase I | −3.34 | 0.004101 |
| Cyp2c70 | Cytochrome P450, family 2, subfamily c, polypeptide 70 | Phase I | −3.74 | 0.004401 |
| Slc44a3 | Solute carrier family 44, member 3 | Transporters | −3.76 | 0.000014 |
| Cyp2c44 | Cytochrome P450, family 2, subfamily c, polypeptide 44 | Phase I | −4.23 | 0.000018 |
| Ugt3a1 | UDP glycosyltransferases 3 family, polypeptide A1 | Phase II | −4.3 | 0.000873 |
| Abca8a | ATP-binding cassette, sub-family A (ABC1), member 8a | Transporters | −4.33 | 0.000211 |
| Adhfe1 | Alcohol dehydrogenase, iron containing, 1 | Phase I | −4.4 | 0.003224 |
| Cyp7a1 | Cytochrome P450, family 7, subfamily a, polypeptide 1 | Phase I | −4.6 | 0.006761 |
| Nr1i3 | Nuclear receptor subfamily 1, group I, member 3 | Nuclear receptor | −4.8 | 0.000138 |
| Slc27a5 | Solute carrier family 27 (fatty acid transporter), member 5 | Transporters | −4.85 | 0.00128 |
| Cyp4a31 | Cytochrome P450, family 4, subfamily a, polypeptide 31 | Phase I | −4.91 | 0.000435 |
| Slc17a2 | Solute carrier family 17 (sodium phosphate), member 2 | Transporters | −7.73 | 0.000744 |
| Ugt3a2 | UDP glycosyltransferases 3 family, polypeptide A2 | Phase II | −11.5 | 0.000359 |
| Cyp2f2 | Cytochrome P450, family 2, subfamily f, polypeptide 2 | Phase I | −11.51 | 0.002444 |
| Cyp4a14 | Cytochrome P450, family 4, subfamily a, polypeptide 14 | Phase I | −14.75 | 0.000008 |
| Cyp4a32 | Cytochrome P450, family 4, subfamily a, polypeptide 32 | Phase I | −20.05 | 0.000269 |
| Cyp4a10; Cyp4a31 | Cytochrome P450, family 4, subfamily a, polypeptide 10 or 31 | Phase I | −29.63 | 0.000181 |
| Day60 PCN vs Day60 Corn Oil | ||||
| Cyp2b13 | Cytochrome P450, family 2, subfamily b, polypeptide 13 | Phase I | 4.4 | 0.032423 |
| Cyp4a31 | Cytochrome P450, family 4, subfamily a, polypeptide 31 | Phase I | −2.37 | 0.020546 |
| Cyp4a32 | Cytochrome P450, family 4, subfamily a, polypeptide 32 | Phase I | −2.6 | 0.005586 |
| Cyp4a10; Cyp4a31 | Cytochrome P450, family 4, subfamily a, polypeptide 10 or 31 | Phase I | −2.92 | 0.018139 |
| Cyp4a14 | Cytochrome P450, family 4, subfamily a, polypeptide 14 | Phase I | −7.92 | 0.023341 |
Note: Fold change is defined as a ratio. Positive, up-regulation; Negative, the inverse of ratio, down-regulation.
As expected, microarray analysis showed that the prototypical CAR-target gene Cyp2b10 was markedly increased by TCPOBOP in livers of 3-day-old WT mice (421.6-fold from microarray) (Table 5). A similar pattern of increased Cyp2b10 was observed using RT-qPCR in WT mice but not in CAR-null mice (Figure 6A). The mRNAs of Cyp1a2, Cyp2c55, Cyp3a11, Aldh1a7, Ugt2b34-36, Gstm1, Gstm3, Gstm4, Gstt1, and Slco1a4 were all up-regulated by TCPOBOP in a CAR-dependent manner; whereas Cyp4a31 and 4a32 mRNAs were down-regulated by TCPOBOP in a CAR-dependent manner (Figure 6A). At 60 days after neonatal exposure, consistent with a previous report (Chen et al., 2012), Cyp2b10 mRNA was persistently up-regulated by neonatal TCPOBOP exposure in a CAR-dependent manner; similarly, the mRNAs of Cyp2c55 and Sult5a1 were also persistently up-regulated by neonatal TCPOBOP exposure in a CAR-dependent manner. Gstm3 mRNA was persistently up-regulated by neonatal TCPOBOP exposure not only in livers of adult WT mice but also in livers of adult CAR-null mice, indicating that there may be an off-target effect of the chemical (Figure 6B). Microarray analysis showed that Cyp4a31 mRNA was down-regulated by neonatal TCPOBOP exposure; whereas RT-qPCR showed that it tended to be decreased by TCPOBOP (although a statistical significance was not achieved) in livers of WT mice, but it was markedly increased in livers of CAR-null mice. Similar findings were observed for Cyp4a14 mRNA (Figure 6B). Western blotting analysis showed that Cyp2b10 protein was persistently up-regulated by neonatal TCPOBOP exposure in livers of 60-day-old mice in a CAR-dependent manner. Cyp4a14 protein was persistently down-regulated by neonatal TCPOBOP exposure in livers of 60-day-old mice in a CAR-dependent manner, but it was not up-regulated in livers of CAR-null mice (likely due to post-transcriptional modifications of the Cyp4a14 transcript). The overall hepatic Cyp2b enzyme activity was increased by neonatal TCPOBOP exposure in 60-day-old mice in a CAR-dependent manner. However, the overall hepatic Cyp4a enzyme activity was actually moderately increased by neonatal TCPOBOP exposure in 60-day-old mice in a CAR-dependent manner. Because the substrate for Cyp4a enzyme activity assay was not designed specifically to detect the Cyp4a14 isoform, we could not directly compare it with its protein and mRNA alteration (Figure 6D). For both the protein and the enzyme activity of Cyp4a, there appeared to be a constitutive increase in livers of the CAR-null mice (Figs. 6C and D), suggesting that basal expression of CAR suppresses the expression of Cyp4a14 in control conditions.
TABLE 5.
Differentially Regulated DPGs by TCPOBOP at 3- or 60-Day of Age in the Livers of WT Mice
|
Day 3 TCPOBOP vs Day 3 Corn Oil | ||||
|---|---|---|---|---|
| Gene Symbol | Description | Phase | Fold-Change | ANOVA p-value |
| Cyp2b10 | Cytochrome P450, family 2, subfamily b, polypeptide 10 | Phase I | 412.63 | 1.37E−07 |
| Cyp2c55 | Cytochrome P450, family 2, subfamily c, polypeptide 55 | Phase I | 162.12 | 0.000013 |
| Aldh1a7 | Aldehyde dehydrogenase family 1, subfamily A7 | Phase I | 30.56 | 0.000225 |
| Cyp1a2 | Cytochrome P450, family 1, subfamily a, polypeptide 2 | Phase I | 20.82 | 0.000081 |
| Cyp2c50 | Cytochrome P450, family 2, subfamily c, polypeptide 50 | Phase I | 11.17 | 0.000482 |
| Sult1c2 | Sulfotransferase family, cytosolic, 1C, member 2 | Phase II | 10.37 | 0.000403 |
| Cyp2c54 | Cytochrome P450, family 2, subfamily c, polypeptide 54 | Phase I | 9.14 | 0.000063 |
| Gstt3 | Glutathione S-transferase, theta 3 | Phase II | 8.42 | 0.000583 |
| Gstm3 | Glutathione S-transferase, mu 3 | Phase II | 8.41 | 0.000189 |
| Ugt2b36 | UDP glucuronosyltransferase 2 family, polypeptide B36 | Phase II | 8.07 | 0.000309 |
| Ces1g | Carboxylesterase 1G; carboxylesterase 1 | Phase I | 6.73 | 0.00248 |
| Cyp8b1 | Cytochrome P450, family 8, subfamily b, polypeptide 1 | Phase I | 5.72 | 0.009413 |
| Sult1d1 | Sulfotransferase family 1D, member 1 | Phase II | 5.21 | 0.040664 |
| Slc23a1 | Solute carrier family 23 (nucleobase transporters), member 1 | Transporters | 4.77 | 0.003867 |
| Cbr1 | Carbonyl reductase 1 | Phase II | 4.49 | 0.000364 |
| Cyp2j5 | Cytochrome P450, family 2, subfamily j, polypeptide 5 | Phase I | 4.4 | 0.008509 |
| Cyp17a1 | Cytochrome P450, family 17, subfamily a, polypeptide 1 | Phase I | 4.4 | 0.010497 |
| Cyp2b13 | Cytochrome P450, family 2, subfamily b, polypeptide 13 | Phase I | 4.33 | 0.00022 |
| Ugt2b34 | UDP glucuronosyltransferase 2 family, polypeptide B34 | Phase II | 4.15 | 0.000553 |
| Ephx1 | Epoxide hydrolase 1, microsomal | Phase I | 3.92 | 0.000384 |
| Slco1a4 | Solute carrier organic anion transporter family, member 1a4 | Transporters | 3.83 | 0.01557 |
| Aldh1a1 | Aldehyde dehydrogenase family 1, subfamily A1 | Phase I | 3.8 | 0.002794 |
| Ugt2b35 | UDP glucuronosyltransferase 2 family, polypeptide B35 | Phase II | 3.8 | 0.000055 |
| Ugt2b1 | UDP glucuronosyltransferase 2 family, polypeptide B1 | Phase II | 3.73 | 0.00348 |
| Abcc3 | ATP-binding cassette, sub-family C (CFTR/MRP), member 3 | Transporters | 3.45 | 0.000975 |
| Fmo5 | Flavin containing monooxygenase 5 | Phase I | 3.36 | 0.000213 |
| Slc26a1 | Solute carrier family 26 (sulfate transporter), member 1 | Transporters | 3.36 | 0.00246 |
| Slc22a7 | Solute carrier family 22 (organic anion transporter), member 7 | Transporters | 3.26 | 0.006992 |
| Cyp2b23 | Cytochrome P450, family 2, subfamily b, polypeptide 23 | Phase I | 3.06 | 0.000016 |
| Slc22a1 | Solute carrier family 22 (organic cation transporter), member 1 | Transporters | 3.05 | 0.000654 |
| Cyp3a13 | Cytochrome P450, family 3, subfamily a, polypeptide 13 | Phase I | 3 | 0.006573 |
| Glyat | Glycine-N-acyltransferase | Phase II | 3 | 0.010934 |
| Sult2a5 | sulfotransferase family 2A, member 5 | Phase II | 2.99 | 0.001624 |
| Gstm1 | Glutathione S-transferase, mu 1 | Phase II | 2.87 | 0.00101 |
| Gstt1 | Glutathione S-transferase, theta 1 | Phase II | 2.87 | 0.002713 |
| Papss2 | 3-Phosphoadenosine 5-phosphosulfate synthase 2 | Phase II | 2.85 | 0.000886 |
| Cyp4f15 | Cytochrome P450, family 4, subfamily f, polypeptide 15 | Phase I | 2.84 | 0.003176 |
| Ces1e | Carboxylesterase 1E | Phase I | 2.76 | 0.002784 |
| Cyp3a11 | Cytochrome P450, family 3, subfamily a, polypeptide 11 | Phase I | 2.71 | 0.000137 |
| Ugt2b5 | UDP glucuronosyltransferase 2 family, polypeptide B5 | Phase II | 2.6 | 0.029453 |
| Ahr | Aryl-hydrocarbon receptor | Transcription factor | 2.56 | 0.000065 |
| Gstm4 | Glutathione S-transferase, mu 4 | Phase II | 2.54 | 0.006722 |
| Cyp4a31 | Cytochrome P450, family 4, subfamily a, polypeptide 31 | Phase I | −2.65 | 0.013086 |
| Cyp4a10; Cyp4a31 | Cytochrome P450, family 4, subfamily a, polypeptide 10 | Phase I | −5.18 | 0.008392 |
| Cyp4a32 | Cytochrome P450, family 4, subfamily a, polypeptide 32 | Phase I | −5.44 | 0.011237 |
| Day 60 TCPOBOP vs Day 60 Corn Oil | ||||
| Cyp2b10 | Cytochrome P450, family 2, subfamily b, polypeptide 10 | Phase I | 131.29 | 0.000069 |
| Cyp2c55 | Cytochrome P450, family 2, subfamily c, polypeptide 55 | Phase I | 28.43 | 0.0002 |
| Cyp2b13 | Cytochrome P450, family 2, subfamily b, polypeptide 13 | Phase I | 6.76 | 0.042971 |
| Cyp2c29 | Cytochrome P450, family 2, subfamily c, polypeptide 29 | Phase I | 5.76 | 0.000109 |
| Cyp26a1 | Cytochrome P450, family 26, subfamily a, polypeptide 1 | Phase I | 4.27 | 0.016422 |
| Gstm3 | Glutathione S-transferase, mu 3 | Phase II | 3.93 | 0.001592 |
| Dhrs9 | Dehydrogenase/reductase (SDR family) member 9 | Phase I | 3.4 | 0.022735 |
| Sult5a1 | Sulfotransferase family 5A, member 1 | Phase II | 2.96 | 0.039028 |
| Cyp2c66 | Cytochrome P450, family 2, subfamily c, polypeptide 66 | Phase I | 2.42 | 0.033951 |
| Slc3a1 | Solute carrier family 3, member 1 | Transporters | 2.37 | 0.009555 |
| Cyp2c65 | Cytochrome P450, family 2, subfamily c, polypeptide 65 | Phase I | 2.19 | 0.044539 |
| Cyp4a10; Cyp4a31 | Cytochrome P450, family 4, subfamily a, polypeptide 10 or 31 | Phase I | −2.39 | 0.033451 |
Note: The fold-change refers to the ratio of the expression values of the TCPOBOP treatment over the corn oil treated averaged at the same age (fold change is defined as a ratio. Positive, up-regulation; negative, the inverse of ratio, down-regulation).
PPARα-DNA Binding to the Cyp4a Gene Loci
The present study identified a persistent decrease in the expression of Cyp4a genes following neonatal activation to PXR and CAR. Because Cyp4a genes are well-known prototypical target genes of PPARα (Aleksunes and Klaassen, 2012), we hypothesized that PPARα-DNA binding would be decreased in adult livers following neonatal exposure to PCN and TCPOBOP. Therefore, to determine the molecular mechanisms underlying the persistent down-regulation of the Cyp4a genes in adult mouse liver following neonatal exposure to PCN or TCPOBOP, ChIP was conducted in WT mouse livers at 60-day of age in 2 independent pull-downs using a ChIP-grade antibody against PPARα as described in Materials and methods section. Due to lower sample yield, PPARα ChIP was not performed at day 3 neonatal age. The PPARα-DNA response elements of Cyp4a14, 4a31, and 4a32 were examined in detail, because their gene expression was down-regulated by PCN and/or TCPOBOP in a PXR/CAR-dependent manner. ChIP-qPCR demonstrated that there were constitutive PPARα-bindings to all 3 Cyp4 genes under control conditions; however, neonatal PCN exposure appeared to decrease the PPARα-DNA binding to the response elements of all Cyp4 genes (84.0% decrease for Cyp4a14, 73.1% decrease for Cyp4a31, and 66.9% decrease for Cyp4a32). Similarly, neonatal TCPOBOP exposure also appeared to decrease the PPARα-DNA binding to the response elements of the Cyp4 genes (70.2% decrease for Cyp4a14, 56.8% decrease for Cyp4a31, and 54.3% decrease for Cyp4a32) (Figure 7A). In summary, neonatal exposure to PCN and TCPOBOP, which lead to PXR and CAR activation, appeared to persistently interfere with the constitutive PPARα-DNA binding to some Cyp4 genes in adult liver, and this may contribute to the persistent down-regulation of the Cyp4 genes.
FIG. 7.
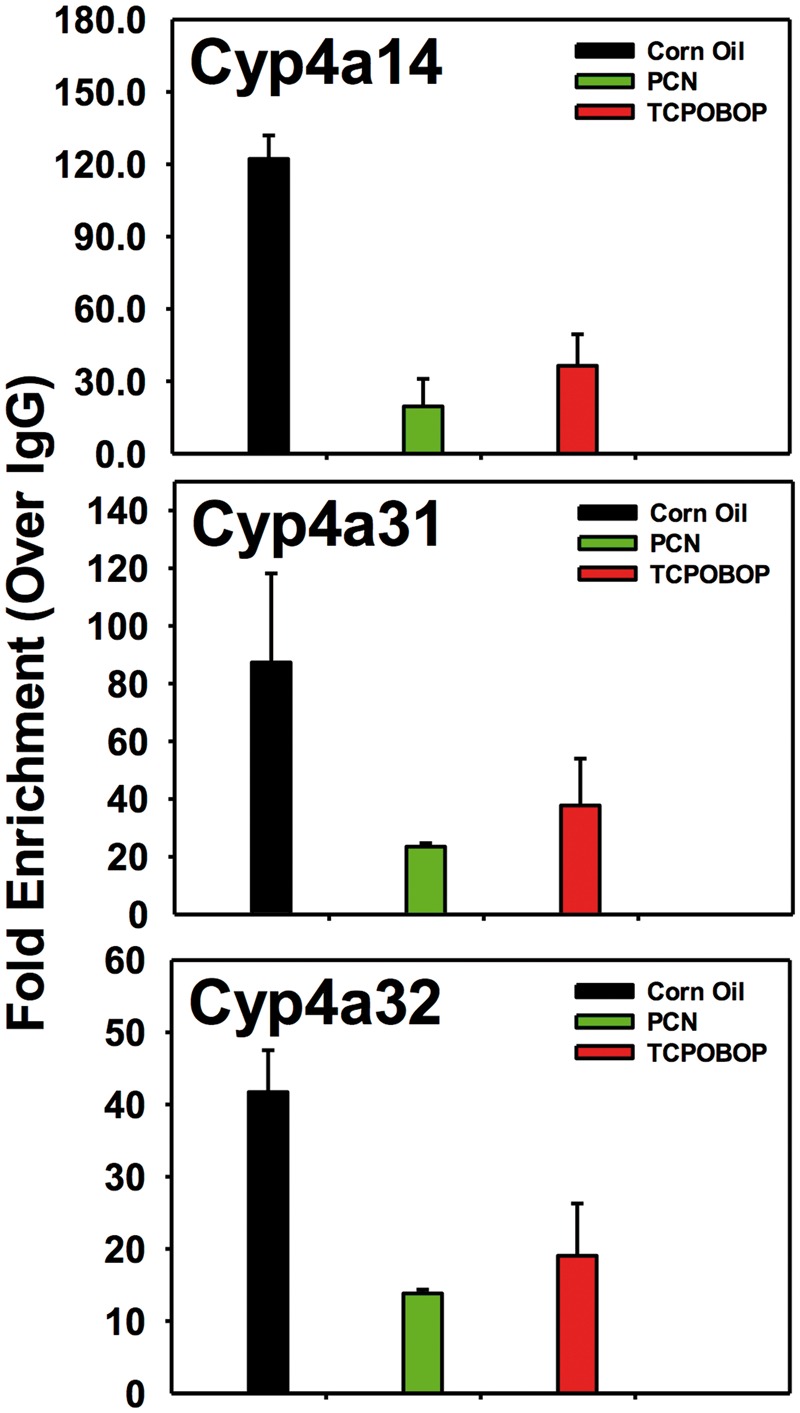
Chromatin immunoprecipitation (ChIP)-qPCR of the DNA binding fold enrichment for PPARα and RNA Pol II to Cyp4a gene loci in 60-day-old wild-type (WT), pregnane X receptor knockout mouse (PXR-null) and constitutive androstane receptor knockout mouse (CAR-null) livers. ChIP assays were performed using specific antibodies against peroxisome proliferator-activated receptor alpha (PPARα), RNA polymerase II (RNA Pol II), and Immunoglobulin G (IgG). Data were first normalized to genomic DNA input, and then expressed as fold-enrichment over IgG control.
Serum and Hepatic TG Levels
Based on previous findings that activation of PPARα could result in decreased circulating TG (Monsalve et al., 2013), we hypothesized that decreased PPARα-signaling would raise the constitutive TG levels in circulation. Surprisingly, at day 3, the serum TG levels generally remained unchanged except for a slight decrease by TCPOBOP in WT mice, and a moderate increase by PCN in PXR-null mice (Supplemental Figure 3A). At day 60, serum TG levels also generally remained unchanged, except for a moderate increase by PCN in WT mice (Supplemental Figure 3B). Consistently, we also did not observe any changes in hepatic TG levels by TCPOBOP or PCN in WT and knockout mouse livers at day 60 (Supplemental Figure 3C). Therefore, the xenobiotic-sensors PXR and CAR mediated down-regulation of PPARα-DNA binding is likely regional (e.g. around the Cyp4a gene loci), and do not produce an overall alteration in TG synthesis/metabolism.
DISCUSSION
In this study, using mouse models, we have demonstrated that neonatal exposure to the PXR-activator PCN and the CAR-activator TCPOBOP not only produces acute but also persistent changes in the expression of genes involved in both xenobiotic and intermediary metabolism in a PXR- and CAR-dependent manner. In particular, we have demonstrated that neonatal activation of the xenobiotic-sensing nuclear receptors PXR and CAR may lead to decreased PPARα-signaling in adult liver, suggesting that neonatal exposure to certain xenobiotics may lead to an adult-onset of certain idiosyncratic lipid disorders.
We have previously shown that the DPGs can be up-regulated in livers of newborn mice following an acute exposure to the PXR and CAR activators (Li et al., 2015). Consistent with our previous findings, in this study, we found both Cyp2b10 and Ugt2b35 were up-regulated following neonatal exposure to TCPOBOP in 3-day-old mouse livers. In addition, we found that TCPOBOP acutely up-regulated the mRNAs Cyp3a11, Aldh1a7, Ugt2b34, Papss2, Slco1a4, and Mrp3 in 3-day-old neonatal mouse livers (24 h after exposure). These additional genes were up-regulated in this study, but was not observed previously (Li et al., 2015). This is likely because a 10-fold higher dose of TCPOBOP was used in the present study. Regarding the effect of PXR activation on neonatal hepatic gene expression, we found that both Cyp3a11 and Cyp3a25 were up-regulated following neonatal exposure to PCN in 3-day-old mouse livers. A similar up-regulation was observed in 4-day-old livers of mice treated with the PXR activator dexamethasone (Down et al., 2007). The up-regulation of Gstm2, Gstm3, and Slco1a4 by PCN in neonatal mouse livers was also consistent with our prior publication (Li et al., 2015). In addition to the expected up-regulation of many well-characterized CAR- or PXR-targeted DPGs, our microarray results also revealed many other genes that are commonly or uniquely regulated by TCPOBOP or PCN in the neonatal mouse livers. For example, this study was among the first to identify that neonatal exposure to TCPOBOP and PCN both up-regulated the prototypical aryl hydrocarbon receptor (AhR)-target gene Cyp1a2 in the neonatal livers of wild-type mice, but not the CAR and PXR receptor-knockout mice. In addition, neonatal exposure to TCPOBOP or PCN both down-regulated the PPARα-target genes Cyp4a in 3-day-old neonatal mouse livers. Therefore, there is apparent cross-talk among the xenobiotic-sensing nuclear receptors (PXR and CAR) and other nuclear receptors (such as AhR and PPARα) following xenobiotic insult.
The effect of activation of the xenobiotic-sensors PXR and CAR on the expression of many genes in adult liver has been studied extensively (Aleksunes and Klaassen, 2012; Fisher et al., 2008), but there are fewer studies regarding the effect of exposure of young animals to PXR/CAR activators on gene expression profiles later in life. It was reported that CAR activation by an indirect activator, phenobarbital, at early life caused persistent up-regulation of Cyp2b10, Cyp2c29, and Cyp3a11 in adult mouse livers (Tien et al., 2015). Neonatal activation of CAR by TCPOBOP during neonatal age also persistently induced the expression of Cyp2b10 and Cyp2c37 throughout the life of exposed mice (Chen et al., 2012). Consistent with previous findings, the present study has confirmed that Cyp2b10 and Cyp2c29 are both up-regulated in neonatal and adult mouse livers after neonatal exposure to TCPOBOP. However, the present microarray results did not show any significant changes in Cyp3a11 expression in adult mouse livers after neonatal exposure to TCPOBOP (Chen et al., 2012). The discrepancy of Cyp3a11 is likely due to the different CAR activators that were administered (phenobarbital vs TCPOBOP). It is possible that phenobarbital can persistently activate or down-regulate additional signaling pathways besides CAR (Tien et al., 2015).
The present study has also provided new information on a transcriptome-wide scale regarding the persistent regulation of many other DPGs by neonatal CAR activation, including a persistent up-regulation of Cyp2c55, Cyp2b13, Cyp26a1, Dhrs9, Sult5a1, Slc3a1, Cyp2c65, Cyp2c66, and Gstm3, but a persistent down-regulation of Cyp4a10 and Cyp4a31 in adult liver in a CAR-dependent manner (Table 5). In addition to the CAR-signaling, the present study is among the first to unveil the effect of neonatal PXR activation on the acute and persistent regulation of DPGs on a transcriptomic scale. Similar to CAR, neonatal activation of PXR also resulted in a number of genes differentially expressed in liver during and beyond the neonatal period (Table 4). Unexpectedly, neonatal up-regulation of PXR also leads to a persistent up-regulation of Cyp2b13/2b9, which are well-known CAR-target genes, in adult mouse liver. Therefore, there are potential interactions between these receptors and/or down-stream signaling molecules during liver development.
PPARα stimulates gene transcription by binding to peroxisome proliferators response elements (PPRE) in the promoter of its target genes, which are involved in lipid metabolism, fatty acid oxidation, and glucose homeostasis (Zandbergen and Plutzky, 2007). Activation of PPARα by its activator clofibrate up-regulates the expression of CYP4A genes (Maglich et al., 2009). Interestingly, the present study has found that neonatal exposure to PCN and TCPOBOP not only acutely but also persistently down-regulates the Cyp4a gene in mouse livers, at the mRNA, protein and/or enzyme activity levels in a PXR and CAR-dependent manner. Consistent with the gene expression results, ChIP assay results also showed decreased PPARα-DNA binding to the response elements of all Cyp4 genes in adult mouse livers after neonatal exposure to PCN and TCPOBOP, indicating there might be cross-talk between xenobiotic sensors and lipid sensor during and beyond the neonatal period. Many studies have demonstrated the role of CAR in xenobiotic metabolism, but CAR has also been implicated in the down-regulation of many critical genes involved in bile acid synthesis and fatty acid beta-oxidation (Miao et al., 2006). It has been reported that TCPOBOP-activated CAR decreases the expression of PPARα mRNA as well as Cyp4a14 in livers of adult wild-type mice, whereas the PPARα activity increased in the absence of CAR, and an increased hepatic fatty acid oxidation was detected in the CAR−/− mice (Maglich et al., 2009). Similar to the CAR-signaling, the activation of PXR also reduced expression of PPARα mRNA in the adult mouse liver after administration of the PXR ligand PCN (Inoue et al., 2008). As shown in Figure 5, when PCN was administered to mice at 3-days of age, Cyp4a14, Cyp4a31 and Cyp4a32 are down-regulated at both day 3 and day 60 only in WT mice, but not in PXR-null mice. However, the basal Cyp4a expression was not further up-regulated in livers of control PXR-null mice, indicating that the basal expression of Cyp4a is not regulated by PXR. Cyp4a genes are prototypical targets of PPARα, thus PPARα is likely responsible for the constitutive expression of Cyp4a genes in liver. The mechanism regarding how neonatal CAR and PXR activation modulate PPARa activity during development is still unclear and needs to be further investigated in future studies.
In addition to the xenobiotic biotransformation pathways and the PPARα-signaling, neonatal exposure to PCN and CAR also regulates other critical genes involved in the endobiotic signaling. For example, neonatal activation of PXR down-regulated the mRNA expression of Cyp7a1, which is rate-limiting enzyme in the synthesis of bile acids, as well as the nuclear receptor small heterodimer partner (SHP/NR0B2) in neonatal mouse livers (Figure 2 and Supplemental Figure 1). SHP plays an essential role in maintaining cholesterol and bile acid homeostasis by inhibiting cholesterol conversion to bile acids (Miao et al., 2009). Our results were consistent with other studies that showed rifampicin-induced PXR activation could inhibit both CYP7A1 and SHP gene transcription in primary human hepatocyte and HepG2 cells (Li and Chiang, 2006). Future studies will be performed to reveal the mechanisms underlying the effect of neonatal PXR activation on cholesterol and bile acid homeostasis.
Regarding the tissue-specific effects due to PXR- and CAR-depletion in PXR-null and CAR-null mice, it has been shown before that CAR is predominantly expressed in liver, gallbladder, and small intestine, whereas PXR is predominantly expressed in liver, gallbladder, and both the small and large intestine. These 2 receptors are minimally expressed in other organs (Bookout et al., 2006). Therefore, the depletion of PXR and CAR is expected to affect mainly the liver and the GI tract. It is possible that the absence of PXR and CAR in intestine may produce non-hepatic effects, such as changes in the disposition of microbial metabolite and nutritional factors that may influence the hepatic expression of certain genes. Future studies using tissue-specific PXR- and CAR-null mice will address this issue. Because our wild-type control mice and PXR and CAR null mice are not siblings, comparisons between the lines of mice are limited. We instead have focused the interpretation of our results and discussion on the response of these different lines to the PXR and CAR activators.
Regarding the pharmacokinetics of TCPOBOP or PCN, we speculate that at day 3, there will be significant amount of PCN and TCPOBOP present in liver, whereas 60 days later, the chemicals will be eliminated from the body. This expectation is based on previous studies in the literature. Specifically, the pharmacokinetics of TCPOBOP has been examined in Sprague Dawley rats and mice, and the results have demonstrated that this chemical has a long biological half-life and is stored primarily in the fat as the parent compound. The fat levels of TCPOBOP decrease slowly over a 30-day period (Poland et al., 1981), thus we do not expect a significant amount of TCPOBOP present in the liver 60 days after the initial exposure. For PCN, currently there are no publications regarding the clearance of this chemical. However, it has been shown that the half-life of pregnenolone, which is a structurally similar compound to PCN, is 4.4 min in guinea pigs (Weinand et al., 1966). Therefore, we speculate that PCN will likely have a short half-life and minimal levels will be present in day 60 liver samples. It has been shown before that neonatal activation of CAR mediated persistent increase in certain P450s is due to epigenetic memory (Chen et al., 2012). It is possible that neonatal activation of PXR mediated persistent changes in certain genes is also due to epigenetic memory, and this hypothesis will be tested in future studies.
In conclusion, the present study has identified that neonatal exposure to PXR and CAR activators leads to both acute and persistent changes in the hepatic expression of genes involved in drug and lipid metabolism, suggesting that it is important to understand the connections between neonatal exposure to PXR and CAR activators and the adult onset of PPARα-related human liver diseases.
SUPPLEMENTARY DATA
Supplementary data are available online at http://toxsci.oxfordjournals.org/
ACKNOWLEDGEMENTS
The authors would like to acknowledge all members of the UW CEEH Functional Genomics and Proteomics Laboratory for their technical assistance in the microarray experiment and guidance on the microarray data analysis. The authors also would like to thank Tuyen Nguyen and Patrick Weaver from Affymetrix for their technical support, and the members of Dr Cui laboratory for their help in tissue collection.
FUNDING
This work was supported by National Institutes of Health (NIH) Grants ES025708, GM111381, ES019487, and the University of Washington Center for Ecogenetics and Environmental Health (CEEH) (P30 ES007033), as well as the Murphy Endowment Fund.
REFERENCES
- Aleksunes L. M., Klaassen C. D. (2012). Coordinated regulation of hepatic phase I and II drug-metabolizing genes and transporters using AhR-, CAR-, PXR-, PPARα-, and Nrf2-null mice. Drug Metab. Dispos. 40, 1366–1379. [DOI] [PMC free article] [PubMed] [Google Scholar]
- Aleksunes L. M. Goedken M.Manautou J. E. (2006). Up-regulation of NAD(P)H quinone oxidoreductase 1 during human liver injury. World J Gastroenterol 12, 1937–1940. [DOI] [PMC free article] [PubMed] [Google Scholar]
- Blake M. J., Castro L., Leeder J. S., Kearns G. L. (2005). Ontogeny of drug metabolizing enzymes in the neonate. Semin. Fetal Neonatal Med. 10, 123–138. [DOI] [PubMed] [Google Scholar]
- Bookout A. L., Jeong Y., Downes M., Yu R. T., Evans R. M., Mangelsdorf D. J. (2006). Anatomical profiling of nuclear receptor expression reveals a hierarchical transcriptional network. Cell 126, 789–799. [DOI] [PMC free article] [PubMed] [Google Scholar]
- Chen W. D., Fu X., Dong B., Wang Y. D., Shiah S., Moore D. D., Huang W. (2012). Neonatal activation of the nuclear receptor CAR results in epigenetic memory and permanent change of drug metabolism in mouse liver. Hepatology 56, 1499–1509. [DOI] [PMC free article] [PubMed] [Google Scholar]
- Cui J. Y., Renaud H. J., Klaassen C. D. (2012). Ontogeny of novel cytochrome P450 gene isoforms during postnatal liver maturation in mice. Drug Metab. Dispos. 40, 1226–1237. [DOI] [PMC free article] [PubMed] [Google Scholar]
- Cui Y. J., Cheng X., Weaver Y. M., Klaassen C. D. (2009). Tissue distribution, gender-divergent expression, ontogeny, and chemical induction of multidrug resistance transporter genes (Mdr1a, Mdr1b, Mdr2) in mice. Drug Metab Dispos 37, 203–210. [DOI] [PMC free article] [PubMed] [Google Scholar]
- Diwan B. A., Lubet R. A., Ward J. M., Hrabie J. A., Rice J. M. (1992). Tumor-promoting and hepatocarcinogenic effects of 1,4-bis[2-(3,5-dichloropyridyloxy)]benzene (TCPOBOP) in DBA/2NCr and C57BL/6NCr mice and an apparent promoting effect on nasal cavity tumors but not on hepatocellular tumors in F344/NCr rats initiated with N-nitrosodiethylamine. Carcinogenesis 13, 1893–1901. [DOI] [PubMed] [Google Scholar]
- Down M. J., Arkle S., Mills J. J. (2007). Regulation and induction of CYP3A11, CYP3A13 and CYP3A25 in C57BL/6J mouse liver. Arch. Biochem. Biophys. 457, 105–110. [DOI] [PubMed] [Google Scholar]
- Finn R. D., Henderson C. J., Scott C. L., Wolf C. R. (2009). Unsaturated fatty acid regulation of cytochrome P450 expression via a CAR-dependent pathway. Biochem. J. 417, 43–54. [DOI] [PMC free article] [PubMed] [Google Scholar]
- Fisher C. D., Jackson J. P., Lickteig A. J., Augustine L. M., Cherrington N. J. (2008). Drug metabolizing enzyme induction pathways in experimental non-alcoholic steatohepatitis. Arch. Toxicol. 82, 959–964. [DOI] [PMC free article] [PubMed] [Google Scholar]
- Fu Z. D., Selwyn F. P., Cui J. Y., Klaassen C. D. (2016). RNA sequencing quantification of xenobiotic-processing genes in various sections of the intestine in comparison to the iver of male mice. Drug Metab. Dispos. 44, 842–856. [DOI] [PMC free article] [PubMed] [Google Scholar]
- Gao J., Xie W. (2010). Pregnane X receptor and constitutive androstane receptor at the crossroads of drug metabolism and energy metabolism. Drug Metab. Dispos. 38, 2091–2095. [DOI] [PMC free article] [PubMed] [Google Scholar]
- Ghaffari A. A., Chow E. K., Iyer S. S., Deng J. C., Cheng G. (2011). Polyinosinic-polycytidylic acid suppresses acetaminophen-induced hepatotoxicity independent of type I interferons and toll-like receptor 3. Hepatology 53, 2042–2052. [DOI] [PMC free article] [PubMed] [Google Scholar]
- Gupta R., Bhattacharyya A., Agosto-Perez F. J., Wickramasinghe P., Davuluri R. V. (2011). MPromDb update 2010: an integrated resource for annotation and visualization of mammalian gene promoters and ChIP-seq experimental data. Nucleic Acids Res 39, D92–D97. [DOI] [PMC free article] [PubMed] [Google Scholar]
- Hernandez J. P., Mota L. C., Baldwin W. S. (2009). Activation of CAR and PXR by dietary, environmental and occupational chemicals alters drug metabolism, intermediary metabolism, and cell proliferation. Curr. Pharmacogenomics Person. Med. 7, 81–105. [DOI] [PMC free article] [PubMed] [Google Scholar]
- Hines R. N. (2013). Developmental expression of drug metabolizing enzymes: Impact on disposition in neonates and young children. Int. J. Pharm. 452, 3–7. [DOI] [PubMed] [Google Scholar]
- Hines R. N., McCarver D. G. (2002). The ontogeny of human drug-metabolizing enzymes: Phase I oxidative enzymes. J. Pharmacol. Exp. Ther. 300, 355–360. [DOI] [PubMed] [Google Scholar]
- Inoue J., Satoh S., Kita M., Nakahara M., Hachimura S., Miyata M., Nishimaki-Mogami T., Sato R. (2008). PPARalpha gene expression is up-regulated by LXR and PXR activators in the small intestine. Biochem. Biophys. Res. Commun. 371, 675–678. [DOI] [PubMed] [Google Scholar]
- Jirtle R. L., Skinner M. K. (2007). Environmental epigenomics and disease susceptibility. Nat. Rev. Genet. 8, 253–262. [DOI] [PMC free article] [PubMed] [Google Scholar]
- Kassam A., Winrow C. J., Fernandez-Rachubinski F., Capone J. P., Rachubinski R. A. (2000). The peroxisome proliferator response element of the gene encoding the peroxisomal beta-oxidation enzyme enoyl-CoA hydratase/3-hydroxyacyl-CoA dehydrogenase is a target for constitutive androstane receptor beta/9-cis-retinoic acid receptor-mediated transactivation. J. Biol. Chem. 275, 4345–4350. [DOI] [PubMed] [Google Scholar]
- Kliewer S. A., Goodwin B., Willson T. M. (2002). The nuclear pregnane X receptor: A key regulator of xenobiotic metabolism. Endocr. Rev. 23, 687–702. [DOI] [PubMed] [Google Scholar]
- Lee J. M., Wagner M., Xiao R., Kim K. H., Feng D., Lazar M. A., Moore D. D. (2014). Nutrient-sensing nuclear receptors coordinate autophagy. Nature 516, 112–115. [DOI] [PMC free article] [PubMed] [Google Scholar]
- Li C. Y., Renaud H. J., Klaassen C. D., Cui J. Y. (2015). Age-specific regulation of drug-processing genes in mouse liver by ligands of xenobiotic-sensing transcription factors. Drug Metab. Dispos. 44, 1038–1049. [DOI] [PMC free article] [PubMed] [Google Scholar]
- Li T., Chiang J. Y. (2006). Rifampicin induction of CYP3A4 requires pregnane X receptor cross talk with hepatocyte nuclear factor 4alpha and coactivators, and suppression of small heterodimer partner gene expression. Drug Metab. Dispos. 34, 756–764. [DOI] [PMC free article] [PubMed] [Google Scholar]
- Lickteig A. J., Csanaky I. L., Pratt-Hyatt M., Klaassen C. D. (2016). Activation of Constitutive Androstane Receptor (CAR) in Mice Results in Maintained Biliary Excretion of Bile Acids Despite a Marked Decrease of Bile Acids in Liver. Toxicol Sci. 151(2), 403–418. [DOI] [PMC free article] [PubMed] [Google Scholar]
- Lu H., Gunewardena S., Cui J. Y., Yoo B., Zhong X. B., Klaassen C. D. (2013). RNA-sequencing quantification of hepatic ontogeny and tissue distribution of mRNAs of phase II enzymes in mice. Drug Metab. Dispos. 41, 844–857. [DOI] [PMC free article] [PubMed] [Google Scholar]
- Maglich J. M., Lobe D. C., Moore J. T. (2009). The nuclear receptor CAR (NR1I3) regulates serum triglyceride levels under conditions of metabolic stress. J. Lipid Res. 50, 439–445. [DOI] [PubMed] [Google Scholar]
- Mavrommatis E., Fish E. N., Platanias L. C. (2013). The schlafen family of proteins and their regulation by interferons. J. Interferon Cytokine Res. 33, 206–210. [DOI] [PMC free article] [PubMed] [Google Scholar]
- Miao J., Fang S., Bae Y., Kemper J. K. (2006). Functional inhibitory cross-talk between constitutive androstane receptor and hepatic nuclear factor-4 in hepatic lipid/glucose metabolism is mediated by competition for binding to the DR1 motif and to the common coactivators, GRIP-1 and PGC-1alpha. J. Biol. Chem. 281, 14537–14546. [DOI] [PubMed] [Google Scholar]
- Miao J., Xiao Z., Kanamaluru D., Min G., Yau P. M., Veenstra T. D., Ellis E., Strom S., Suino-Powell K., Xu H. E., et al. (2009). Bile acid signaling pathways increase stability of Small Heterodimer Partner (SHP) by inhibiting ubiquitin–proteasomal degradation. Genes Dev. 23, 986–996. [DOI] [PMC free article] [PubMed] [Google Scholar]
- Monsalve F. A., Pyarasani R. D., Delgado-Lopez F., Moore-Carrasco R. (2013). Peroxisome proliferator-activated receptor targets for the treatment of metabolic diseases. Mediators Inflamm. 2013, 549627.. [DOI] [PMC free article] [PubMed] [Google Scholar]
- Mooij M. G., Schwarz U. I., de Koning B. A. E., Leeder J. S., Gaedigk R., Samsom J. N., Spaans E., van Goudoever J. B., Tibboel D., Kim R. B., et al. (2014). Ontogeny of human hepatic and intestinal transporter gene expression during childhood: Age matters. Drug Metab. Dispos. 44, 1268–1274. [DOI] [PMC free article] [PubMed] [Google Scholar]
- Moore J. T., Moore L. B., Maglich J. M., Kliewer S. A. (2003). Functional and structural comparison of PXR and CAR. Biochim. Biophys. Acta 1619, 235–238. [DOI] [PubMed] [Google Scholar]
- Ngan E. S., Lee K. Y., Sit F. Y., Poon H. C., Chan J. K., Sham M. H., Lui V. C., Tam P. K. (2007). Prokineticin-1 modulates proliferation and differentiation of enteric neural crest cells. Biochim. Biophys. Acta 1773, 536–545. [DOI] [PubMed] [Google Scholar]
- Novince C. M., Michalski M. N., Koh A. J., Sinder B. P., Entezami P., Eber M. R., Pettway G. J., Rosol T. J., Wronski T. J., Kozloff K. M., et al. (2012). Proteoglycan 4: A dynamic regulator of skeletogenesis and parathyroid hormone skeletal anabolism. J. Bone Miner Res. 27, 11–25. [DOI] [PMC free article] [PubMed] [Google Scholar]
- Parkinson A. O. B., Buckley D. B., Kazmi F., Czerwinski M., Parkinson O. (2013). Biotransformation of xenobiotics In Casarett and Doull's Toxicology: The Basic Science of Poisons (Casarett L. J., Doull J., Klaassen C. D. Eds.), pp xv, 1310 p., 1311 leaf of plates, McGraw-Hill, New York. [Google Scholar]
- Pelkonen O., Kaltiala E. H., Larmi T. K. I., Kärki N. T. (1974). Cytochrome P-450-linked monooxygenase system and drug-induced spectral interactions in human liver microsomes. Chem. Biol. Interact. 9, 205–216. [DOI] [PubMed] [Google Scholar]
- Peng L., Cui J. Y., Yoo B., Gunewardena S. S., Lu H., Klaassen C. D., Zhong X. B. (2013). RNA-sequencing quantification of hepatic ontogeny of phase-I enzymes in mice. Drug Metab. Dispos. 41, 2175–2186. [DOI] [PMC free article] [PubMed] [Google Scholar]
- Peng L., Yoo B., Gunewardena S. S., Lu H., Klaassen C. D., Zhong X. B. (2012). RNA sequencing reveals dynamic changes of mRNA abundance of cytochromes P450 and their alternative transcripts during mouse liver development. Drug Metab. Dispos. 40, 1198–1209. [DOI] [PMC free article] [PubMed] [Google Scholar]
- Poland A., Mak I., Glover E. (1981). Species differences in responsiveness to 1,4-bis[2-(3,5-dichloropyridyloxy)]-benzene, a potent phenobarbital-like inducer of microsomal monooxygenase activity. Mol Pharmacol 20, 442–450. [PubMed] [Google Scholar]
- Robinson J. T., Thorvaldsdottir H., Winckler W., Guttman M., Lander E. S., Getz G., Mesirov J. P. (2011). Integrative genomics viewer. Nat. Biotechnol. 29, 24–26. [DOI] [PMC free article] [PubMed] [Google Scholar]
- Romano M., Esteve A., Coccia P., Masturzo P., Galliani G., Ghezzi P., Salmona M. (1986). Biochemical characterization of the hepatic effects in mice and rats of 1,4-bis[2-(3,5-dichloropyridyloxy)]benzene, a hepatic neoplasm promoter. Toxicol. Appl. Pharmacol. 83, 379–385. [DOI] [PubMed] [Google Scholar]
- Rosen S. D., Lemjabbar-Alaoui H. (2010). Sulf-2: An extracellular modulator of cell signaling and a cancer target candidate. Expert Opin. Ther. Targets 14, 935–949. [DOI] [PMC free article] [PubMed] [Google Scholar]
- Salem F., Johnson T. N., Barter Z. E., Leeder J. S., Rostami-Hodjegan A. (2013). Age related changes in fractional elimination pathways for drugs: Assessing the impact of variable ontogeny on metabolic drug-drug interactions. J. Clin. Pharmacol. 53, 857–865. [DOI] [PubMed] [Google Scholar]
- Sanderson L. M., Degenhardt T., Koppen A., Kalkhoven E., Desvergne B., Müller M., Kersten S. (2009). Peroxisome proliferator-activated receptor beta/delta (PPARbeta/delta) but not PPARalpha serves as a plasma free fatty acid sensor in liver. Mol. Cell Biol. 29, 6257–6267. [DOI] [PMC free article] [PubMed] [Google Scholar]
- Selwyn F. P., Cheng S. L., Klaassen C. D., Cui J. Y. (2015). Regulation of hepatic drug-metabolizing enzymes in germ-free mice by conventionalization and probiotics. Drug Metab. Dispos. 44, 262–274. [DOI] [PMC free article] [PubMed] [Google Scholar]
- Swales K., Negishi M. (2004). CAR, driving into the future. Mol. Endocrinol. 18, 1589–1598. [DOI] [PubMed] [Google Scholar]
- Takenobu H., Shimozato O., Nakamura T., Ochiai H., Yamaguchi Y., Ohira M., Nakagawara A., Kamijo T. (2011). CD133 suppresses neuroblastoma cell differentiation via signal pathway modification. Oncogene 30, 97–105. [DOI] [PubMed] [Google Scholar]
- Tien Y. C., Liu K., Pope C., Wang P., Ma X., Zhong X. B. (2015). Dose of phenobarbital and age of treatment at early life are two key factors for the persistent induction of cytochrome P450 enzymes in adult mouse liver. Drug Metab. Dispos. 43, 1938–1945. [DOI] [PMC free article] [PubMed] [Google Scholar]
- Topletz A. R., Dennison J. B., Barbuch R. J., Hadden C. E., Hall S. D., Renbarger J. L. (2013). The relative contributions of CYP3A4 and CYP3A5 to the metabolism of vinorelbine. Drug Metab. Dispos. 41, 1651–1661. [DOI] [PMC free article] [PubMed] [Google Scholar]
- Tordjman K., Bernal-Mizrachi C., Zemany L., Weng S., Feng C., Zhang F., Leone T. C., Coleman T., Kelly D. P., Semenkovich C. F. (2001). PPARalpha deficiency reduces insulin resistance and atherosclerosis in apoE-null mice. J. Clin. Invest. 107, 1025–1034. [DOI] [PMC free article] [PubMed] [Google Scholar]
- Wada T., Gao J., Xie W. (2009). PXR and CAR in energy metabolism. Trends Endocrinol. Metab. 20, 273–279. [DOI] [PubMed] [Google Scholar]
- Wagner M., Halilbasic E., Marschall H. U., Zollner G., Fickert P., Langner C., Zatloukal K., Denk H., Trauner M. (2005). CAR and PXR agonists stimulate hepatic bile acid and bilirubin detoxification and elimination pathways in mice. Hepatology 42, 420–430. [DOI] [PubMed] [Google Scholar]
- Wei P., Zhang J., Egan-Hafley M., Liang S., Moore D. D. (2000) The nuclear receptor CAR mediates specific xenobiotic induction of drug metabolism. Nature 407, 920–923. [DOI] [PubMed] [Google Scholar]
- Weinand K., Rindt W., Oertel G. W. (1966) [Biological half-life periods of C21-steroids in guinea pigs]. Acta Endocrinol (Copenh) 52, 319–324. [PubMed] [Google Scholar]
- Zandbergen F., Plutzky J. (2007). PPARalpha in atherosclerosis and inflammation. Biochim. Biophys. Acta 1771, 972–982. [DOI] [PMC free article] [PubMed] [Google Scholar]
- Zhou Y., Jiang L., Rui L. (2009). Identification of MUP1 as a regulator for glucose and lipid metabolism in mice. J. Biol. Chem. 284, 11152–11159. [DOI] [PMC free article] [PubMed] [Google Scholar]
Associated Data
This section collects any data citations, data availability statements, or supplementary materials included in this article.