

Abstract
The influence of interindividual variability is not typically assessed in traditional toxicological studies. Given that chemical exposures occur in heterogeneous populations, this knowledge gap has the potential to cause undue harm within the realms of public health and industrial and municipal finances. A recent report from the National Research Council (NRC) suggests that when accounting for interindividual variation in responses, traditionally assumed nonlinear dose-response relationships (DRRs) for noncancer-causing endpoints would better be explained with a linear relationship within the low-dose region. To address this knowledge gap and directly test the NRC’s assumption, this study focused on assessing the DRR between 2,3,7,8-tetracholorodibenzo-p-dioxin (TCDD) exposure and immune suppression in a cohort of unique human donors. Human B cells were isolated from 51 individual donors and treated with logarithmically increasing concentrations of TCDD (0–30 nM TCDD). Two endpoints sensitive to TCDD were assessed: (1) number of IgM-secreting B cells and (2) quantity of IgM secreted. The results show that TCDD significantly suppressed both the number of IgM-secreting B cells and the quantity of IgM secreted (P < .05). Statistical model comparisons indicate that the low-dose region of the two DRRs is best explained with a nonlinear relationship. Rather than assuming low-dose linearity for all noncancer-causing DRRs, our study suggests the need to consider the specific mode of action of toxicants and pharmaceuticals during risk-management decision making.
Keywords: TCDD, AHR, human B cells, dose response, risk assessment, genetic variability
Understanding of the dose-response relationship (DRR) for any given chemical lies at the heart of risk assessment. Traditionally, data derived from lab-based toxicology studies are extrapolated in assessing the potential adverse health effects of chemicals in the human population. As traditional laboratory-based toxicology studies are performed on a small number of individuals or inbred mouse strains and as chemical exposures occur in a heterogeneous population of individuals, there lies a disconnect between lab-based toxicology and population-level risk assessment. Little is known regarding the degree of variability in a DRR within a heterogeneous population (Rhomberg, 2011).
A recent report published by the National Research Council (NRC) suggested that interindividual variability within the human population would effectively linearize the low-dose region of DRRs for all noncancer-causing chemicals (NRC, 2009). This proposal by the NRC was based primarily on theoretical evidence and, if correct, would have significant implications in risk-management decision making (Rhomberg, 2009, 2011; White et al., 2009). As chemical exposures elicit toxicity through differing modes of action and as potencies will be dependent on many factors including genetic susceptibility, background exposures, and other concurrent stressors, a generalized statistical model for noncancer-causing effects of chemical exposures warrants scientific proof. Here, we address the NRCs assumption by statistically modeling the low-dose region of a receptor-mediated DRR induced by 2,3,7,8-tetrachlorodibenzo-p-dioxin (TCDD) using primary B cells isolated from 51 unique human individuals.
TCDD is a ubiquitous and persistent environmental contaminant primarily formed as a byproduct of waste-incineration and industrial processes. TCDD exposures are linked to several complex disease states in human cohorts including diabetes, metabolic syndrome, and cancer (Leng et al., 2014; Marinkovic et al., 2010; Uemura et al., 2009; Warner et al., 2013). TCDD is a potent activator of the aryl hydrocarbon receptor (AHR), an environment-sensing protein within the PAS superfamily (McIntosh et al., 2010). Prior to activation, the AHR is present in the cytoplasm bound to a dimer of the 90 kDA heat shock protein (HSP90) and the AHR-interacting protein (also known as ARA9 and XAP2) (Carver et al., 1998; Heid et al., 2000; LaPres et al., 2000; Meyer and Perdew, 1999). Upon ligand binding, the receptor translocates to the nucleus and dimerizes with the AHR nuclear translocator to form a functional transcription factor (Abel and Haarmann-Stemmann, 2010; Sorg, 2014). Activation of the AHR is responsible for most of TCDD-induced toxicity.
The immune system is a sensitive target of TCDD-induced toxicity (Holsapple et al., 1991; Kerkvliet, 2002). Within the immune system, TCDD has been established to directly alter B-cell function as evidenced by the suppression of humoral immune responses (Crawford et al., 2003; Sulentic et al., 1998). Although much of the current understanding of TCDD-induced B-cell dysfunction has been derived from mouse studies and murine cell lines, recent publications using primary cells have confirmed that TCDD suppresses the activation and differentiation of human B cells (Lu et al., 2010, 2011; Phadnis-Moghe et al., 2015). Furthermore, results from studies using a primary B-cell model indicated that a subset of the human donors did not respond to TCDD suggesting that this model might be valuable in modeling interindividual variability (Lu et al., 2010).
In this study, B cells were isolated from a large number of human donors (n = 51) to model the effect of increasing interindividual variability in a DRR. Two TCDD-sensitive endpoints were analyzed: (1) the number of IgM-secreting cells and (2) the quantity of IgM secreted during the period of culture (Crawford et al., 2003; Lu et al., 2010). The results from the endpoints were statistically modeled at the individual level and as an averaged population to address the potential effect of increasing interindividual variability in the shape of a DRR. As receptor-mediated responses may contain thresholds as information propagates through a cascade of downstream nonlinear processes (Kenakin, 2004; Zhang et al., 2014), an AHR-mediated response in our human B-cell model serves as an excellent platform in assessing whether nonlinear DRRs will linearize when encompassing interindividual variability (Bhattacharya et al., 2010; Zhang et al., 2010). Results from this study will inform risk assessment in regards to effect of human interindividual variability in TCDD-induced immunosuppression. In addition, we suggest that this study indicates the need to assess mode of action of chemical-induced signaling as opposed to adopting a generalized model when assessing risks associated with low-dose exposures.
MATERIALS AND METHODS
Human leukocyte packs
Human leukocytes packs from 51 unique, anonymous, and nonsmoking human donors were acquired from the Gulf Coast Regional Blood Center (Houston, Texas). Blood was screened for human immunodeficiency virus and hepatitis prior to shipment. Sex and age were not controlled. Given the anonymity of blood donation, institutional review board approval was not necessary.
B-cell isolation
Human naïve B cells were isolated from peripheral blood mononuclear cells (PBMCs) acquired via density gradient centrifugation of the blood in the presence of Ficoll-Paque Plus (GE Healthcare, Piscatawy, New Jersey). The PBMCs were subjected to negative selection of naïve B cells using magnetic-activated cell sorting naïve human B-cell II isolation kits per the manufacturer’s instructions (MiltenyiBiotec, Auburn, California). B-cell purity, as determined by flow cytometry (CD19+ cells), averaged 85%. Following isolation, B cells were cultured in RPMI 1640 supplemented with 10% human AB Serum (Atlantic Biologicals, Atlanta, Georgia), 100 U/ml of penicillin, 100 μg/ml of streptomycin, and 50 μM of 2-mercaptoethanol.
TCDD exposure
TCDD (99.1% pure) was purchased from AccuStandard, Incorporated (New Haven, Connecticut). Isolated naïve B cells (106 cells/ml) were left untreated (control), exposed to dimethyl sulfoxide (DMSO, 0.04%, vehicle control), or TCDD (0.0001, 0.001, 0.01, 0.1, 0.3, 1, 3, 10, and 30 nM).
CD40 ligand activation
Naïve human primary B cells were activated via coculture in the presence of a mouse fibroblast cell line that expresses membrane-bound human CD154/CD40 ligand (CD40L-L). CD40L-L cells were maintained in Dulbecco’s Modified Eagle Medium as previously described (Lu et al., 2009). Prior to coculturing, CD40L-L cells were irradiated and seeded in 48-well culture plates at 104 cells/ml for a minimum of 24 h. Immediately following TCDD treatment, the naïve B-cell cultures were supplemented with recombinant human interleukin-2 (0.2 U/ml; Roche Applied Sciences, Indianapolis, Indiana), interleukin-6 (1 U/ml; Roche Applied Sciences), interleukin-10 (0.2 ng/ml; Bender Medsystems, Burlingame, California), and co-cultured for 4 days with irradiated CD40L-expressing cells. The B cells were then transferred to new 48-well culture plates and cultured for an additional 3 days without CD40L-L cells. Culture conditions were maintained at 37 °C and 5% CO2.
Enzyme-linked immunospot assay
The number of IgM-secreting cells was quantified by enzyme-linked immunospot (ELISPOT) as previously described (Lu et al., 2010). Briefly, multiscreen 96-well filter plates (Millipore, Billerica, Massachusetts) were coated with antihuman IgM antibody (5 μg/ml) (Sigma Aldrich, St. Louis, Missouri) overnight and, subsequently, blocked with 5% bovine serum albumin (Sigma). B cells were washed with RPMI 1640, resuspended in RPMI 1640, supplemented with 10% bovine calf serum (HyClone, GE Healthcare) and incubated in primary antibody-coated plates overnight at 37 °C and 5% CO2. Biotin-conjugated antihuman IgM antibody (Sigma) and, subsequently, streptavidin-horseradish peroxidase (HRP) (Sigma) were added for 1-h incubation at 37 °C and 5% CO2. All incubations were followed with 3 washes with phosphate-buffered saline (pH 7.4) containing 0.1% Tween-20 (Sigma) and 3 washes with nanopure H2O. The spots were developed with an aminoethylcarbazole staining kit (Sigma). The number of spots per well between 0.0001 mm2 and 9.6372 mm2 were quantified via the Immunospot Software (Cellular Technology, Ltd, Shaker Heights, Ohio) and normalized to the number of viable cells plated in each well.
Enzyme-linked immunosorbent assay
The amount of IgM secreted into the culture media was quantified using a sandwich enzyme-linked immunosorbent assay (ELISA). Briefly, Immulon 4 HBX 96-well microtiter plates (VWR International, Radnor, Pennsylvania) were coated with antihuman IgM antibody (1 μg/ml; Sigma Aldrich) overnight. Culture media was incubated over primary antibody-coated plates (1 h, 37°C) and was followed by exposure to an antihuman IgM-HRP conjugate (Sigma; 1 h, 37 °C). Incubations were followed with 3 washes with phosphate-buffered saline (pH 7.4) containing 0.05% Tween-20 (Sigma) and one wash with nanopure H2O. 2,2'-Azino-bis(3-ethylbenzothiazoline-6-sulphonic acid) (ABTS, Roche Diagnostics) was then added as a colorimetric substrate for the HRP. The rate of colorimetric change was quantified with a Synergy HT microplate reader (BioTek, Winooski, Vermont) at 405 nM for 1 h. Concentration of IgM in media was calculated based on a standard curve (Sigma) created in each plate.
Statistical ANOVA
ANOVA with Dunnett’s 2-tailed post hoc was used to assess the potential differences between dose groups and the vehicle controls using version 3.0.2 of R (R Core Team, 2015). Statistical assumptions of constant variance and normality of the distributions were checked prior to analysis. All data were log-transformed to achieve a normal distribution prior to statistical analyses. P ≤ .05 was considered significant.
Defining nonresponsive donors
Given the anonymous nature of blood donation, unique individual B cells can only be assayed as technical replicates. As ANOVA to define statistical significance requires multiple biological replicates, a cut-off was used in defining “nonresponsive donors.” Any dose-response that indicated a ≤ 10% change was considered a nonresponsive donor for that particular endpoint.
Statistical modeling of the individual DRRs
All dose-response endpoints from the 51 donors were fit to statistical models at the individual (ie, 1 biological replicate) level. A series of models were fit using the BMD Software (U.S. Environmental Protection Agency or EPA) including the Hill, exponential 1, exponential 2, exponential 3, exponential 4, exponential 5, polynomial 2°, power, and a linear model (Supplementary Table 1). Model fit and statistical assumptions were assessed to ensure adherence to recommendations outlined by the EPA (Davis et al., 2011). All data were log-transformed to achieve a normal distribution and equal variance across dose groups prior to statistical analyses. All best fit model coefficients acquired from the BMD software were validated with maximum-likelihood estimation using code developed in-lab with the version 1.0.17 of the bbmle package in R (Bolker, 2010; R Core Team, 2015).
Statistical modeling of the population DRRs
The mean values for each dose group of each individual were combined (ie, 51 biological replicates) and used in assessing the shape of the low-dose region of the DRRs. Data were log-transformed to achieve a normal distribution and equal variance among dose groups prior to statistical analyses. First, the half-maximal inhibitory concentrations (IC50) for the DRRs was determined with maximum-likelihood estimations of the coefficients in a 4-parameter logistic model using code developed in-lab using bbmle package in R (Bolker, 2010; R Core Team, 2015). IC50 values were confirmed with Hill model coefficients that were acquired with the BMD software. The low-dose region of the DRRs was defined as those below the established IC50 values. The BMD software was then used to identify the best fitting model for the low-dose region of the DRRs. In all instances, statistical assumptions and model fit were assessed via the previously mentioned recommendations of the EPA (Davis et al., 2011). All coefficients acquired from the BMD software were validated with maximum-likelihood estimation using the bbmle package in R (Bolker, 2010; R Core Team, 2015).
RESULTS
TCDD-Induced Suppression of IgM Secretion From CD40L-Activated Human Primary B Cells
Results from the population of donors assayed indicate a significant reduction in both endpoints tested: (1) the number of IgM-secreting cells as determined by ELISPOT (Fig. 1A, n = 51) and (2) the quantity of secreted IgM in the supernatant at the end of the period as determined by ELISA (Fig. 1B, n = 49). Notably, statistically significant suppression was found at TCDD levels ≥ 0.3 nM for the number of cells secreting IgM (Fig. 1A, P ≤ .05, effect size (η2) = 0.14) and at ≥ 0.01 nM for the quantity of IgM present in the culture supernatant (Fig. 1B, P ≤ 0.05, effect size (η2) = 0.10). There were no significant differences between nontreated CD40-L-activated B cells and the vehicle (DMSO-treated) controls for either endpoint (data not shown).
FIG. 1.

2,3,7,8-tetracholorodibenzo-p-dioxin (TCDD)–induced suppression of IgM response in primary human B cells. Increasing levels of TCDD induces a dose-dependent decrease in the number of IgM-secreting cells (A; n = 51) and the concentration of IgM secreted into culture medium (B; n = 49). *P < .05 as compared with the vehicle Error bars indicate SEM response. Abbreviation: ELISPOT, enzyme-linked immunospot.
Variability in IgM Response of CD40L-Activated Human Primary B Cells
Different donors were found to respond to increasing (TCDD) to differing degrees suggesting a high degree of interindividual variability within the data sets (Fig. 2). Approximately 11% (6 of 51) of the donors appeared nonresponsive to TCDD-induced decrease in the number of B cells secreting IgM. This is similar to previously published research (Lu et al., 2010). In contrast to “responsive” donors whose B cells displayed significant suppression at ≥ 0.1 nM, the nonresponsive donors displayed no significant change in response at any TCDD concentration. Interestingly, there is a significant difference in the number of B cells secreting IgM when comparing the nonresponsive and responsive cohorts following exposure to the vehicle control (P = .043) (Fig. 3A). Such results suggest that the nonresponsive cohort’s B cells activate to a lesser degree in the presence of CD40 ligand. Unexpectedly in analyzing the concentration of IgM secreted into the media, the number of donors deemed nonresponsive dropped to approximately 8% (4 of 49) (Fig. 3B). Again, the concentration of IgM secreted in responsive cohort was found to be statistically lower at (TCDD) > 0.01, whereas the nonresponsive cohort was not statistically affected by TCDD. Unlike the previous endpoint that showed a statistical difference between the mean numbers of cells secreting IgM exposed to the vehicle control, this endpoint did not have statistical differences in comparing the responsive and nonresponsive cohort. The lack of statistical difference is likely due to the lack of statistical power in the nonresponsive cohort (n = 4) for this particular endpoint.
FIG. 2.

Interindividual variability in response to 2,3,7,8-tetracholorodibenzo-p-dioxin (TCDD)–induced suppression of IgM secretion. Percent inhibition for each individual donor was calculated by normalizing results from each dose to that individual’s vehicle control (100%). The black line indicates the mean response of all donors. Results indicate a large degree of differences amongst individual donor’s B cells response to increasing concentrations of TCDD within the endpoints of interest: (A) the number of cells secreting IgM (enzyme-linked immunospot [ELISPOT] data) and (B) the concentration of IgM secreted into the culture media (ELISA data).
FIG. 3.

Responsive and nonresponsive donors to increasing concentrations of 2,3,7,8-tetracholorodibenzo-p-dioxin (TCDD). Six donors were found to be nonresponsive to TCDD in enumerating the number of cells secreting IgM (enzyme-linked immunospot [ELISPOT], A). Nonresponsive donors displayed a significantly decreased number of IgM expressing cells when compared with the mean response of the responsive donors exposed to vehicle control (*P = .043). Four of the 6 nonresponsive donors identified in the ELISPOT were confirmed in the concentration of IgM secreted (ELISA, B). These 4 nonresponsive donors did not display a significantly decreased IgM in the media when compared with responsive donors exposed to dimethyl sulfoxide (DMSO).
Modeling the DRRs of the Individual Donors
Individual responses for both endpoints were fit to the models available in the BMD software. In all cases during modeling of the individual responses, the best fitting model was chosen by the lowest Akaike Index Criterion (AIC) value (Akaike, 1974). For the number of cells secreting IgM (ELISPOT data), most of the individual responses best fit to the exponential 4 model (29.4% Table 1) with a small percentage of donors that were best fit the linear model (3.9%, Table 1). For the quantity of IgM secreted (ELISA data), an equal percentage of individuals best fit to the Hill and Power model (30.6%, Table 1), whereas only a small number of individual donors fit to the linear model (2.0%, Table 1). The donors that best fit to linear models were all within the nonresponsive cohorts previously noted. Thus, as expected for a TCDD-induced receptor-mediated response, the vast majority of the individual responses best fit to nonlinear models.
TABLE 1.
Results of Modeling the Individual Donor DRRs
| Model Type | Percentage of Individuals |
|
|---|---|---|
| ELISPOT (n = 51) (%) | ELISA (n = 49) (%) | |
| Exponential 4 | 29.4 | 16.3 |
| Power | 17.6 | 30.6 |
| Exponential 2 | 17.6 | 6.1 |
| Hill | 15.7 | 30.6 |
| Polynomial 2° | 11.8 | 14.3 |
| Linear | 3.9 | 2.0 |
| Exponential 5 | 3.9 | 0 |
| Exponential 3 | 0 | 0 |
Results indicate the majority of the donors fit best to nonlinear models as opposed to the linear model. The results were acquired via the BMD software and were confirmed via maximum likelihood estimation R code written in-lab.
Determining Low-Dose Regions of Dose-Response Relationships
The goal of this study is to determine the shape of the DRR in the low-dose region of a noncancer DRR. In defining the low-dose region, the DRR of the number of IgM-secreting B cells (ELISPOT) and the quantity of IgM-secreted (ELISA) data were first fit to a 4-parameter logistic model using maximum likelihood estimation with R code written in-lab (Prentice, 1976). Results indicate that the TCDD-induced IC50 of the ELISPOT and ELISA data were 0.533 ± 0.954 and 0.003 ± 0.007 nM, respectively (Table 2). The IC50 values were further confirmed by the coefficient estimations from the fitting of the endpoints of interest to the Hill function using the BMD software (Table 2). Results were confirmed by visual inspection of a graphical representation of the models overlaying the log-transformed data (Supplementary Fig. 1A and B). The calculated IC50 values were used to define the cut-off point for the low-dose region of the DRR. Specifically, all doses below or at the next available dose of the IC50 were considered part of the low-dose region of the curve.
TABLE 2.
Maximum-likelihood Estimates of Coefficients for the 4-Parameter Logistic and Hill Models Fit to the Log-Transformed TCDD-induced DRRs
| Model Type | Coefficient | ELISPOT Results (n = 51) |
ELISA Results (n = 49) |
||
|---|---|---|---|---|---|
| Estimate | SE | Estimate | SE | ||
| 4-Parameter logistic | Upper (d) | 3.555 | 0.037 | 1.860 | 0.061 |
| Lower (a) | 3.131 | 0.137 | 1.375 | 0.132 | |
| Slope (b) | −0.409 | 0.229 | −0.275 | 0.185 | |
| IC50 (c) | 0.533 | 0.954 | 0.004 | 0.010 | |
| Hill model | Intercept (y) | 3.558 | 0.036 | 1.863 | 0.060 |
| Slope (v) | −0.431 | 0.158 | −0.477 | 0.122 | |
| Hill Coefficient (n) | 0.415 | 0.227 | 0.286 | 0.165 | |
| IC50 (k) | 0.555 | 0.984 | 0.003 | 0.006 | |
Results indicate the IC50 values for both endpoints measured: (1) the number of cells secreting IgM (ELISPOT) and (2) the concentration of IgM secreted in the culture media (ELISA).
Statistical Modeling the Low-Dose Region of DRR
The low-dose region of the number of B cells secreting IgM (ELISPOT) and the concentration of IgM-secreted (ELISA) data sets were fit to the models available in the BMD software to determine the best fitting statistical model. In comparing linear and nonlinear models, our results suggest that the low-dose region of both DRRs were best explained by the power model (Table 3). Based on the AIC values of the models available in the BMD software, the linear model was the least adequate in explaining the data (Supplementary Table 2). Results are also presented by overlaying the graphical representation of best-fitting power model and the linear model over the log-transformed response variable further suggesting that the power model fits better to the observed data (Figs. 4A and B). The results from the power and linear model of both DRRs were also reverse-transformed to visualize the shape within the low-dose region on a continuous, nontransformed scale (Supplementary Fig. 2A and B).
TABLE 3.
Coefficient Estimates and Akaike Criterion Results of the Low-dose Regions of the Log-transformed Response Variables
| Model Type | Coefficient | ELISPOT Results (n = 51) |
ELISA Results (n = 49) |
||
|---|---|---|---|---|---|
| Estimate | SE | Estimate | SE | ||
| Linear model | Intercept | 3.502 | 0.019 | 1.763 | 0.038 |
| Slope | −0.199 | 0.049 | −20.912 | 7.544 | |
| Akaike criterion | −463.96 | −117.1 | |||
| Power model | Intercept | 3.565 | 0.036 | 1.860 | 0.062 |
| Slope | −0.245 | 0.049 | −0.704 | 0.435 | |
| Power | −0.242 | 0.103 | 0.186 | 0.118 | |
| Akaike criterion | −470.6 | −119.8 | |||
Table indicates the model types fit, coefficient estimates, and the AIC values of the TCDD-induced DRRs of interest suggest that the power model best explains the low-dose region of the DRRs of interest: 1) number of B cells secreting IgM (ELISPOT) and 2) the concentration of IgM secreted into culture media (ELISA). All results were derived using the BMD software. All coefficient estimates were confirmed via maximum likelihood estimation R code written in-lab.
FIG. 4.
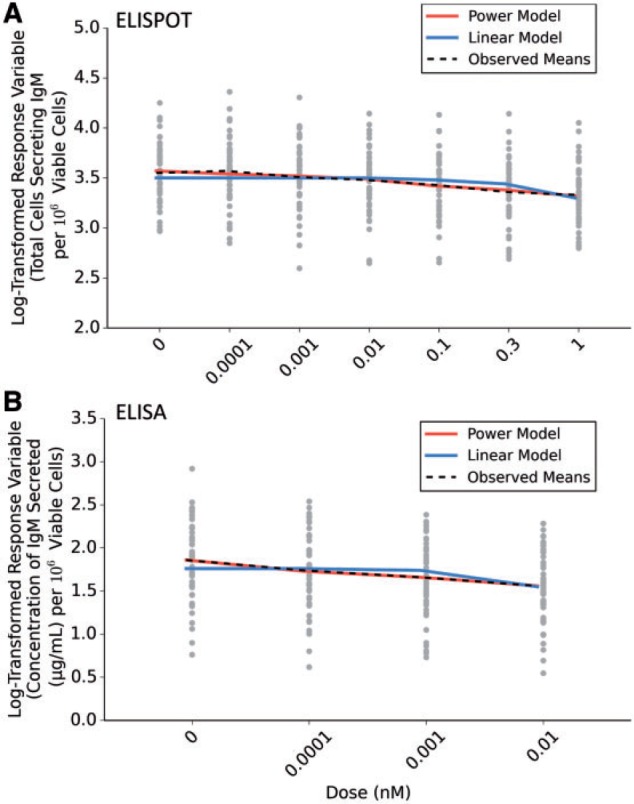
Statistical models fit to the low-dose region of 2,3,7,8-tetracholorodibenzo-p-dioxin (TCDD)–induced dose-response relationship. Graphs indicate the estimated fit of the power model better explains the low-dose region of the dose-response relationships (DRRs) as opposed to the linear model of the two endpoints of interest: the number of B cells secreting IgM and the (A) concentration of IgM secreted during the period of culture (B). Graphed models along with the observed means were plotted as an overlay over a scatterplot of the raw log-transformed data for each individual. Abbreviation: ELISPOT, enzyme-linked immunospot.
DISCUSSION
In a recent report entitled “Science and Decisions: Advancing Risk Assessment,” the NRC suggested that, during risk-management decision making, the low-dose region of noncancer DRRs should be assumed as linear without the presence of thresholds. As reviewed by Rhomberg et al. (2011), the NRC (2009) has based their assumption on 3 primary arguments: (1) the “additivity to background argument” that indicates that increasing exposure to agents will lead to linear increases of response over the spontaneous background levels in a population; 2) the “population heterogeneity argument” that suggests that, regardless of the shape of the individual DRRs, the dose-response curve will linearize when incorporating the interindividual variability of the human population; and (3) the “epidemiological evidence argument” that cites epidemiological studies that have suggested a no-threshold response to increasing exposures (White et al., 2009). The focus of this report is on the argument regarding population heterogeneity. Notably, as toxicological studies often focus on mechanistic details in single cell lines or inbred mouse strains, there are little data to inform on the influence of population heterogeneity on the shape of DRRs (Rhomberg, 2011). The NRC did not evaluate the potential effect of population heterogeneity with adequate peer-reviewed data sets (NRC, 2009). Foremost, the NRC’s assumption generalizes the shape of the low-dose region for all chemical exposures; however, as chemicals have different modes of action, it is unlikely that all chemically affected biological processes, such as receptor-mediated events, will result in a linear low-dose region (Bogen, 2016). Given the potential risks associated with invalid assumptions in regards to the low-dose regions of noncancer DRRs, such as unsafe exposures in susceptible individuals and financial burden associated with the chemical monitoring and cleanup, the NRC’s assumption warrants further scrutiny and evaluation.
Receptor-mediated responses, from a biochemical standpoint, are a nonlinear signaling process that may contain thresholds arising from downstream activation and saturation; such processes are traditionally modeled with a sigmoidal, Hill model (Kenakin, 2004). The nonlinear nature of receptor-mediated events provides an excellent platform to determine whether individual nonlinear responses will linearize in the low-dose region of a DRR when human interindividual variability is considered. In this study, we used AHR-mediated suppression of the IgM response of CD40L-activated human primary B cells to model the effect of increasing interindividual variability (Lu et al., 2009). Two endpoints of interest were measured following a 7-day exposure period: (1) the number of IgM-secreting cells and (2) the quantity of IgM secreted into the culture media. These two endpoints displayed concentration-dependent suppression of B-cell function following TCDD treatment (P < .05) (Figs. 1A and B). The results are in accordance with a previous report showing that TCDD significantly suppresses the number of cells secreting IgM (Lu et al., 2011). The IC50 from the two endpoints were found to differ over 150-fold. As determined by maximum likelihood-estimation, the IC50 for TCDD-induced suppression was 0.533 ± 0.954 nM for the number of B cells secreting IgM and 0.003 ± 0.007 nM for the quantity of IgM secreted (Table 2). Such results suggest that the endpoint measuring TCDD-induced suppression of IgM secreted by human B cells is more sensitive when compared with the decrease in IgM-secreting B cells. Notably, the disassociation constant (Kd) of the human AHR with TCDD is estimated between 1 and 12 nM and is dependent on the individual donor’s AHRs that were tested (Ema et al., 1994; Harper et al., 2002; Lorenzen and Okey, 1991). The IC50 found for the concentration of IgM secreted into culture media in this study is well below the Kd of the human AHR (Table 2). Such results suggest that very little AHR activation is required to see a robust response in the concentration of IgM secreted from human B cells.
As previously mentioned, variability in the sensitivity of individual’s AHR induction by TCDD suggests that some individuals are more susceptible to TCDD-induced toxicity than others (Harper et al., 2002; Lorenzen and Okey, 1991). Our results support this notion of hypersensitive individuals. For both endpoints, there were individuals whose IgM response was decreased at the lowest dose of TCDD (ie, 100 fM). Conversely, there were also individuals who displayed an increased ability to produce IgM response at low-dose TCDD. For both of these cases, there is a lack of statistical power to draw conclusions; however, both groups warrant further investigation. Given that the AHR mediates most of the TCDD-induced toxic responses and as polymorphisms in differing mouse strains affect sensitivity to TCDD, polymorphisms in the human AHR gene have been postulated to play a role in the interindividual variability in responses to TCDD (Okey, 2007; Okey et al., 2005). A previous report suggested that some human donors did not have B cells that responded to increasing concentrations of TCDD and this might be due to polymorphisms found in the transactivation domain of the AHR of these nonresponsive individuals (Harper et al., 2002; Lu et al., 2010). Similarly, a cohort of 6 nonresponsive donors appears to be activated to a lesser degree than the cohort of responsive donors in the present study (Fig. 2A). We hypothesize that the lack of response in the number of cells secreting IgM to TCDD is due to a lesser degree of CD40L-mediated activation of the B cells from these individuals as the number of cells secreting IgM was significantly decreased in these donors. Differences in CD40L activation among our cohort of donors may be due to a plethora of reasons including polymorphisms within CD40 receptor gene, previous and present exposures, infections, inflammation, and many other factors of which we are unable to gather information due to the anonymity of blood donation (Blanco-Kelly et al., 2010; Jacobson et al., 2005; Orozco et al., 2010; Raychaudhuri et al., 2008; Teruel et al., 2012). Surprisingly, 2 of the 6 nonresponsive donors were deemed responsive in assaying the concentration of IgM secreted into the media (ie, ELISA). Thus, even with a seemingly lesser number of cells secreting IgM, the concentration of IgM secreted is still affected by increasing (TCDD). Such results may be confounded as the ELISA is measuring the concentration of IgM being secreted over the 7-day period of exposure, whereas the ELISPOT enumerates the absolute number of cells secreting IgM at a specific time following exposure. Furthermore, these results suggest that, along with the IC50 values, the colorimetric ELISA is a more sensitive measure of the IgM response from activated B cells when compared with enumerating the number of IgM-secreting cells by ELISPOT.
The low-dose regions of the two dose-response curves were fit to all models available in the BMD software, and comparison metrics were used to assess goodness of fit. Our results indicate that the low-dose region of the TCDD-induced DRR for both endpoints of interest fit better to the power model as compared with the linear model (Table 3, Figs. 3A and B). As such, a nonlinear relationship best describes the low-dose region. To our knowledge, this is the largest study using unique donors to assess the effect of human interindividual variability with the low-dose region of a DRR. Based on the DRR data collected from this cohort, our statistical models of best fit to the low-dose region of these DRRs are contrary to the assumptions made by the NRC (NRC, 2009). However, we do acknowledge that our sample set of 51 unique donors does not model the genetic diversity in the human population, and further studies are needed to definitively test the NRC’s assumption. This present study, however, makes significant steps toward better risk-management decision making in regards to the effect of interindividual variability in the immunosuppression induced by TCDD, as well as, other receptor-mediated responses induced by toxicants and pharmaceuticals. The results of this study are also contrary to the adoption of a generalized model for linear low-dose effects in all noncancer endpoints as suggested by the NRC. Our results provide evidence that some chemical exposures, such as receptor-mediated toxicants, elicit nonlinear responses in the low-dose region of DRRs. Thus, perhaps there is a necessity to account for the chemical mode of action inducing noncancer-causing effects when making risk-management decisions.
SUPPLEMENTARY DATA
Supplementary data are available online at http://toxsci.oxfordjournals.org/.
ACKNOWLEDGMENTS
The authors would like to acknowledge and thank Dr Qiang Zhang and Dr Sudin Bhattacharya for critical review of this article. The authors would like to acknowledge Cailtin Viele, Joe Henriques, Mike Riozzi, Natasha Kovakola, and Dr Ashwini Phadnis for their technical support. The authors declared no competing conflicts of interest.
FUNDING
National Institute of Environmental Health Sciences Superfund Basic Research Program (NIEHS SBRP P42ES4911). J.J.L. is supported by AgBioResearch at Michigan State University. P.D. is supported by the National Institute of Environmental Health Sciences Training Grant at Michigan State University (T32 ES007255).
REFERENCES
- Abel J., Haarmann-Stemmann T. (2010). An introduction to the molecular basics of aryl hydrocarbon receptor biology. Biol. Chem. 391, 1235–1248. [DOI] [PubMed] [Google Scholar]
- Akaike H. (1974). A new look at the statistical model identification. Trans. Autom. Control IEEE 19, 716–723. [Google Scholar]
- Bhattacharya S., Conolly R. B., Kaminski N. E., Thomas R. S., Andersen M. E., Zhang Q. (2010). A bistable switch underlying B-cell differentiation and its disruption by the environmental contaminant 2,3,7,8-tetrachlorodibenzo-p-dioxin. Toxicol. Sci. 115, 51–65. [DOI] [PMC free article] [PubMed] [Google Scholar]
- Blanco-Kelly F., Matesanz F., Alcina A., Teruel M., Diaz-Gallo L. M., Gomez-Garcia M., Lopez-Nevot M. A., Rodrigo L., Nieto A., Cardena C., et al. (2010). CD40: novel association with Crohn's disease and replication in multiple sclerosis susceptibility. PloS One 5, e11520–e115. [DOI] [PMC free article] [PubMed] [Google Scholar]
- Bogen K. T. (2016). Linear-no-threshold default assumptions for noncancer and nongenotoxic cancer risks: a mathematical and biological critique. Risk Anal. 36(3), 589–604. [DOI] [PubMed] [Google Scholar]
- Bolker B. (2010). bbmle: Tools for general maximum likelihood estimation. In (doi. R package version 0.9).
- Carver L. A., LaPres J. J., Jain S., Dunham E. E., Bradfield C. A. (1998). Characterization of the Ah receptor-associated protein, ARA9. J. Biolo. Chem. 273, 33580–33587. [DOI] [PubMed] [Google Scholar]
- Crawford R. B., Sulentic C. E., Yoo B. S., Kaminski N. E. (2003). 2,3,7,8-Tetrachlorodibenzo-p-dioxin (TCDD) alters the regulation and posttranslational modification of p27kip1 in lipopolysaccharide-activated B cells. Toxicol. Sci. 75, 333–342. [DOI] [PubMed] [Google Scholar]
- Davis J. A., Gift J. S., Zhao Q. J. (2011). Introduction to benchmark dose methods and U.S. EPA's benchmark dose software (BMDS) version 2.1.1. Toxicol. Appl. Pharmacol. 254, 181–191. [DOI] [PubMed] [Google Scholar]
- Ema M., Ohe N., Suzuki M., Mimura J., Sogawa K., Ikawa S., Fujii-Kuriyama Y. (1994). Dioxin binding activities of polymorphic forms of mouse and human arylhydrocarbon receptors. J. Biol. Chem. 269, 27337–27343. [PubMed] [Google Scholar]
- Harper P. A., Wong J., Lam M. S., Okey A. B. (2002). Polymorphisms in the human AH receptor. Chem. Biol. Interact. 141, 161–187. [DOI] [PubMed] [Google Scholar]
- Heid S. E., Pollenz R. S., Swanson H. I. (2000). Role of heat shock protein 90 dissociation in mediating agonist-induced activation of the aryl hydrocarbon receptor. Mol. Pharmacol. 57, 82–92. [PubMed] [Google Scholar]
- Holsapple M. P., Morris D. L., Wood S. C., Snyder N. K. (1991). 2,3,7,8-tetrachlorodibenzo-p-dioxin-induced changes in immunocompetence: possible mechanisms. Annu. Rev. Pharmacol. Toxicol. 31, 73–100. [DOI] [PubMed] [Google Scholar]
- Jacobson E. M., Concepcion E., Oashi T., Tomer Y. (2005). A Graves' disease-associated Kozak sequence single-nucleotide polymorphism enhances the efficiency of CD40 gene translation: a case for translational pathophysiology. Endocrinology 146, 2684–2691. [DOI] [PubMed] [Google Scholar]
- Kenakin T. (2004). Principles: receptor theory in pharmacology. Trends Pharmacol. Sci. 25, 186–192. [DOI] [PubMed] [Google Scholar]
- Kerkvliet N. I. (2002). Recent advances in understanding the mechanisms of TCDD immunotoxicity. Int. Immunopharmacol. 2, 277–291. [DOI] [PubMed] [Google Scholar]
- LaPres J. J., Glover E., Dunham E. E., Bunger M. K., Bradfield C. A. (2000). ARA9 modifies agonist signaling through an increase in cytosolic aryl hydrocarbon receptor. J. Biol. Chem. 275, 6153–6159. [DOI] [PubMed] [Google Scholar]
- Leng L., Chen X., Li C. P., Luo X. Y., Tang N. J. (2014). 2,3,7,8-Tetrachlorodibezo-p-dioxin exposure and prostate cancer: a meta-analysis of cohort studies. Public Health 128, 207–213. [DOI] [PubMed] [Google Scholar]
- Lorenzen A., Okey A. B. (1991). Detection and characterization of Ah receptor in tissue and cells from human tonsils. Toxicol. Appl. Pharmacol. 107, 203–214. [DOI] [PubMed] [Google Scholar]
- Lu H., Crawford R. B., Kaplan B. L., Kaminski N. E. (2011). 2,3,7,8-Tetrachlorodibenzo-p-dioxin-mediated disruption of the CD40 ligand-induced activation of primary human B cells. Toxicol. Appl. Pharmacol. 255, 251–260. [DOI] [PMC free article] [PubMed] [Google Scholar]
- Lu H., Crawford R. B., North C. M., Kaplan B. L., Kaminski N. E. (2009). Establishment of an immunoglobulin m antibody-forming cell response model for characterizing immunotoxicity in primary human B cells. Toxicol. Sci. 112, 363–373. [DOI] [PMC free article] [PubMed] [Google Scholar]
- Lu H., Crawford R. B., Suarez-Martinez J. E., Kaplan B. L., Kaminski N. E. (2010). Induction of the aryl hydrocarbon receptor-responsive genes and modulation of the immunoglobulin M response by 2,3,7,8-tetrachlorodibenzo-p-dioxin in primary human B cells. Toxicol. Sci. 118, 86–97. [DOI] [PMC free article] [PubMed] [Google Scholar]
- Marinkovic N., Pasalic D., Ferencak G., Grskovic B., Stavljenic Rukavina A. (2010). Dioxins and human toxicity. Arh. Hig. Rada. Toksikol. 61, 445–453. [DOI] [PubMed] [Google Scholar]
- McIntosh B. E., Hogenesch J. B., Bradfield C. A. (2010). Mammalian Per-Arnt-Sim proteins in environmental adaptation. Ann. Rev. Physiol. 72, 625–645. [DOI] [PubMed] [Google Scholar]
- Meyer B. K., Perdew G. H. (1999). Characterization of the AhR-hsp90-XAP2 core complex and the role of the immunophilin-related protein XAP2 in AhR stabilization. Biochemistry 38, 8907–8917. [DOI] [PubMed] [Google Scholar]
- NRC (2009). Science and decisions: advancing risk assessment In Science and Decisions: Advancing Risk Assessment. National Academy of Sciences, Washington DC. [Google Scholar]
- Okey A. B. (2007). An aryl hydrocarbon receptor odyssey to the shores of toxicology: The Deichmann Lecture, International Congress of Toxicology-XI. Toxicol. Sci. 98, 5–38. [DOI] [PubMed] [Google Scholar]
- Okey A. B., Franc M. A., Moffat I. D., Tijet N., Boutros P. C., Korkalainen M., Tuomisto J., Pohjanvirta R. (2005). Toxicological implications of polymorphisms in receptors for xenobiotic chemicals: the case of the aryl hydrocarbon receptor. Toxicol. Appl. Pharmacol. 207(2 Suppl), 43–51. [DOI] [PubMed] [Google Scholar]
- Orozco G., Eyre S., Hinks A., Ke X., Wilson A. G., Bax D. E., Morgan A. W., Emery P., Steer S., Hocking L., et al. (2010). Association of CD40 with rheumatoid arthritis confirmed in a large UK case-control study. Ann. Rheum. Dis. 69, 813–816. [DOI] [PMC free article] [PubMed] [Google Scholar]
- Phadnis-Moghe A. S., Crawford R. B., Kaminski N. E. (2015). Suppression of human B cell activation by 2,3,7,8-tetrachlorodibenzo-p-dioxin involves altered regulation of B cell lymphoma-6. Toxicol. Sci. 144, 39–50. [DOI] [PMC free article] [PubMed] [Google Scholar]
- Prentice R. L. (1976). A generalization of the probit and logit methods for dose response curves. Biometrics 32, 761–768. [PubMed] [Google Scholar]
- R Core Team (2015). R: A language and environment for statistical computing [Internet]. Vienna, Austria: R Foundation for Statistical Computing; 2013. Document freely available on the internet at: http://www.r-project.org. Accessed July 19, 2016.
- Raychaudhuri S., Remmers E. F., Lee A. T., Hackett R., Guiducci C., Burtt N. P., Gianniny L., Korman B. D., Padyukov L., Kurreeman F. A., et al. (2008). Common variants at CD40 and other loci confer risk of rheumatoid arthritis. Nat. Genet. 40, 1216–1223. [DOI] [PMC free article] [PubMed] [Google Scholar]
- Rhomberg L. R. (2009). Linear low-dose extrapolation for noncancer responses is not generally appropriate. Environ. Health Perspect. 117, A141–A142. author reply A142-3. [DOI] [PMC free article] [PubMed] [Google Scholar]
- Rhomberg L. R. (2011). Practical risk assessment and management issues arising were we to adopt low-dose linearity for all endpoints. Dose Response 9, 144–157. [DOI] [PMC free article] [PubMed] [Google Scholar]
- Sorg O. (2014). AhR signalling and dioxin toxicity. Toxicol. Lett. 230, 225–233. [DOI] [PubMed] [Google Scholar]
- Sulentic C. E., Holsapple M. P., Kaminski N. E. (1998). Aryl hydrocarbon receptor-dependent suppression by 2,3,7, 8-tetrachlorodibenzo-p-dioxin of IgM secretion in activated B cells. Mol. Pharmacol. 53, 623–629. [PubMed] [Google Scholar]
- Teruel M., Simeon C. P., Broen J., Vonk M. C., Carreira P., Camps M. T., Garcia-Portales R., Delgado-Frias E., Gallego M., Espinosa G., et al. (2012). Analysis of the association between CD40 and CD40 ligand polymorphisms and systemic sclerosis. Arthritis Res. Ther. 14, R154–R110. [DOI] [PMC free article] [PubMed] [Google Scholar]
- Uemura H., Arisawa K., Hiyoshi M., Kitayama A., Takami H., Sawachika F., Dakeshita S., Nii K., Satoh H., Sumiyoshi Y., et al. (2009). Prevalence of metabolic syndrome associated with body burden levels of dioxin and related compounds among Japan's general population. Environ. Health Perspect. 117, 568–573. [DOI] [PMC free article] [PubMed] [Google Scholar]
- Warner M., Mocarelli P., Brambilla P., Wesselink A., Samuels S., Signorini S., Eskenazi B. (2013). Diabetes, metabolic syndrome, and obesity in relation to serum dioxin concentrations: the Seveso women's health study. Environ. Health Perspect. 121, 906–911. [DOI] [PMC free article] [PubMed] [Google Scholar]
- White R. H., Cote I., Zeise L., Fox M., Dominici F., Burke T. A., White P. D., Hattis D. B., Samet J. M. (2009). State-of-the-science workshop report: issues and approaches in low-dose-response extrapolation for environmental health risk assessment. Environ. Health Perspect. 117, 283–287. [DOI] [PMC free article] [PubMed] [Google Scholar]
- Zhang Q., Bhattacharya S., Conolly R. B., Clewell H. J., Kaminski N. E., Andersen M. E. (2014). Molecular signaling network motifs provide a mechanistic basis for cellular threshold responses. Environ. Health Perspect. 122, 1261–1270. [DOI] [PMC free article] [PubMed] [Google Scholar]
- Zhang Q., Bhattacharya S., Kline D. E., Crawford R. B., Conolly R. B., Thomas R. S., Kaminski N. E., Andersen M. E. (2010). Stochastic modeling of B lymphocyte terminal differentiation and its suppression by dioxin. BMC Syst. Biol. 4, 40.. [DOI] [PMC free article] [PubMed] [Google Scholar]
Associated Data
This section collects any data citations, data availability statements, or supplementary materials included in this article.