Abstract
Presented is an evaluation of phase contrast techniques in transmission electron microscopy. The traditional defocus phase contrast is compared to two recently developed phase plate techniques. One is the Zernike phase contrast transmission electron microscope, the other is the Hilbert differential contrast thransmission electron microscope. The imaging characteristics of each technique are discussed. Phase plate techniques provide improved contrast for ice-embedded biological samples which are a challenge for the conventional defocus phase contrast. The flat spectral response of the Zernike and Hilbert modes extends towards the low frequencies which are severely suppressed in the conventional defocus mode. Target applications for each of the phase contrast techniques are discussed based on the specifics of image formation and spectral transfer.
Keywords: CTF, phase contrast, ice-embedded, image formation, reconstruction
Recently a new push in the application of thin film phase plates in Transmission Electron Microscopy (TEM) was initiated1–12. Observation of weak biological specimens is improved by the higher contrast and wider information transfer of the phase plate techniques. Currently the development is focused on two such techniques employing two different kinds of phase plates. One utilizes a π/2 Zernike phase plate positioned at the back focal plane of the objective lens2,3,6,10,12. The other uses a π half-plane phase plate also positioned at the diffraction plane5,6,7,9,11.
There have been many attempts in the past to implement a Zernike phase plate in TEM13–17. All of these attempts demonstrated some improvement in image contrast. However, various difficulties in the manufacturing and practical application of the phase plates prevented the technique from being widely accepted. The developments in recent years solved most of the practical problems and made the use of phase plates a reasonable extension to the existing TEM techniques.
The π half-plane phase plate is a recent invention5,7. It produces a topographic contrast similar to the Nomarski phase contrast in light microscopy. The phase contrast technique using this kind of phase plate was called Hilbert Differential Contrast TEM (HDC-TEM)7 because the contrast it produces is based on the Hilbert transform.
In this article we try to summarize the properties of each phase contrast technique including the conventional Defocus Phase Contrast TEM (DPC-TEM). Considering various parameters like resolution range and information transfer we can distinguish various applications for each technique in the biological TEM field.
Phase contrast techniques in TEM
Defocus Phase Contrast TEM
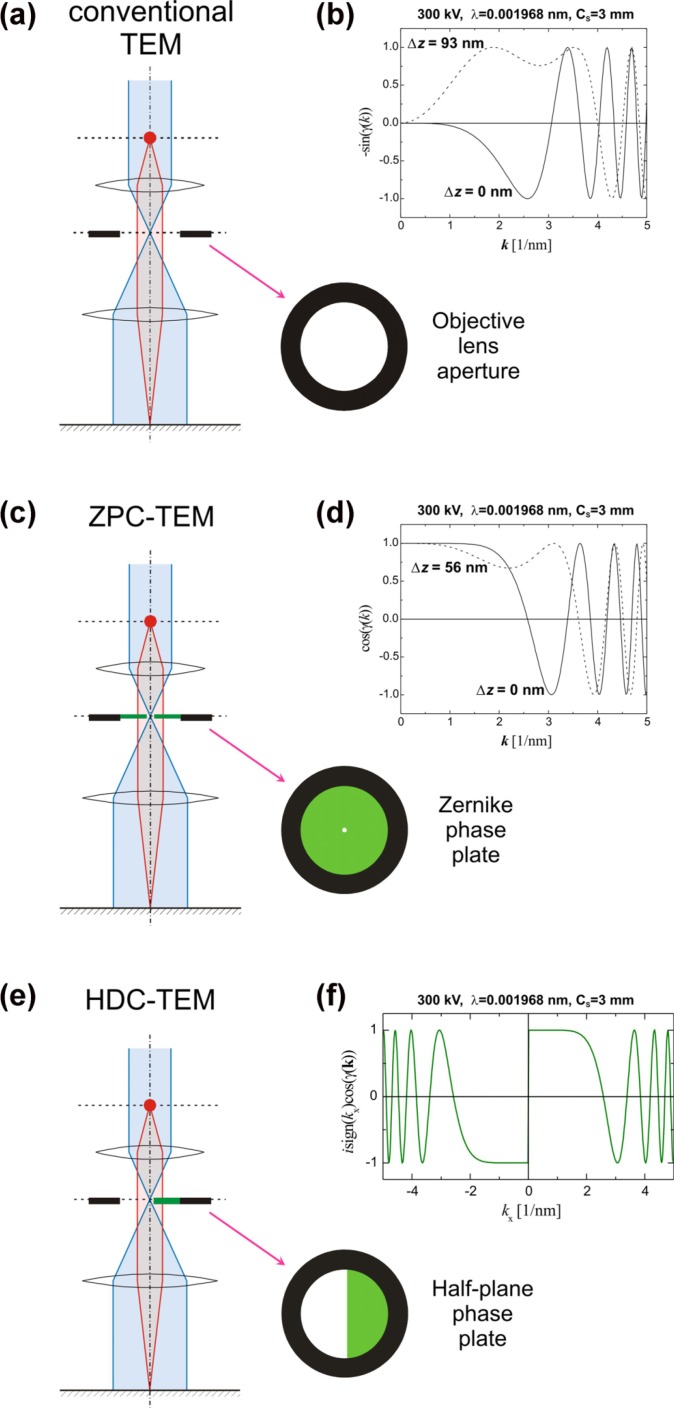
In Fig. 1a is shown a scheme of the conventional TEM. It employs a circular aperture at the back focal plane of the objective lens which intercepts electrons scattered outside the radius of the aperture. Two kinds of contrast generation are important in the observation of biological samples by conventional TEM. If the sample is stained by heavy elements some of the incident electrons are scattered at high angles and thus intercepted by the objective aperture. This produces amplitude (or aperture) contrast in the final image. Areas which have more of the staining agent appear darker in the image. Staining however is a double-edged sword. It increases the contrast but also introduces artifacts and limits the resolution because of the non-uniformity and granularity of the stain.
Figure 1.
(a) Scheme of the conventional TEM and its phase CTFs (b). (c) Scheme of the Zernike phase contrast TEM and its phase CTFs (d). (e) Scheme of the Hilbert differential contrast TEM and its phase CTF (f).
In recent years the tendency in biological TEM is towards observation of the samples in their natural state. In most cases this means cryo-preparation without staining or other contrast-enhancement techniques. Such samples are composed of light elements and do not produce any amplitude contrast. Observation must rely on phase contrast.
In conventional TEM phase contrast can be initiated by defocusing the objective lens. Depending on the amount of defocus the spectral characteristics of phase information transfer change. In Fig. 1b is shown a plot of the phase Contrast Transfer Function (pCTF) describing the amount of phase information transfer as a function of the spatial frequency. The pCTF has an oscillating character and the frequency of oscillation increases with increasing of the spatial frequency. It starts from zero at the center of the k-space. Thus it acts as a band-pass filter. Low frequency information is severely suppressed leading to overall low contrast in images of unstained biological samples. Increasing the defocus value can improve the low frequency transfer but severely reduces the upper frequency limit and the resolution in that respect.
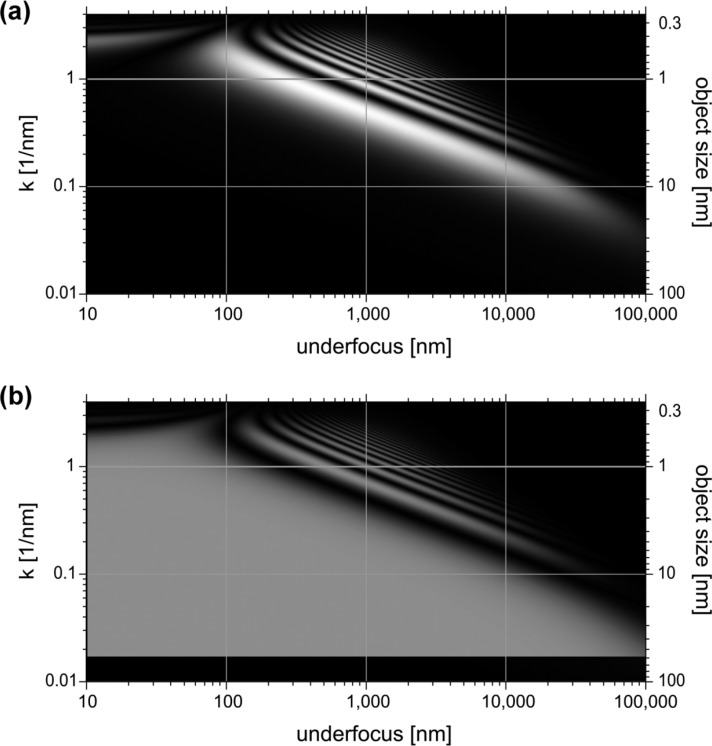
Fig. 2a shows a simulated conventional pCTF in what we would like to call a “CTF map”. The plot represents the phase information transfer as a function of spatial frequency and defocus. Effects of energy spread and defocus are included in this simulation resulting in damping of the pCTF at high spatial frequencies with increasing of the defocus. The grayscale is linear and adjusted with black corresponding to 0 and white corresponding to 1. The axes are in logarithmic scale making the data easy to interpret. The scale of the right vertical axis is reciprocal to the spatial frequency. It represents characteristic object size or periodicity.
Figure 2.
Phase CTF maps of (a) conventional TEM and (b) Zernike phase contrast TEM.
The band-pass properties of the conventional TEM are well illustrated by Fig. 2a. The widest region of information transfer is before the first zero of the pCTF. The information in this first region represents directly the phase of the object. Due to change of the sign the following regions of the pCTF cannot be used without numerical reconstruction. The information in these regions is added as distracting modulation to the image. In practice the defocus value is selected depending on the object and the purpose of the observation. If the object has characteristic size or periodicity the defocus is selected so that the corresponding spatial frequency is in the middle of the first pCTF region. For example in this simulation if we observe a 2 nm size object defocus of about 1000 nm will give the best phase contrast. A technique called “defocus series” is used to cover a wider range of spatial frequencies. Usually three or more images are taken at different defocus values. The defocus values are selected so that there is overlap of the first pCTF regions between the images. After a numerical reconstruction the data is combined into a single image containing a wide range of frequency information. In this example taking three images at 100 nm, 1000 nm and 10000 nm defocus will cover the information region between 0.4 nm and 10 nm.
Low contrast cryo-specimens are very sensitive to high energy electron irradiation. The total dose that a given area can tolerate is limited. Thus the band-pass properties of the conventional TEM result in an information loss. One of the techniques trying to overcome this limitation by covering a wider information range is the use of thin film phase plates.
Zernike Phase Contrast TEM
Fig. 1c shows the scheme of a Zernike Phase Contrast TEM (ZPC-TEM). The only difference to the conventional TEM is the presence of a phase plate at the back focal plane of the objective lens. An aperture supports the thin film of the phase plate. The theory of contrast transfer for ZPC-TEM was presented elsewhere1–3. Fig. 2b shows the CTF map of the phase CTF of ZPC-TEM. The first thing to notice is the wide region of uniform information transfer. The region is limited by the first zero of the pCTF at the upper side. The low frequency limit is determined by the size of the hole in the center of the Zernike phase plate. The simple formula for the low end space frequency threshold is:
| (1) |
where rh is the radius of the hole, f is the focal length of the objective lens and λ is the wavelength. Lower kh means that bigger object details will exhibit phase contrast. Widening the information transfer will require lowering the kh. However there are some practical limitations. For a fixed setup (fixed f and λ) the size of the hole rh must be reduced to reduce kh. Manufacturing of holes with size in the order of hundred nanometers is not a challenge for the current technology, using a Focused Ion beam (FIB) for example. The minimum usable hole size is determined by the parameters of the TEM. Depending on the electron source and lenses the size of the central beam at the diffraction plane could be the limiting factor. The hole must be large enough for the central beam of unscattered electrons to pass through. With field-emission guns the central spot size is in the order of tens of nanometers. With such setups other factors determine the smallest usable hole.
The mechanical alignment precision and stability of the phase plate should be considered. Recently heating of the phase plate was implemented to avoid beam induced contamination7,10. In such setup inserting and removing the phase plate in the beam path changes the thermal environment of the phase plate holder. This leads to change in temperature and consequently thermal drift of the phase plate. In our experiments we insert the phase plate and wait for the thermal drift to settle. Then during the whole observation session we keep the phase plate in the beam path thus avoiding the problems with drifting.
Specimen charging is one seemingly unrelated factor which limits the phase plate hole size. Ice-embedded specimens are non-conductive except for the carbon film surrounding the ice area. Charges are accumulated on the surface or in the bulk of the ice during irradiation. Severe charging of the specimen interacts with the electron beam at long range and can affect the image. The resulting effects are variation of the image size, drift or jumping in parts of the image and changes of the illumination beam size. Taking some precautions can in most cases eliminate strong charging effects. The easiest and most often used method is to always have some conductive material in the illuminated area. Supporting carbon film or a metal grid bar are appropriate for that purpose. Secondary electrons generated from the conductive part “shower” and discharge the insulating part of the observation field. Even with these precautions there is still some mild charging which is not observable in the image. Acting on the beam at short range from the specimen the result is only change of the beam tilt angle. Beam tilt changes are reflected at the diffraction plane as shifts and distortion. When working in a minimum dose protocol there is no possibility to check alignment of the phase plate before taking the picture. The whole dose to the sample should be used for the photograph. In such cases the effects of specimen charging on the position and shape of central beam at the back focal plane are important. The hole in the phase plate must be large enough to accommodate these fluctuations.
Holey carbon grids with equally sized small holes proved to be very useful in ZPC-TEM observations of small particles such as proteins and viruses. Such grids are sold under the trade name Quantifoil®. The smallest available hole size is 1.2 μm. With such grids it is possible to setup a photographing condition where the ice film in the center is surrounded by illuminated carbon film all around. This greatly reduces the specimen charging. The remaining charge is symmetric and its effect similar to change of the illumination angle. It can be compensated by slight adjustment to the “brightness” by the last condenser lens. Because all holes on a Quantifoil® grid are the same size the charging effects between consequential photographs are almost identical. Very small adjustments are needed during the observation session once the optimal condition has been set.
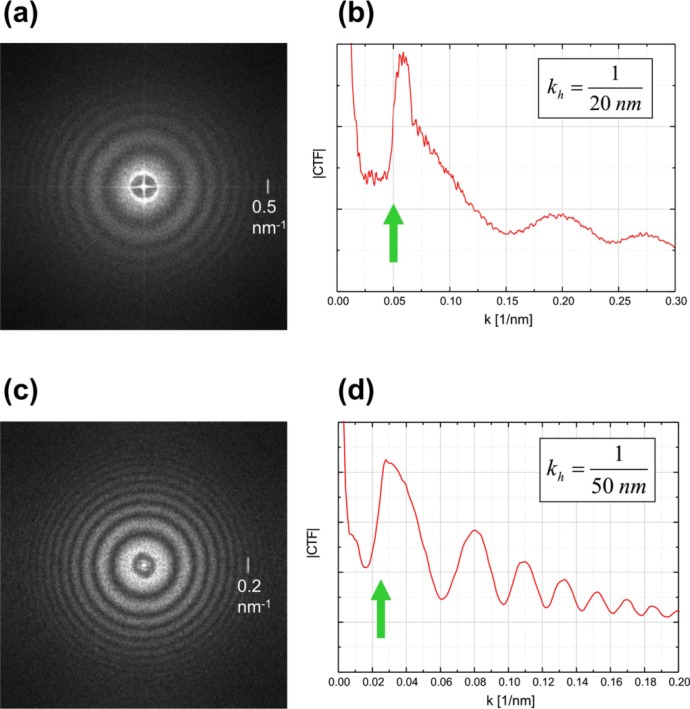
In the first ZPC-TEM trials phase plates with 1 μm diameter central hole were used2,3. After many experiments and accumulating experience we are currently employing 0.3 μm hole phase plates. In Figs. 3a, c are shown experimental pCTFs taken with 1 μm and 0.3 μm phase plates respectively. The low cutoff frequency (indicated by green arrows in Figs. 3b, d) is improved from 20 nm to 50 nm object periodicity.
Figure 3.
(a) modulus of the Fourier transform of an image (shown in Fig. 4a) taken with a 1 μm hole Zernike phase plate, defocus 11.3 μm. (b) rotational average of (a), the cutoff due to phase plate hole size is indicated by a green arrow. (c) modulus of the Fourier transform of an image taken with a 0.3 μm hole Zernike phase plate, defocus 70.5 μm. (d) rotational average of (c).
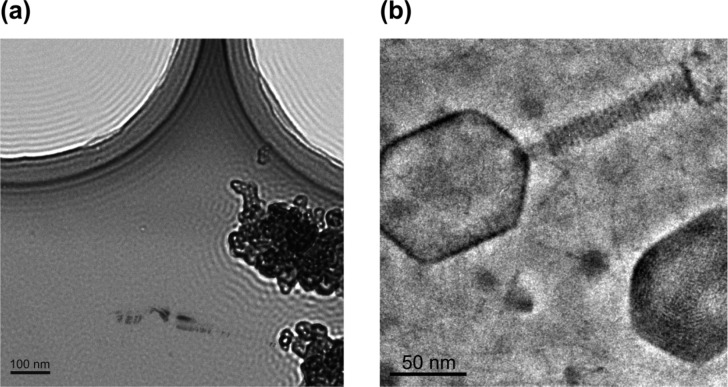
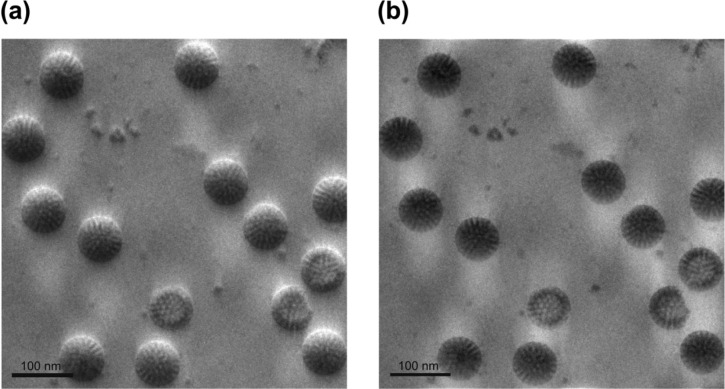
Figs. 4a, b demonstrate the effect of the finite size of the phase plate hole on the appearance of the image. The Fourier transform of Fig. 4a is presented in Fig. 3a. There is a sharp jump in the Fourier space at the edge of the phase plate indicated by a green arrow in Fig. 3b. It is well known that sharp jumps in the Fourier space produce “ringing” in the real space. In Fig. 4a fringes are clearly observed around the edges of the holey carbon film and the graphite flakes. The ringing due to phase plate hole cutoff is most severe around high contrast edges in the image. Fig. 4b shows image of ice embedded T4 phage viruses. A bright fringe is noticeable around the tail and head of the virus. However due to the low contrast of ice embedded specimens such fringes are not a significant problem.
Figure 4.
Fringes around strong edges in the image due to the finite size of the phase plate hole. (a) graphite flakes on holey carbon. Image taken with a 1 μm hole Zernike phase plate, Fourier transform shown in Fig. 3a, defocus 11.3 μm. (b) ice-embedded T4-phage virus (Hirokawa, H., Danev, R., Arisaka, F. and Nagayama, K., unpublished data). Image taken with a 0.3 μm hole Zernike phase plate, defocus 350 nm.
Scattering from the material of the phase plate film can reduce the information transfer3. In Fig. 2b the wide uniform region of information transfer in not perfectly white. The simulation was performed for 300 kV electrons. In this case the total scattering from carbon film with thickness for π/2 phase shift is about 28% leaving about 72% of the image forming electrons unaffected. Other materials could provide slightly better performance with less scattering3. For various practical reasons carbon was used until now for phase plate preparation. In future other materials or composites may be explored.
Fig. 2b illustrates that the optimal focus for ZPC-TEM is close to the just focus condition. The exact value of the optimal defocus for ZPC-TEM was discussed elsewhere3. The optimal condition does not depend on the specimen. It corresponds to the widest information transfer region. In practice all ZPC-TEM observations should be performed at close to focus or very slight underfocus condition.
In Eq.(1) the focal length of the objective lens is in denominator. Objectives with longer focal length will have lower kh for the same hole size. In biological cryo-TEMs the objective lens usually has wider gap and thus longer focal length. This is a beneficial situation for application of thin film phase plates.
Hilbert Differential Contrast TEM
Fig. 1e illustrates the Hilbert Differential Contrast TEM (HDC-TEM). A semi-circular phase plate is positioned at the back focal plane of the objective lens. The thickness of the phase plate film is adjusted for π phase shift. The zero diffraction beam is positioned in the center of the supporting aperture very close but not touching the edge of the film. The contrast transfer theory of the HDC-TEM was extensively developed elsewhere7. The main characteristic is the asymmetric contrast transfer function (Fig. 1f). The modulus of the HDC-TEM pCTF is the same as the ZPC-TEM pCTF. So the information transfer in the ideal case should be identical between the two techniques. However the image representation in the case of HDC-TEM has a topographic character due to the unidirectional asymmetry of the pCTF.
Practically there are differences in the information transfer between the HDC and ZPC TEMs. These are due to differences in the geometry of the phase plates and their positioning at the back focal plane. The low frequency cutoff for HDC-TEM is determined by the distance between the central beam and the phase plate edge. It can be arbitrarily adjusted limited only by the size or shape of the central diffraction spot. If there is moderate specimen charging the central spot is deformed and/or deflected prohibiting positioning too close to the phase plate edge.
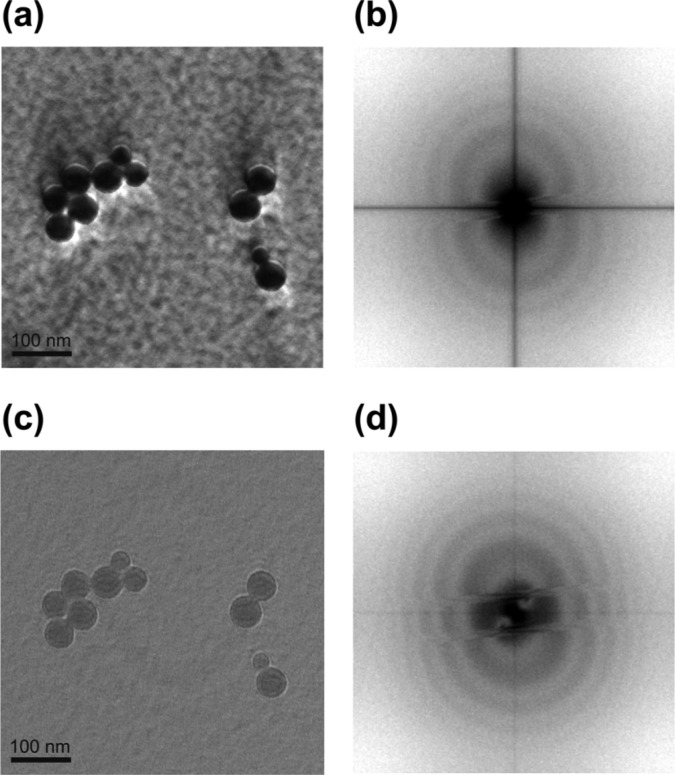
The low cutoff frequency in the case of HDC-TEM is not uniform in all directions. It is lowest in direction perpendicular to the edge. In parallel to the edge direction there is a stripe in the Fourier space exhibiting conventional TEM phase contrast transfer. The width of this stripe is determined by the central beam to edge distance. Fig. 5 demonstrates the effect of this distance on the appearance of the image and the Fourier space. When the beam is close to the phase plate edge (Figs. 5a, b) the image exhibits a strong topographic contrast. This is due to the realization of phase contrast for low and very low spatial frequencies. Larger details are characteristic of biological samples on the medium and large scale such as organelles, bacteria, cells, etc. Moving the beam further from the edge results in vast reduction of the overall contrast in the image (Figs. 5c, d). Only a slight hint of topographic contrast remains. In practice working as close as possible to the edge is most desirable. This produces images with the highest contrast and most low frequency information. The pCTF envelope of HDC-TEM is identical to that of ZPC-TEM so the optimal focus condition is also similar. Working close to focus or with slight underfocus is most desirable.
Figure 5.
Images of polystyrene latex particles demonstrating the effect of the central diffraction beam to HDC-TEM phase plate edge distance on the image and Fourier space. (a) central beam positioned close to the phase plate edge. (c) central beam moved some distance from the edge. (b) and (d) modulus of the Fourier transforms of (a) and (c) respectively.
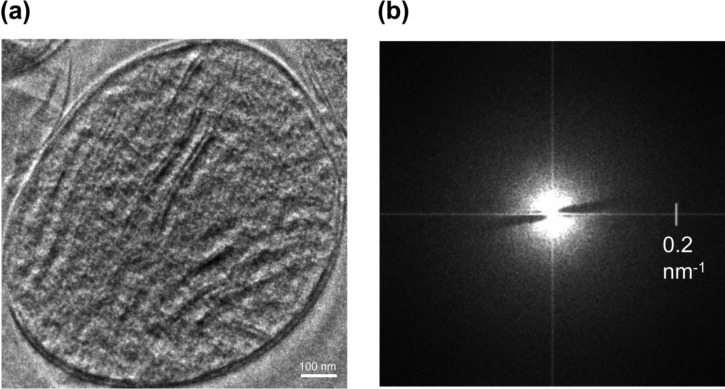
Figs. 6a, b show a practical example of HDC-TEM application. The specimen is ice-embedded mitochondrion. The topographic representation makes it easy to recognize details in the ultra structure of the subject. The direct interpretation of the data is easy due to the topographic representation and absence of defocus modulation. It must be noted that the appearance of the image do not necessarily correspond to the surface features of the sample. The relief appearance corresponds to the phase information. In the case of ice-embedded biological samples this is the density variations inside the volume.
Figure 6.
Example of a HDC-TEM application. (a) HDC-TEM image of ice-embedded mitochondrion, defocus 1.6 μm (Matsumoto, K., Fujita, Y., Yoneda, M., Itoh, M., Tanaka, M., Danev, R. and Nagayama, K., unpublished data). (b) modulus of the Fourier transform of (a).
The stripe of missing phase information in the Fourier space is clearly visible in Fig. 6b. Although the first impression is that this missing information may significantly degrade the image, practically it does not affect the direct interpretation of the data. If there is a periodic structure with diffraction spot failing inside the stripe there will be attenuation of the periodicity. However such cases are very rare considering the area ratio of the stripe to the whole Fourier space.
It was shown in previous reports7 that it is possible to numerically demodulate the HDC-TEM image and remove the topographic appearance. Figs. 7a, b show an example of such demodulation. In the ideal case of central beam infinitely close to the phase plate edge the result will be an image with ideal ZPC-TEM like pCTF modulation. However due to the finite beam to edge distance the demodulated image still has some anisotropic appearance. There are more low frequencies in direction perpendicular to the phase plate edge than in other directions. This is due to the fact that in that direction the phase plate edge is closest to the k-space origin.
Figure 7.
Illustration of HDC-TEM image demodulation. (a) HDC-TEM image of ice-embedded rotaviruses (Taniguchi, K., Danev, R., Usuda, N. and Nagayama, K., unpublished data). (b) numerically demodulated image.
The HDC-TEM like the ZPC-TEM utilizes a material film at the back focal plane. Thus scattering of coherent information-carrying electrons by the material of the phase plate will prevent them from contributing to the image. The film of the HDC-TEM phase plate is twice thicker than that of the ZPC-TEM phase plate. An amorphous carbon film with thickness for π phase shift of 300 kV electrons will scatter about 48% of the incident electrons. Only 52% of the electrons will not be affected. However the HDC-TEM phase plate covers only half of the diffraction space. So in total about 26% of the image forming electrons will be scattered. This performance is similar to the ZPC-TEM which exhibits 28% total scattering.
The pCTF amplitude of HDC-TEM is the same as that of ZPC-TEM. All comments about optimal defocus of ZPC-TEM are also valid for HDC-TEM.
Discussion
The phase contrast techniques listed above each has its advantages and limitations. The conventional TEM is a well established technique. People have been using it for many years and have learned to work around its limitations. The band-pass filter properties are advantageous in cases when low frequency information is not of interest and the observation is aimed at high-resolution data acquisition. Recovery of low frequency information can be achieved through CTF demodulation and energy filtering. Still some applications, like reconstruction of 3D structures of molecules and viruses, require a wider frequency range of information. In such cases the only practical way has been defocus series.
The main advantages of the conventional TEM compared to the phase plate techniques are its ease of use and no information loss. Insertion and alignment of the phase plate is an additional procedure which adds to the experimental complexity of the phase plate techniques.
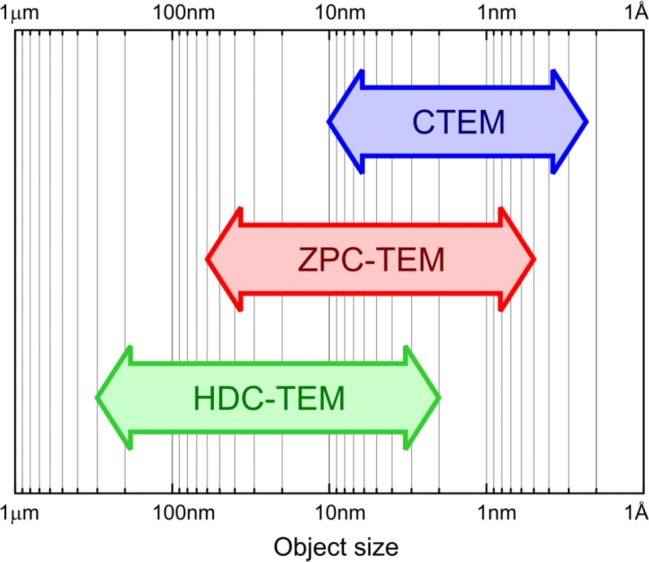
Fig. 8 shows the approximate application ranges of the discussed imaging modes. The conventional TEM (CTEM) has no loss of imaging electrons thus it has a signal-to-noise advantage in the high-frequency region. The resolution of biological sample observations is limited by the preparation technique and/or the electron dose. So for the same electron dose CTEM will produce images with higher resolution. However observation of larger objects in vitreous ice, where the low frequencies are important, can be a challenge for CTEM9,11. In such cases phase plate techniques produce better images.
Figure 8.
Application ranges of various phase contrast techniques in TEM. CTEM = conventional TEM; ZPC-TEM = Zernike phase contrast TEM; HDC-TEM = Hilbert differential contrast TEM.
ZPC-TEM provides wider frequency transfer compared to CTEM. The information spectrum is extended towards the low spatial frequencies. Having the whole needed information in one image can be advantageous as this avoids the need for defocus series. Depending on the size of the phase plate hole, focal length and acceleration voltage, ZPC-TEM phase contrast can transfer details as large as 100 nm.
For large objects such as cells and organelles HDC-TEM is the better choice. By positioning the beam very close to the phase plate edge the phase contrast transfer can be extended to much lower frequencies compared to CTEM and ZPC-TEM. The image data of such observations is usually interpreted directly without further data processing or numerical reconstruction. In this respect the HDC-TEM images resemble images produced by DIC or Nomarski contrast in light microscopy.
In Table 1 are summarized the characteristics and application targets for each phase contrast technique.
Table 1.
Summary of the characteristics and application targets for different phase contrast techniques
| Defocus Phase Contrast TEM DPC-TEM |
|
| Zernike Phase Contrast TEM ZPC-TEM |
|
| Hilbert Differential Contrast TEM HDC-TEM |
|
Conclusion
The conventional TEM is a widely used observation technique in the biological field. Many techniques have been developed for sample preparation and contrast enhancement. However most of these affect the sample structure and introduce artifacts. The trend in recent years is observation of samples in their in vivo state. This usually means observation of vitrified ice embedded samples. Phase contrast is the only way to extract information from such samples. However the maximum electron dose is limited, so improvement of the phase contrast transfer of the microscope is necessary. The recent developments in the application of thin film phase plates to TEM show promising results. As more experiments are done, results produced and experience accumulated the popularity of these new techniques will grow. There is a strong possibility that one day phase plate contrast will be a standard option in the catalogs of the major microscope manufacturers.
References
- 1.Nagayama K. Complex observation in electron microscopy. I. Basic scheme to surpass the Scherzer limit. J. Phys. Soc. Jpn. 1999;68:811–822. [Google Scholar]
- 2.Danev R, Nagayama K. Complex observation in electron microscopy. II. Direct visualization of phases and amplitudes of exit wave functions. J. Phys. Soc. Jpn. 2001;70:696–702. [Google Scholar]
- 3.Danev R, Nagayama K. Transmission electron microscopy with Zernike phase plate. Ultramicroscopy. 2001;88:243–252. doi: 10.1016/s0304-3991(01)00088-2. [DOI] [PubMed] [Google Scholar]
- 4.Sugitani S, Nagayama K. Complex observation in electron microscopy: III. Inverse theory of observation-scheme dependent information transfer. J. Phys. Soc. Jpn. 2002;71:744–756. [Google Scholar]
- 5.Danev R, Okawara H, Usuda N, Kametani K, Nagayama K. A novel phase-contrast transmission electron microscopy producing high-contrast topographic images of weak objects. J. Biol. Phys. 2002;28:627–635. doi: 10.1023/A:1021234621466. [DOI] [PMC free article] [PubMed] [Google Scholar]
- 6.Nagayama K, Danev R. Image enhancement with phase plates in electron-phase microscopy. Microsc. and Anal. 2003;17(4):17–19. [Google Scholar]
- 7.Danev R, Nagayama K. Complex observation in electron microscopy: IV. Reconstruction of complex object wave from conventional and half plane phase plate image pair. J. Phys. Soc. Jpn. 2004;73:2718–2724. [Google Scholar]
- 8.Lentzen M. The tuning of a Zernike phase plate with defocus and variable spherical aberration and its use in HRTEM imaging. Ultramicroscopy. 2004;99:211–220. doi: 10.1016/j.ultramic.2003.12.007. [DOI] [PubMed] [Google Scholar]
- 9.Kaneko Y, Danev R, Nitta K, Nagayama K. In vivo subcellular ultrastructures recognized with Hilbert differential contrast transmission electron microscopy. J. Electron Microsc. 2005;54(1):79–84. doi: 10.1093/jmicro/dfh105. [DOI] [PubMed] [Google Scholar]
- 10.Hosokawa F, Danev R, Arai Y, Nagayama K. Transfer doublet and an elaborated phase plate holder for 120 kV electron-phase microscope. J. Electron Microsc. 2005;54(4):317–324. doi: 10.1093/jmicro/dfi049. [DOI] [PubMed] [Google Scholar]
- 11.Kaneko Y, Danev R, Nagayama K, Nakamoto H. Intact carboxysomes in a cyanobacterial cell visualized by Hilbert differential contrast transmission electron microscopy. J. Bacteriol. 2006;188:805–808. doi: 10.1128/JB.188.2.805-808.2006. [DOI] [PMC free article] [PubMed] [Google Scholar]
- 12.Tosaka M, Tsuji M, Ogawa T, Kitano H, Nakano K, Kohjiya S, Danev R, Nagayama K. Self-assembly of nano-sized arrays on highly oriented thin films of poly(tetra-fluoroethylene) Polymer. 2006;47(4):951–955. [Google Scholar]
- 13.Kanaya K, Kawakatsu H, Ito K, Yotsumoto H. Experiment on the electron phase microscope. J. Appl. Phys. 1958;29:1046–1049. [Google Scholar]
- 14.Badde H, Reimer L. Der einfluss einer streuenden phasen-platte auf das elektronenmikroskopische bild. Z. Naturforsch. 1970;25a:760–765. [Google Scholar]
- 15.Parsons D, Johnson H. Possibility of a phase contrast electron microscope. Appl. Optics. 1972;11:2840–2843. doi: 10.1364/AO.11.002840. [DOI] [PubMed] [Google Scholar]
- 16.Johnson H, Parsons D. Enhanced contrast in electron microscopy of unstained biological material. J. Microsc. 1973;98:1–17. doi: 10.1111/j.1365-2818.1973.tb03799.x. [DOI] [PubMed] [Google Scholar]
- 17.Willasch D. High resolution electron microscopy with profiled phase plates. Optik. 1975;44:17–36. [Google Scholar]


