Abstract
Objective
Abdominal aortic aneurysm (AAA) wall stiffness has been suggested to be an important factor in the overall rupture risk assessment compared to anatomical measure; we hypothesize that AAA diameter will have no correlation to AAA wall stiffness. The aim of this study is to 1) determine MRE-derived aortic wall stiffness in AAA patients and its correlation to AAA diameter; 2) determine correlation between AAA stiffness and amount of thrombus and calcium; and 3) compare the AAA stiffness measurements against age matched healthy subjects.
Methods
In-vivo abdominal aortic MRE was performed on 36 subjects (24 patients with AAA measuring 3-10 cm and 12 healthy volunteers) aged 36-78 years old after obtaining written informed consent under the approval of the institutional review board. MRE images were processed to obtain spatial stiffness maps of the aorta. AAA diameter, amount of thrombus and calcium score were reported by experienced interventional radiologists. Spearman correlation, Wilcoxon signed rank test and Mann-Whitney test were performed to determine the correlation between AAA stiffness and diameter, and also to determine significant difference in stiffness measurements between AAA patients and healthy subjects.
Results
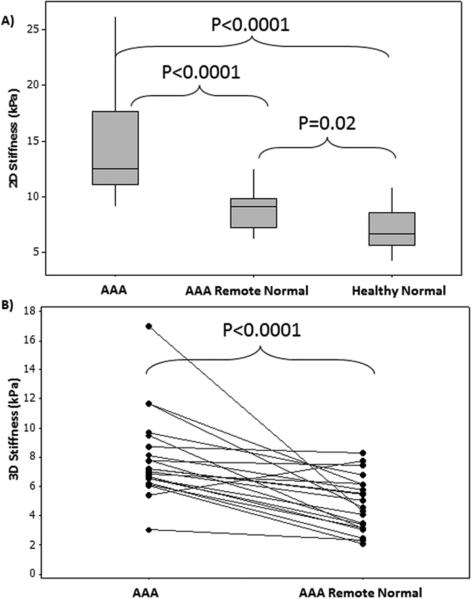
No significant correlation (P>.1) was found between AAA stiffness and diameter or amount of thrombus or calcium score. AAA stiffness (mean:13.97±4.2kPa) is significantly (P≤.02) higher than remote normal aorta in AAA (mean:8.87±2.2kPa) patients and in normal subjects (mean:7.1±1.9kPa).
Conclusion
Our results suggest that AAA wall stiffness may provide additional information independent of AAA diameter, which may contribute to our understanding of AAA pathophysiology, biomechanics, and risk for rupture.
Introduction
An abdominal aortic aneurysm (AAA) is a focal abnormal dilatation of the abdominal aorta located between the diaphragmatic hiatus and the iliac artery bifurcation. The prevalence of AAA increases with age and is three times more prevalent in men than women; approximately 8% of men over the age of 65 have an AAA 1.
AAAs enlarge over time with 50-90% of patients with ruptured aneurysms leading to death 2. In the US, an estimated 15,000-30,000 individuals die each year due to AAA rupture and AAA rupture is the 15th leading cause of death in this country 3. Thus, there is need for a greater understanding the pathophysiology of AAA progression and better methods for identifying patients at risk for rupture.
The pathogenesis of an AAA is multifactorial 4. There is also great variation in the rate of enlargement of AAA 5. A triphasic evolution of aneurysm size has been proposed: a quiescent phase, a critical phase, and an expansive phase. During the third phase, the growth rate is higher 5, with the risk of rupture increasing with AAA diameter. Brewster et al. 6 estimated that AAAs with diameters 4-5 cm have a rupture risk of 0.5-5%/year; 5-6 cm a risk of 3-15%/year; 6-7 cm a risk of 10-20%/year; 7-8 cm a risk of 20-40%/year; and greater than 8 cm a risk of 30-50%/year. Currently, the gold standard for assessing the risk for rupture is AAA diameter. Surgical or endovascular aneurysm repair (EVAR) is recommended when AAA diameter exceeds 5.5 cm.
At the same time, some studies have reported that 2-10% of smaller AAAs (< 5.5 cm) progress to rupture 7, 8, while many larger AAAs (>5.5 cm) remain stable, thereby suggesting that AAA size may not be the only predictor of AAA rupture. From a clinical standpoint, it is of importance to understand which smaller (<5.5 cm) aneurysms grow or do not grow and progress to rupture. The reasons for some smaller aneurysms progressing to rupture while some larger AAAs remaining stable is not understood. A likely explanation is the variance of biomechanical factors in the aneurysm wall of AAA patients. It is known that changes in stiffness of AAA tissue can reveal important information about the tissue microstructure and extra-cellular matrix (ECM) content, both of which significantly contribute to the pathophysiological development of AAA 2, 9; and AAA wall stiffness has been suggested to be an important factor in the overall rupture risk assessment compared to anatomical measure. Therefore, there is a need for understanding the pathophysiology of AAA and rupture risk assessment based on stiffness estimates, independent of AAA diameter.
To date, aortic stiffness has been measured with ultrasound-based methods, such as pulse-wave velocity (PWV) 10, pulse-wave imaging (PWI) 11, or magnetic resonance imaging (MRI)-based PWV 12. However, these methods provide only an indirect estimation of aortic wall stiffness based on pulse velocity and also have other technical limitations 13; and cannot spatially resolve wall stiffness, an important factor in understanding AAA progression 14. Another approach was utilized by Tierney et al. where Acoustic Radiation Force Impulse imaging was extended from ex-vivo 15 to in-vivo estimation of AAA wall stiffness 16 in a single patient, albeit with several limitations. Because of these cumulative restrictions, indirect measurements of global aortic stiffness have not been widely adopted.
Magnetic resonance elastography (MRE) is a novel non-invasive MRI-based technique to determine the stiffness of various soft tissues both superficial and deep within the body by examining the propagation of shear waves 17-19. Currently, MRE is a clinical tool to stage liver fibrosis and has been validated against liver biopsy 20. MRE has also been used to detect liver tumors 21, brain tumors 22, and Alzhemiers 23. MRE has recently been successfully applied invivo to measure the stiffness of the human aorta 24-27 and also in animals, which are validated against ex-vivo mechanical testing 28, histopathology 29 and PWV 24, 27. Additionally, it was also shown that aortic MRE was reproducible in normal healthy volunteers 27.
The aim of this study is to assess the relationships between MRE-derived spatial aortic wall stiffness (along the length of the aorta) in AAA and several related parameters as follows: 1) AAA stiffness correlation to AAA diameter, hypothesizing that the two will not correlate; 2) correlation of ratio of AAA stiffness to remote normal caliber aorta within the same patient to ratio of aortic diameter; 3) AAA stiffness correlation to amount of adherent mural thrombus and calcium; 4) AAA stiffness measurements correlation to aortic stiffness in age-matched healthy subjects; and 5) AAA stiffness correlation to mean arterial pressure (MAP).
Methods
Abdominal aortic MRE was performed on 36 subjects (24 patients with AAA measuring 3-10 cm and 12 healthy volunteers) aged 36-78 years old after obtaining written informed consent under the approval of the institutional review board. The inclusion criteria for this study were a) age ≥ 35 years, b) patients/volunteers deemed suitable to undergo an MRE based upon clinical history and pre-procedural imaging findings. Exclusion criteria included: a) contraindication to receive an MRI, b) prior history of AAA surgical or EVAR in AAA patients, b) history of hypertension in normal subjects due to increase in aortic wall stiffness 25, and c) history of vasculitis or aortic vascular injury.
Experimental Setup
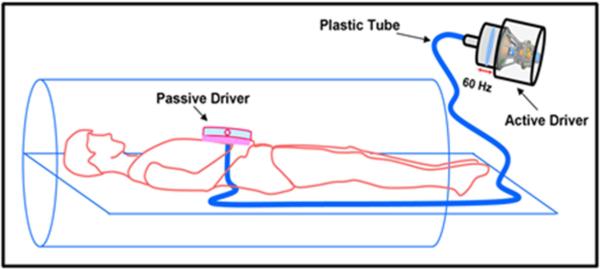
All imaging was performed on a Siemens 3T MRI scanner (Tim Trio, Siemens Healthcare, Germany). Before and after scanning, blood pressure (BP) of the subjects was recorded to obtain MAP. Subjects were positioned supine and head first in the scanner. A pneumatic driver system was used to induce 60 Hz mechanical waves into the abdomen; the active driver was located outside of the scanning room and was connected via tubing to the passive driver, which was strapped to the abdomen just below the xiphoid process of the sternum. The experimental setup is detailed in Figure 1.
Figure 1.
Schematic of MRE driver setup. Passive driver is placed on the abdomen. Sound waves are non-invasively transmitted to the passive driver via active driver through a plastic tube into the subject's abdomen.
Image Acquisition
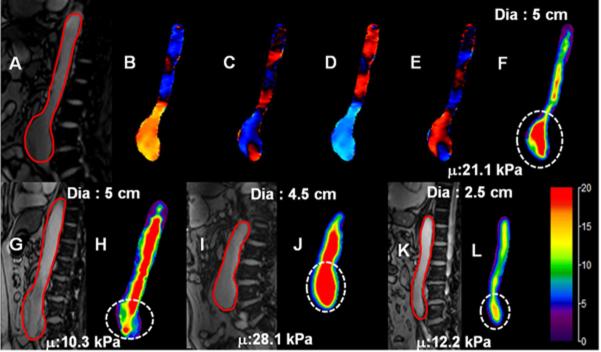
A gradient echo-MRE sequence was used to image all subjects 24 to acquire wave data in oblique sagittal or coronal slices of the abdominal aorta depending on the location of AAA. The imaging parameters included: TE/TR 21.3/25 ms, matrix = 128x64, FOV = 36-40 cm2, α = 16°, # of slices: 3-4, slice thickness = 5-6mm and a first order gradient-moment-nulled motion encoding gradient of 60 Hz was applied separately in the x, y, and z directions to encode the motion in a 9 sec breathhold for each slice. Four MRE time offsets were collected to obtain the propagating waves in the aorta, as demonstrated in Figure 2. The total scan time taken for MRE scans is 81-108 sec depending on the number of slices acquired.
Figure 2.
(A): Sagittal magnitude image with contour (red) outlining aorta in one of the subjects. (B-E): Snapshot of wave propagation at four points in time. (F): Weighted stiffness map from x, y, and z encoding directions with a mean stiffness value of 21.1±4.2 kPa at the area of aneurysm (dashed white circle). (G-I): Sagittal magnitude images and their corresponding stiffness maps for three subjects with aneurysm diameters of 5 cm, 4.5 cm, and 3 cm and mean stiffness values of 10.3 kPa, 28.1 kPa, and 12.2 kPa, respectively. It can be observed that in subjects with same AAA diameters the stiffness values are different.
Image Analysis
The sagittal/coronal images were masked to delineate the abdominal aorta as shown in Figure 2. The MRE wave images were processed with MRE-lab (Mayo Clinic Rochester, MN) to obtain both 2D and 3D stiffness maps 24, 27 (please refer to the appendix for details).24, 27. In AAA patients, regions of interest (ROI) were drawn encompassing the entire AAA as well as remote normal aorta to report the mean shear stiffness (‘stiffness’) as well as standard deviation (SD). In AAA patients demonstrating adherent mural thrombus, the amount of thrombus was quantified by determining the % cross-sectional luminal area accounted by clot at the maximum AAA diameter (i.e. percentage ratio of area of thrombus to area of AAA) on CT or MRI data by an experienced interventional radiologist (JDD) who was blinded to MRE measurements. The relative time between MRE and CT measurements was within 0-5 months except for two subjects which were 7 months and 10 months apart. However, any CT or MRI based thrombus measurements obtained with a time difference ≥12months (i.e. only 2 subjects) was not included in the study. Similarly, calcium scoring was performed by a cardiovascular radiologist (RDW, who was blinded to MRE measurements) on the existing CT data (obtained for clinical evaluation) using an Agatston 30 method although modified to accept variable kVp and slice thickness with adjustment of threshold from standard 130 HU in order to compensate for blood enhancement from contrast. In normal subjects, entire abdominal aorta is considered as a region of interest in reporting the stiffness values.
Statistical Analysis
Data analyses were conducted by using SAS 9.4 (SAS, Inc; Cary, NC). The correlations between stiffness and diameters, amount of thrombus, pressure and calcium score were evaluated by Spearman rank correlation method with P<.05 being significant. The difference in 2D or 3D stiffness between AAA and remote normal within the same patient was tested by Wilcoxon signed rank test with P<.05 being significant. The differences in 2D stiffness measurements among AAA patients, normal remote caliber aorta in AAA patients and aorta in healthy volunteers were tested by Mann-Whitney test with P<.05 being significant.
Results
Shear stiffness of the normal aorta and AAA regions varied both within and between volunteers. Figure 2 shows sagittal magnitude images and the resultant stiffness maps for four patients with varying AAA diameters. The average AAA stiffness values (delineated by circular dashed line) are 21.1 kPa (diameter = 5 cm), 10.3 kPa (diameter = 5 cm), 28.1 kPa (diameter = 4.5 cm), and 12.2 kPa (diameter = 3 cm), respectively.
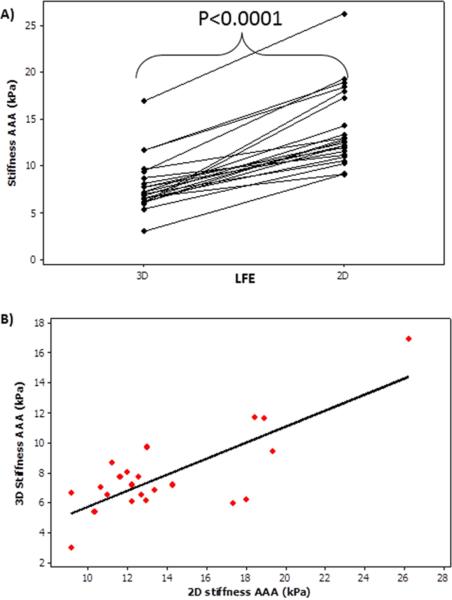
Both 2D and 3D stiffness of the AAA were estimated in 22 of the 36 age matched subjects (10 AAA, 12 normal) and it was determined that 2D stiffness measurements were significantly higher (P<.0001) than 3D stiffness measurements as shown in Figure 3a. Figure 3b shows a spearman correlation coefficient of 0.48 with a significant p-value of 0.02.
Figure 3.
A) Shows that 2D AAA stiffness measurements are significantly (p-value<0.0001) higher than 3D AAA stiffness measurements. B) Shows the plot of 3D AAA stiffness vs 2D AAA stiffness with a spearman correlation coefficient of 0.48 with a significant p-value of 0.02.
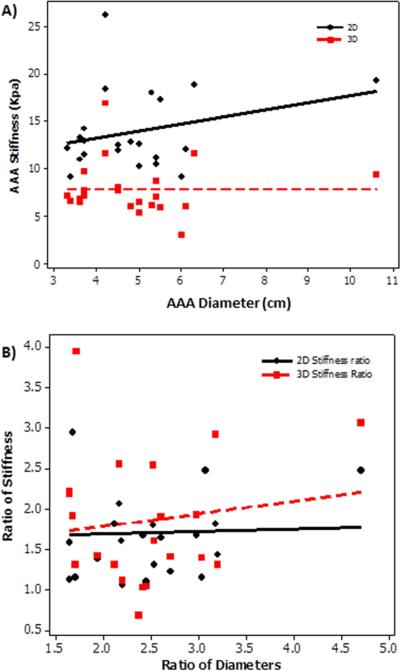
Stiffness of the aneurysm did not correlate with AAA diameter. Figure 4a shows no significant correlation (P>.4) between AAA diameter and AAA stiffness with a spearman correlation coefficient of −0.18 (3D) and 0.16 (2D). In addition, no significant correlation (P>.6) was found between ratio of stiffness measurements and diameter in AAA region to that of remote normal caliber aorta in AAA patients as shown in Figure 4b.
Figure 4.
A) Plot of AAA stiffness (2D, 3D) as a function of AAA diameter showing no significant spearman correlation coefficient of 0.16(2D) and −0.18(3D) with a p-value>0.4. B) Plot of ratio of stiffness as a function of ratio of diameter in AAA region to that of remote normal caliber aorta with in the same patient. No significant spearman correlation coefficient 0.1 (2D) and 0.03 (3D) was found with a p-value >0.6.
Higher aortic stiffness measurements characterized the AAA patients when compared to healthy volunteers. Figure 5 compares the three groups in terms of stiffness values, demonstrating higher stiffness in patients with AAA compared to healthy volunteers as well as remote normal aorta in AAA patients with significant p-value ≤0.02.
Figure 5.
A) Box plot showing significant difference between three stiffness groups (2D) i.e. AAA, AAA remote normal and healthy normal aortas. B) Shows significant difference (p-value<0.0001) in 3D stiffness measurements between AAA region and remote normal aorta in AAA patients.
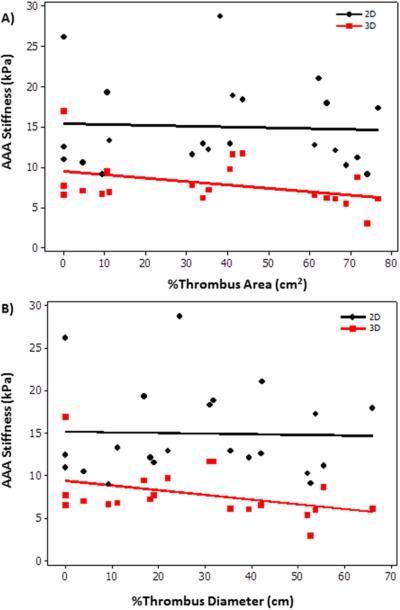
AAA stiffness also failed to correlate with amount of thrombus. Figure 6 shows non-significant (P>.06) weak (2D) to moderate (3D) correlation between %area of thrombus to that of AAA stiffness.
Figure 6.
A) Plot of AAA stiffness as a function of %thrombus area showing no significant correlation −0.01 (2D) and −0.39 (3D) with a p-value >0.07. B) Plot of AAA stiffness as a function of % thrombus diameter showing no significant correlation −0.007 (2D) and −0.42 (3D) with a p-value >0.05.
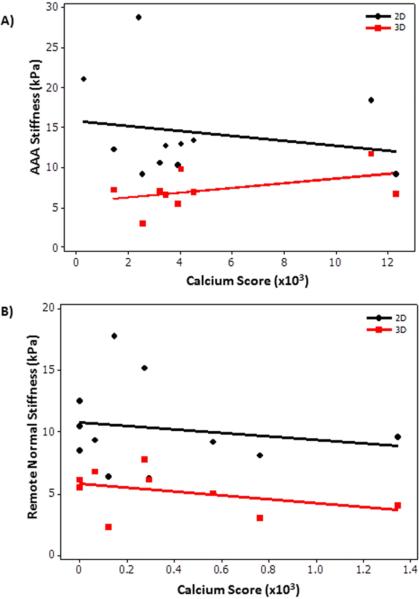
No correlation was determined between calcium score and stiffness of AAA region and remote normal region. Figure 7A shows no significant correlation (P>.43) between calcium score and AAA stiffness with a spearman correlation coefficient of −0.26 (2D) and 0.25 (3D). Similarly, Figure 7B shows no significant correlation (P>.2) between calcium score and remote caliber normal aorta stiffness in AAA patients with a spearman correlation coefficient of −0.22 (2D) and −0.45 (3D).
Figure 7.
A) Plot of AAA stiffness as a function of calcium score in the AAA region showing no significant correlation −0.26 (2D) and 0.25 (3D) with a p-value >0.43. B) Plot of remote normal caliber aorta stiffness in AAA patients as a function of calcium score in the remote region showing no significant correlation −0.22 (2D) and −0.45 (3D) with a p-value >0.2.
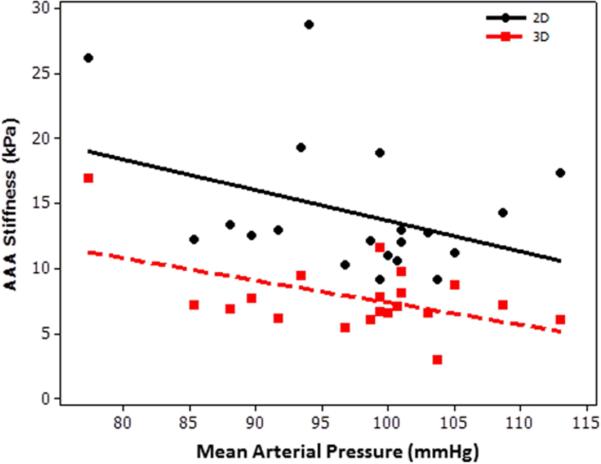
A weak non-significant correlation was found between AAA stiffness and blood pressure. Inverse correlation with a spearman correlation coefficient ≤ 0.26 was found between AAA stiffness and MAP (Figure 8).
Figure 8.
Plot of AAA stiffness (2D, 3D) as a function of mean arterial pressure showing no significant spearman correlation coefficient of −0.26(2D) and −0.21(3D) with a p-value>0.2.
Discussion
This study demonstrated that: 1) MRE can be used to estimate spatial stiffness of the aorta in AAA patients; 2) there is no correlation between AAA stiffness and AAA diameter, and none was expected; 3) there is non-significant moderate inverse correlation between amount of thrombus and AAA stiffness (3D); 4) there is no significant correlation between AAA stiffness and calcium score; 4) AAA stiffness is significantly higher than remote normal caliber aorta and as well as normal aorta in healthy subjects; and 5) there is non-significant inverse correlation of AAA stiffness to MAP.
The development and progression of AAA has long been understood as a complex balance of elastin and collagen; pliant elastin is lost, forcing more pressure and load onto the stiffer collagen, which is eventually overcome by the force of BP leading to rupture 31. Ex-vivo testing has confirmed the degradation of elastin and an increase in collagen in AAA has thus led to increase in stiffness 32. This finding is consistent with our work that AAA stiffness is significantly higher than normal aortic stiffness in healthy individuals as well as remote normal caliber aorta in AAA patients.
Interestingly, though our results demonstrated overall higher stiffness in AAA when compared to normal caliber aorta, there was some overlap between AAA patient stiffness and age-matched healthy volunteers’ aortic infrarenal stiffness. There was also a noticeable variation in AAA stiffness compared to diameter (i.e. similar-sized aneurysms with very different stiffness values or different-sized aneurysms with comparable stiffness values). These two observations suggest both that diameter is not an efficient method of classifying aneurysms per individual, and also that stiffness can provide information in addition to and furthermore separate from AAA diameter when assessing rupture risk. We hypothesize that as AAA tissue becomes stiffer (following loss of elastin), it eventually reaches a compositional threshold, after which the collagen components also begin to degrade and the tissue becomes locally more elastic until the stress on the aortic wall is exceeded by the strength of the tissue eventually leading to rupture. This theory has been previously suggested 2, 5, 9 and is supported by evidence that ruptured AAAs have demonstrated lower stiffness values 2.
In order to assess the risk for rupture in AAAs, first, the normal stiffness values across age should be established. Then, a large sample size with sequential follow up for every 6 months until 3 to 4 years to understand the rate of growth and its correlation to stiffness is required. Finally, by using all the data from normals and AAAs across time in a statistical model, a critical limit for rupture based on stiffness estimates can be potentially determined. With an established threshold of stiffness, we might be able to determine the risk for rupture of AAAs during routine follow up if the stiffness starts to decrease or even at the first visit. Therefore, quantitating AAA wall stiffness serially in a patient may provide better understanding of its risk for rupture. Additionally, AAA stiffness provides additional quantitative characterization of AAA patients beyond that of diameter alone.
It is known that the role of thrombus with respect to aneurysmal rupture has been controversial. A few studies have previously shown that significant thrombus burden reduces the risk for rupture 33. However, clinical observation had indicated that increasing amount of thrombus was associated with a greater risk for rupture 33. Schurink GWH et al. 33 showed that pressure in the AAA with thrombus is linearly correlated to pressure in the radial artery indicating that thrombus does not reduce the pressure in the AAA wall and thus will not reduce the risk for rupture. Additionally, it has been shown that the biochemical process of AAA may influence the structural rigidity of an aneurysmal wall, but it has to be further investigated 34. In our study we have shown that aneurysmal thrombus burden is not correlated to AAA stiffness indicating that AAA stiffness is independent of amount of thrombus; and thrombus may not be used in assessing the risk for rupture of AAAs.
This study demonstrated no significant correlation between MRE-derived AAA stiffness and calcium score. In a study by Abbas et al. 35 demonstrated that there is no significant correlation between AAA stiffness measured using pulse wave velocity and calcium score. Additionally, Gaszner et al. 36 also demonstrated no significant correlation between stiffness and calcium score in patients with coronary artery disease. Furthermore, Heilmaier et al. 37 demonstrated that there is no significant difference in calcium scores between patients with and without AAA. However, it was also shown that there was increased degree of calcium in symptomatic or ruptured AAA patients 38. Therefore, these studies indicate that calcium disposition and stiffness are independent risk factors in determining the AAA risk for rupture.
Many studies have shown that aortic stiffness increases with pressure 25, 26. An earlier study in normal volunteers showed moderate linear correlation of stiffness to BP 27. In our study, we found a moderate negative correlation of AAA stiffness to MAP. It is known that the arterial pressure measured using a brachial pressure cuff may not represent true central aortic pressure and is one of the reasons for moderate correlation to stiffness observed in our study. Therefore, we believe that arterial pressure may not provide complete understanding of stress experienced by the AAA.
MRE-derived aortic stiffness used in this study is based on the waveguide principle which was previously validated 24, 25, 27, 29. This principle justifiably allows estimating aortic stiffness by considering waves propagating in the lumen along with the aortic wall. The stiffness reported in this study is based on the wave speed propagating in the medium at the given vibrating frequency. This is the first study to date that can non-invasively estimate in-vivo spatial stiffness (along the length of the aorta) of AAA using MRE. The stiffness measurements in normal volunteers reported in this study are comparable to those reported in earlier studies 24-27.
The wave propagation in the aorta is not planar and is oblique which is associated with waveguide effect based on the geometry of the aorta. Therefore, the oblique wave propagation in the aorta causes 2D inversion to overestimate the wavelength thereby causing stiffness values to be considerably higher than 3D stiffness measurements, which was also demonstrated earlier in estimating liver 39 and myocardial stiffness 19. This was also confirmed in this current study.
No adverse effects or discomfort were reported by the subjects (i.e. even in a subject >10cm AAA) due to the pressure generated by the pneumatic driver, even at maximum driver pressures beyond necessary for the study. The driver used in this study is FDA approved for staging liver fibrosis and the vibrations generated using this driver are below the limits set by the European Union 40.
There are some limitations in this study. MRE-derived stiffness measurements are not absolute as they are derived based on the wave speed of the propagating wave. We did not account for the variation in arterial stiffness throughout the cardiac cycle, but rather, reported stiffness at a point of the cardiac cycle. It would be useful to measure stiffness during the diastolic and systolic phase of the cardiac cycle using a cardiac gated MRE sequence to determine the influence of aortic pressure on stiffness estimates. Stiffness within AAAs vary spatially, but in this study the entire AAA has been considered as one ROI to report the mean stiffness. Also, we did not account for asymmetry of the aneurysms. The above limitations will be addressed in our future studies. Due to the lack of a standard calcium scoring procedure in the aorta, the coronary calcium scoring procedure was adopted to report the amount of calcium. Additionally, no significant correlation between AAA stiffness and calcium score was observed and may be attributed to small cohort (i.e. n=11) who had clinical CT data available for calcium scoring without stent. To achieve a Spearman correlation of 0.4 (i.e. between stiffness and other parameters) with 85% power a total of 37 patients are required; and currently, we have 65% power to detect a correlation of 0.4. Due to the small cohort, this study has not accounted for gender differences or other demographic factors beyond hypertension. Despite the small sample size and the aforementioned limitations, the AAA stiffness measurements are significantly higher than normal aorta stiffness measurements.
In conclusion, our initial observations suggest no correlation between AAA wall stiffness and diameter. Furthermore, our results suggest that AAA wall stiffness may provide additional information independent of AAA diameter, which may contribute to our understanding of AAA pathophysiology, biomechanics, and risk for rupture. Indeed, the findings described here may explain why some small AAAs (i.e. <5 cm) still rupture or why other larger AAAs remain stable. More longitudinal studies are further warranted in order to determine a AAA stiffness threshold to determine the risk for rupture. If the critical threshold of AAA stiffness (at which point the risk of rupture increases substantially) is elucidated, the use of MRE can potentially lead to personalized aneurysm care by using each individual patient's aortic wall stiffness trends to assess the rupture risk in addition to AAA diameter.
Acknowledgement
Authors would like to acknowledge Brian Raterman, BS R.T(R)(MR) and Dr. Xiaokui Mo who have helped in some of the image acquisition and statistical analysis, respectively.
Funding Source: This work was supported by NIH-R01HL124096, SIR Pilot Research Grant Award and Center for Clinical and Translational Sciences # UL1TR000090.
Appendix
MRE Analysis
First, the MRE wave data was processed using a 2D Butterworth bandpass filter with cutoff values of 1-40 waves/FOV and a directional filter with 8 directions to remove the longitudinal and reflected waves, respectively 24. Then the first harmonic displacement field was processed to yield effective 2D and 3D MRE-derived shear stiffness maps of the abdominal aorta using a local-frequency estimation (LFE) inversion algorithm as described previously 24, 27.
Footnotes
Publisher's Disclaimer: This is a PDF file of an unedited manuscript that has been accepted for publication. As a service to our customers we are providing this early version of the manuscript. The manuscript will undergo copyediting, typesetting, and review of the resulting proof before it is published in its final citable form. Please note that during the production process errors may be discovered which could affect the content, and all legal disclaimers that apply to the journal pertain.
Conflicts of Interest: Arunark Kolipaka received honorarium from GE for a presentation. All other authors have no conflict of interest.
References
- 1.Singh K, Bonaa KH, Jacobsen BK, Bjork L, Solberg S. Prevalence of and risk factors for abdominal aortic aneurysms in a population-based study : The Tromso Study. Am J Epidemiol. 2001;154(3):236–44. doi: 10.1093/aje/154.3.236. [DOI] [PubMed] [Google Scholar]
- 2.Vorp DA, Vande Geest JP. Biomechanical determinants of abdominal aortic aneurysm rupture. Arterioscler Thromb Vasc Biol. 2005;25(8):1558–66. doi: 10.1161/01.ATV.0000174129.77391.55. [DOI] [PubMed] [Google Scholar]
- 3.Kuivaniemi H, Platsoucas CD, Tilson MD., 3rd Aortic aneurysms: an immune disease with a strong genetic component. Circulation. 2008;117(2):242–52. doi: 10.1161/CIRCULATIONAHA.107.690982. [DOI] [PMC free article] [PubMed] [Google Scholar]
- 4.Nordon IM, Hinchliffe RJ, Holt PJ, Loftus IM, Thompson MM. Review of current theories for abdominal aortic aneurysm pathogenesis. Vascular. 2009;17(5):253–63. doi: 10.2310/6670.2009.00046. [DOI] [PubMed] [Google Scholar]
- 5.Brady AR, Thompson SG, Fowkes FG, Greenhalgh RM, Powell JT. Abdominal aortic aneurysm expansion: risk factors and time intervals for surveillance. Circulation. 2004;110(1):16–21. doi: 10.1161/01.CIR.0000133279.07468.9F. [DOI] [PubMed] [Google Scholar]
- 6.Brewster DC, Cronenwett JL, Hallett JW, Jr., Johnston KW, Krupski WC, Matsumura JS. Guidelines for the treatment of abdominal aortic aneurysms. Report of a subcommittee of the Joint Council of the American Association for Vascular Surgery and Society for Vascular Surgery. J Vasc Surg. 2003;37(5):1106–17. doi: 10.1067/mva.2003.363. [DOI] [PubMed] [Google Scholar]
- 7.Nicholls SC, Gardner JB, Meissner MH, Johansen HK. Rupture in small abdominal aortic aneurysms. J Vasc Surg. 1998;28(5):884–8. doi: 10.1016/s0741-5214(98)70065-5. [DOI] [PubMed] [Google Scholar]
- 8.Lederle FA, Wilson SE, Johnson GR, Reinke DB, Littooy FN, Acher CW, et al. Immediate repair compared with surveillance of small abdominal aortic aneurysms. New England Journal of Medicine. 2002;346(19):1437–44. doi: 10.1056/NEJMoa012573. [DOI] [PubMed] [Google Scholar]
- 9.Raghavan ML, Webster MW, Vorp DA. Ex vivo biomechanical behavior of abdominal aortic aneurysm: assessment using a new mathematical model. Ann Biomed Eng. 1996;24(5):573–82. doi: 10.1007/BF02684226. [DOI] [PubMed] [Google Scholar]
- 10.Verbeke F, Van Biesen W, Honkanen E, Wikstrom B, Jensen PB, Krzesinski JM, et al. Prognostic Value of Aortic Stiffness and Calcification for Cardiovascular Events and Mortality in Dialysis Patients: Outcome of the Calcification Outcome in Renal Disease (CORD) Study. Clin J Am Soc Nephrol. 2011;6(1):153–9. doi: 10.2215/CJN.05120610. [DOI] [PMC free article] [PubMed] [Google Scholar]
- 11.Vappou J, Luo J, Konofagou EE. Pulse wave imaging for noninvasive and quantitative measurement of arterial stiffness in vivo. American journal of hypertension. 2010;23(4):393–8. doi: 10.1038/ajh.2009.272. [DOI] [PMC free article] [PubMed] [Google Scholar]
- 12.Fielden SW, Fornwalt BK, Jerosch-Herold M, Eisner RL, Stillman AE, Oshinski JN. A new method for the determination of aortic pulse wave velocity using cross-correlation on 2D PCMR velocity data. J Magn Reson Imaging. 2008;27(6):1382–7. doi: 10.1002/jmri.21387. [DOI] [PubMed] [Google Scholar]
- 13.O'Rourke MF. Wave travel and reflection in the arterial system. J Hypertens Suppl. 1999;17(5):S45–7. [PubMed] [Google Scholar]
- 14.Basu R, Kassiri Z. Extracellular Matrix Remodelling and Abdominal Aortic Aneurysm. J Clin Exp Cardiolog. 2013;4(8):1–8. [Google Scholar]
- 15.Tierney AP, Dumont DM, Callanan A, Trahey GE, McGloughlin TM. Acoustic radiation force impulse imaging on ex vivo abdominal aortic aneurysm model. Ultrasound Med Biol. 2010;36(5):821–32. doi: 10.1016/j.ultrasmedbio.2010.02.018. [DOI] [PubMed] [Google Scholar]
- 16.Tierney AP, Callanan A, McGloughlin TM. In vivo feasibility case study for evaluating abdominal aortic aneurysm tissue properties and rupture potential using acoustic radiation force impulse imaging. J Mech Behav Biomed Mater. 2011;4(3):507–13. doi: 10.1016/j.jmbbm.2010.12.017. [DOI] [PubMed] [Google Scholar]
- 17.Mariappan YK, Glaser KJ, Ehman RL. Magnetic resonance elastography: a review. Clin Anat. 2010;23(5):497–511. doi: 10.1002/ca.21006. [DOI] [PMC free article] [PubMed] [Google Scholar]
- 18.Kolipaka A, Aggarwal SR, McGee KP, Anavekar N, Manduca A, Ehman RL, et al. Magnetic resonance elastography as a method to estimate myocardial contractility. J Magn Reson Imaging. 2012;36(1):120–7. doi: 10.1002/jmri.23616. [DOI] [PMC free article] [PubMed] [Google Scholar]
- 19.Wassenaar PA, Eleswarpu CN, Schroeder SA, Mo X, Raterman BD, White RD, et al. Measuring age-dependent myocardial stiffness across the cardiac cycle using MR elastography: A reproducibility study. Magn Reson Med. 2015 doi: 10.1002/mrm.25760. [DOI] [PMC free article] [PubMed] [Google Scholar]
- 20.Yin M, Talwalkar JA, Glaser KJ, Manduca A, Grimm RC, Rossman PJ, et al. Assessment of hepatic fibrosis with magnetic resonance elastography. Clinical Gastroenterology and Hepatology. 2007;5(10):1207–13. doi: 10.1016/j.cgh.2007.06.012. [DOI] [PMC free article] [PubMed] [Google Scholar]
- 21.Venkatesh SK, Yin M, Glockner JF, Takahashi N, Araoz PA, Talwalkar JA, et al. MR elastography of liver tumors: preliminary results. Ajr. 2008;190(6):1534–40. doi: 10.2214/AJR.07.3123. [DOI] [PMC free article] [PubMed] [Google Scholar]
- 22.Hughes JD, Fattahi N, Van Gompel J, Arani A, Meyer F, Lanzino G, et al. Higher-Resolution Magnetic Resonance Elastography in Meningiomas to Determine Intratumoral Consistency. Neurosurgery. 2015;77(4):653–8. doi: 10.1227/NEU.0000000000000892. [DOI] [PMC free article] [PubMed] [Google Scholar]
- 23.Murphy MC, Jones DT, Jack CR, Jr., Glaser KJ, Senjem ML, Manduca A, et al. Regional brain stiffness changes across the Alzheimer's disease spectrum. Neuroimage Clin. 2016;10:283–90. doi: 10.1016/j.nicl.2015.12.007. [DOI] [PMC free article] [PubMed] [Google Scholar]
- 24.Damughatla AR, Raterman B, Sharkey-Toppen T, Jin N, Simonetti OP, White RD, et al. Quantification of Aortic Stiffness Using MR Elastography and its Comparison to MRI-Based Pulse Wave Velocity. J Magn Reson Imaging. 2015;41(1):44–51. doi: 10.1002/jmri.24506. [DOI] [PMC free article] [PubMed] [Google Scholar]
- 25.Kolipaka A, Woodrum D, Araoz PA, Ehman RL. MR elastography of the in vivo abdominal aorta: a feasibility study for comparing aortic stiffness between hypertensives and normotensives. J Magn Reson Imaging. 2012;35(3):582–6. doi: 10.1002/jmri.22866. [DOI] [PMC free article] [PubMed] [Google Scholar]
- 26.Xu L, Chen J, Glaser KJ, Yin M, Rossman PJ, Ehman RL. MR elastography of the human abdominal aorta: A preliminary study. J Magn Reson Imaging. 2013;38(6):1549–53. doi: 10.1002/jmri.24056. [DOI] [PMC free article] [PubMed] [Google Scholar]
- 27.Kenyhercz WE, Raterman B, Illapani VS, Dowell J, Mo X, White RD, et al. Quantification of aortic stiffness using magnetic resonance elastography: Measurement reproducibility, pulse wave velocity comparison, changes over cardiac cycle, and relationship with age. Magn Reson Med. 2015 doi: 10.1002/mrm.25719. [DOI] [PMC free article] [PubMed] [Google Scholar]
- 28.Xu L, Chen J, Yin M, Glaser KJ, Chen Q, Woodrum DA, et al. Assessment of stiffness changes in the ex vivo porcine aortic wall using magnetic resonance elastography. Magn Reson Imaging. 2012;30(1):122–7. doi: 10.1016/j.mri.2011.09.009. [DOI] [PMC free article] [PubMed] [Google Scholar]
- 29.Woodrum DA, Herrmann J, Lerman A, Romano AJ, Lerman LO, Ehman RL. Phase-contrast MRI-based elastography technique detects early hypertensive changes in ex vivo porcine aortic wall. J Magn Reson Imaging. 2009;29(3):583–7. doi: 10.1002/jmri.21702. [DOI] [PMC free article] [PubMed] [Google Scholar]
- 30.Agatston AS, Janowitz WR, Hildner FJ, Zusmer NR, Viamonte M, Jr., Detrano R. Quantification of coronary artery calcium using ultrafast computed tomography. J Am Coll Cardiol. 1990;15(4):827–32. doi: 10.1016/0735-1097(90)90282-t. [DOI] [PubMed] [Google Scholar]
- 31.Carmo M, Colombo L, Bruno A, Corsi FR, Roncoroni L, Cuttin MS, et al. Alteration of elastin, collagen and their cross-links in abdominal aortic aneurysms. Eur J Vasc Endovasc Surg. 2002;23(6):543–9. doi: 10.1053/ejvs.2002.1620. [DOI] [PubMed] [Google Scholar]
- 32.Rizzo RJ, McCarthy WJ, Dixit SN, Lilly MP, Shively VP, Flinn WR, et al. Collagen types and matrix protein content in human abdominal aortic aneurysms. J Vasc Surg. 1989;10(4):365–73. doi: 10.1067/mva.1989.13151. [DOI] [PubMed] [Google Scholar]
- 33.Schurink GW, van Baalen JM, Visser MJ, van Bockel JH. Thrombus within an aortic aneurysm does not reduce pressure on the aneurysmal wall. J Vasc Surg. 2000;31(3):501–6. [PubMed] [Google Scholar]
- 34.Piechota-Polanczyk A, Jozkowicz A, Nowak W, Eilenberg W, Neumayer C, Malinski T, et al. The Abdominal Aortic Aneurysm and Intraluminal Thrombus: Current Concepts of Development and Treatment. Front Cardiovasc Med. 2015;2:19. doi: 10.3389/fcvm.2015.00019. [DOI] [PMC free article] [PubMed] [Google Scholar]
- 35.Abbas A, Smith A, Cecelja M, Hussain T, Greil G, Chowienczyk P, et al. Segmental aortic stiffness measured by MRI in patients with abdominal aortic aneurysm (AAA) International Journal of Surgery. 2011;9:495–546. [Google Scholar]
- 36.Gaszner B, Varady E, Lenkey ZS, Husznai R, Sarszegi ZS, Fuller J, et al. Comparison of arterial stiffness parameters, epicardial fat volume and coronary calcium score in patients with coronary artery disease. European Heart Journal. 2013;34(Suppl1):1577. [Google Scholar]
- 37.Heilmaier C, Koester A, Moysidis T, Weishaupt D, Kröger K. Abdominal aortic calcification and its distribution in normal-sized and aneurysmatic abdominal aortas. Vasa Suppl. 2014;43(2):132–40. doi: 10.1024/0301-1526/a000339. [DOI] [PubMed] [Google Scholar]
- 38.Buijs RVC, Willems TP, Tio RA, Boersma HH, Tielliu IFJ, Slart RHJA, et al. Calcification as a Risk Factor for Rupture of Abdominal Aortic Aneurysm. Eur J Vasc Endovasc. 2013;46(5):542–8. doi: 10.1016/j.ejvs.2013.09.006. [DOI] [PubMed] [Google Scholar]
- 39.Yin M, Manduca A, Romano AJ, Glaser KJ, Drapaca CS, Lake DS, et al. 3-D Local Frequency Estimation Inversion for Abdominal MR Elastography; Proceedings of the 15th Annual Meeting of ISMRM; Berlin, Germany. ISMRM; 2007. [Google Scholar]
- 40.Ehman EC, Rossman PJ, Kruse SA, Sahakian AV, Glaser KJ. Vibration safety limits for magnetic resonance elastography. Phys Med Biol. 2008;53(4):925–35. doi: 10.1088/0031-9155/53/4/007. [DOI] [PMC free article] [PubMed] [Google Scholar]


