Abstract
Human visual performance has been observed to exhibit superiority in localized regions of the visual field across many classes of stimuli. However, the underlying neural mechanisms remain unclear. This study aims to determine if the visual information processing in the human brain is dependent on the location of stimuli in the visual field and the corresponding neuroarchitecture using blood-oxygenation-level-dependent functional MRI (fMRI) and diffusion kurtosis MRI (DKI), respectively in 15 healthy individuals at 3 Tesla. In fMRI, visual stimulation to the lower hemifield showed stronger brain responses and larger brain activation volumes than the upper hemifield, indicative of the differential sensitivity of the human brain across the visual field. In DKI, the brain regions mapping to the lower visual field exhibited higher mean kurtosis but not fractional anisotropy or mean diffusivity when compared to the upper visual field. These results suggested the different distributions of microstructural organization across visual field brain representations. There was also a strong positive relationship between diffusion kurtosis and fMRI responses in the lower field brain representations. In summary, this study suggested the structural and functional brain involvements in the asymmetry of visual field responses in humans, and is important to the neurophysiological and psychological understanding of human visual information processing.
Keywords: diffusion kurtosis imaging, functional MRI, human brain, vision, visual field asymmetry
Introduction
Human visual performance differs throughout the visual field in response to a variety of stimuli. Specifically, humans may perform better in the lower visual field than upper visual field, a phenomenon often referred to as vertical asymmetry1–3. Horizontal-vertical anisotropy has also been demonstrated, whereby visual performance appears better in the horizontal meridian than vertical meridian in many classes of stimuli4,5. However, the neural mechanisms of such lower visual field and horizontal meridian advantages in human visual processing remain incompletely understood6–9. It is unclear whether and how the human brain is involved, through structure or function, in this differentiation of behavioral performance across the visual field. It is also unclear if structural-functional brain relationships exist across the visual field. Understanding the neural correlates of visual field performance in normal healthy subjects may lay a foundation into the neurophysiological and psychological mechanisms of visual information processing. It may also help provide insights to the neural basis of visual outcomes in diseases that are susceptible to regional visual field deficits. For example, primary open angle glaucoma has been shown to preferentially affect the superior visual field over the inferior visual field10, however falls may occur more frequently in subjects with inferior than superior visual field loss11.
This study aims to determine if the processing of visual information in the brain is dependent on the location of stimuli in the visual field by quantitatively examining the brain’s response to visual presentations to (1) the upper and lower hemifields and (2) the vertical and horizontal meridians using functional magnetic resonance imaging (fMRI). To detect a potential structural correlate of visual field asymmetry, the neural tissue characteristics across the activated brain areas in fMRI were evaluated using diffusion kurtosis imaging (DKI) and diffusion tensor imaging (DTI). DTI implicitly assumes that water molecule diffusion occurs in a free and unrestricted environment with a Gaussian distribution of diffusion displacement. However, the complex cellular components and structures in biological tissues hinder and restrict the diffusion of water molecules12,13. Such restricted or non-Gaussian diffusion hence cannot be approximated accurately by a DTI model. DKI is an extension of the DTI technique, which approximates the diffusion weighted signal attenuation more accurately by quantifying the degree of non-Gaussian diffusion. This may provide a more precise representation of water diffusion properties in the brain than DTI alone, and thus is potentially more sensitive to microstructural complexities in both gray matter and white matter of the brain12,13. We hypothesized that the human brain is more sensitive to visual stimulation to the lower hemifield and the horizontal meridian than the upper hemifield and the vertical meridian, respectively in fMRI. Additionally, DKI may be more sensitive than DTI to detect differences in neuroarchitecture between different visual field representations.
Materials and Methods
Fifteen healthy adults (8 males and 7 females, mean age = 27.1±3.5 years, age range = 22–32 years) were recruited for participation in this study. All subjects had no known mental or neurological disorders and had normal or corrected-to-normal vision. Informed consent was obtained from all individual participants included in the study prior to participation. All studies were approved by the University of Pittsburgh Institutional Review Board in accordance with the Declaration of Helsinki.
MRI Protocol
All fMRI and DKI data were collected on a 3-Tesla Siemens Allegra scanner using a single channel transmit/receive head volume coil with an integrated mirror and a rear-projector giving a field of view of 26 degrees. For fMRI, the brain activity in response to visual field presentations was assessed by fMRI scans with both eyes open and focusing on a fixation point to establish the center of the visual field. Each fMRI scan was 5 min long consisting of 12 blocks of alternating 12 s of rest and 12 s of visual stimulation. The stimuli were checkerboard patterns flashing at 8 Hz and were presented using the e-prime software (Psychology Software Tools, Inc., Sharpsburg, PA, USA) at full contrast. Each participant underwent 2 separate fMRI scans, where 2 visual field regions [(1) upper versus lower hemifields, or (2) vertical versus horizontal meridians] were stimulated and compared during each scan by alternating the stimulus pattern between odd and even blocks. Blood-oxygenation-level-dependent (BOLD) images were collected using a single-shot gradient-echo echo-planar-imaging pulse sequence with the following parameters: repetition time = 2 s, echo time = 26 ms, field of view = 24×24 cm2, 96×96 imaging matrix, 2.5×2.5 mm2 in-plane resolution and 28 contiguous 2.5 mm thick axial slices. The slices were arranged to cover most of the cerebrum while ensuring the entire occipital lobe was covered.
For DKI, data were collected in the same subjects after fMRI scans using a single-shot spin-echo echo-planar-imaging pulse sequence with the following parameters: repetition time = 5400 s, echo time = 112 ms, field of view = 24×24 cm2, 96×96 imaging matrix, 2.5×2.5 mm2 in-plane resolution and 36 contiguous 2.5 mm thick axial slices. Five non-diffusion-weighted images (b0) and 50 diffusion-weighted images at 50 gradient directions were acquired at diffusion weighting factor (b) = 500, 1000, 1500, 2000 and 2500 s/mm2 each.
Data Analysis
FMRI data processing was carried out using FEAT (FMRI Expert Analysis Tool) v.5.98 in FSL software14. The following pre-processing procedures were applied: motion correction using MCFLIRT15, non-brain removal using BET16, grand-mean intensity normalization of the entire 4D dataset by a single multiplicative factor, and high-pass temporal filtering using Gaussian-weighted least-squares straight line fitting with sigma = 24.0 s. Time-series statistical analysis was carried out using FILM with local autocorrelation correction17. Z (Gaussianised T/F) statistic images were thresholded using clusters determined by Z>2.3 and a corrected cluster significance threshold of p=0.0518. Mean BOLD % change and BOLD activation volume were calculated for each participant and were compared between upper and lower hemifields, or between vertical and horizontal meridians using Wilcoxon matched-paired signed rank tests with significance set at p<0.05 (GraphPad Prism v.6.00, GraphPad Software, La Jolla California USA).
For DKI, co-registration between non-diffusion-weighted b0 images and diffusion-weighted images at different b-values was performed using SPM8 (Wellcome Department of Imaging Neuroscience, University College, London, UK). To evaluate the sensitivity of DKI and DTI in detecting brain structural differences across visual fields, both diffusion tensors and kurtosis tensors were fitted on a pixel-by-pixel basis from the non-diffusion-weighted b0 images and the diffusion-weighted images using a Levenberg–Marquart non-linear fitting algorithm12. The eigenvectors and eigenvalues of the diffusion tensors and kurtosis tensors were derived to compute the DTI and DKI parametric maps including the fractional anisotropy, mean diffusivity and mean kurtosis maps. These diffusion-based MRI parametric values were extracted from the regions of interest given by the fMRI brain activation maps for each of the four visual stimulus locations (upper and lower visual fields, and the horizontal and vertical meridians). Wilcoxon matched-paired signed rank tests were performed comparing the DTI and DKI measures of all participants between the upper and lower hemifields, or between the vertical and horizontal meridians with significance set at p<0.05. Lastly, to explore the relationships between fMRI and DKI or DTI, Pearson’s correlation coefficient was calculated between each of the diffusion-based MRI parametric values and BOLD % change with statistical significance set at 0.05 (GraphPad Prism v.6.00, GraphPad Software, La Jolla California USA).
Results
Figure 1 shows the visual presentation patterns and the representative brain activation maps in response to visual stimulation to the upper and lower hemifields (top 2 rows) and the vertical and horizontal meridians (bottom 2 rows). Upper and lower hemifield stimulation predominantly activated the ventral and dorsal regions of the occipital cortex, respectively including but not limited to the visual areas V1, V2 and V3. On the other hand, the brain regions activated by vertical and horizontal meridian stimulation were mainly localized at the V1–V2 and V2–V3 borders, respectively. Quantitative analyses in Figure 2 show that both the average BOLD % change and the BOLD volume in the activated brain regions were significantly greater for lower hemifield stimulation than upper hemifield stimulation. No apparent difference in the average BOLD % change was observed between vertical and horizontal meridian visual stimulation. However, visual presentation to the horizontal meridian appeared to activate slightly larger brain volumes than visual presentation to the vertical meridian (p=0.11).
Figure 1.
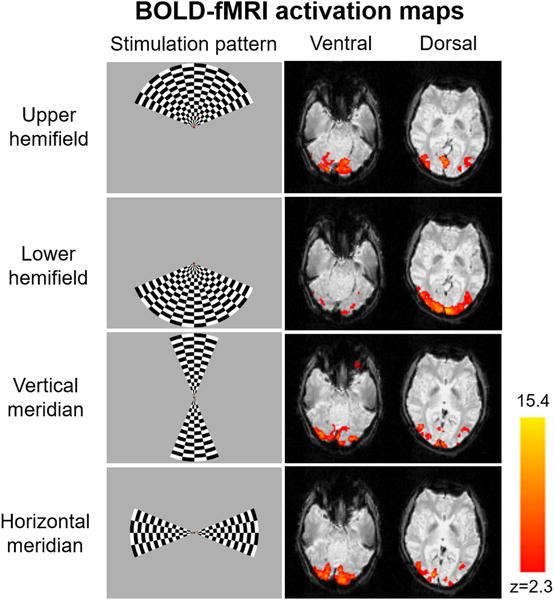
Sample checkerboard flickering visual stimuli to 4 different regions in the visual fields (left column) and the corresponding fMRI activation maps (right column) represented by z-scores at the ventral and dorsal levels of the occipital cortex from a representative participant using gradient-echo echo planar imaging.
Figure 2.
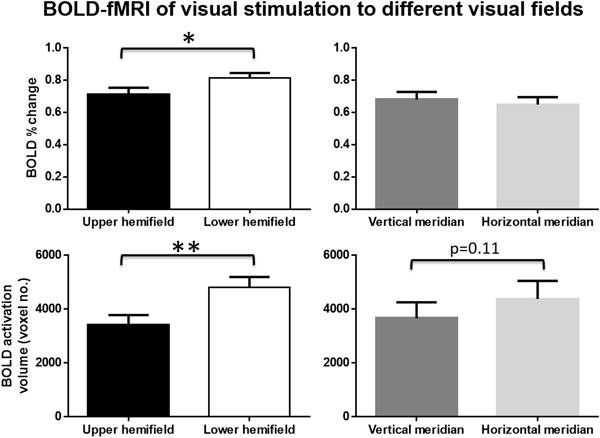
(Top row) Average BOLD amplitude in activated brain regions and (bottom row) average brain activation volume in response to visual stimulation to the upper and lower hemifields (left column) and the vertical and horizontal meridians (right column) among 15 healthy adult subjects. (Mean ± SEM; Wilcoxon matched-pairs signed rank tests, *p<0.05; **p<0.01)
Figure 3 depicts the representative diffusion-based MRI parametric maps in the ventral and dorsal slices of the brain. The brain regions mapping to the lower visual field by fMRI exhibited significantly greater mean kurtosis than the upper visual field (Fig. 4), whereas the T2-weighted signal intensity (bo)(p=0.08) and mean diffusivity (p=0.07) showed a trend toward being greater with the upper field brain representations than the lower field (Fig. 4). There was no significant difference in fractional anisotropy between hemifield presentations in the brain (p>0.1). Comparing the brain regions mapped by horizontal and vertical meridian stimulation in fMRI, no apparent difference in any of the diffusion-based MRI measures was observed, although there was a trend towards greater mean kurtosis in the brain regions activated by the vertical meridian relative to the horizontal meridian (p=0.08)(Fig. 5).
Figure 3.
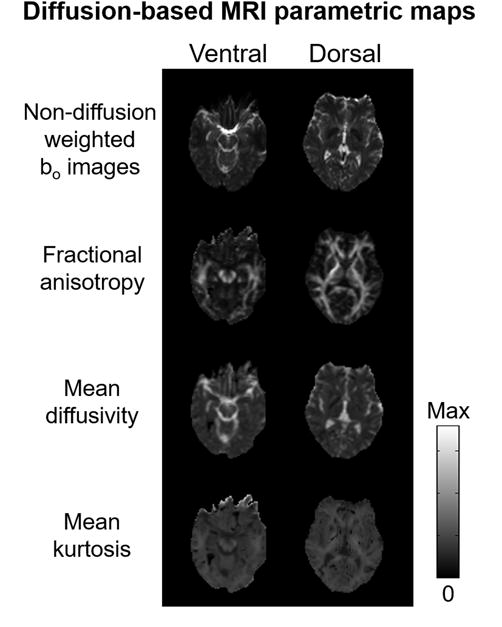
Sample diffusion-based MRI parametric maps of a representative participant at the ventral and dorsal levels of the occipital cortex. [Max = 1000 a.u. (bo); 1.0 (fractional anisotropy); 6.0 μm2/ms (mean diffusivity); 4.0 (mean kurtosis)]
Figure 4.
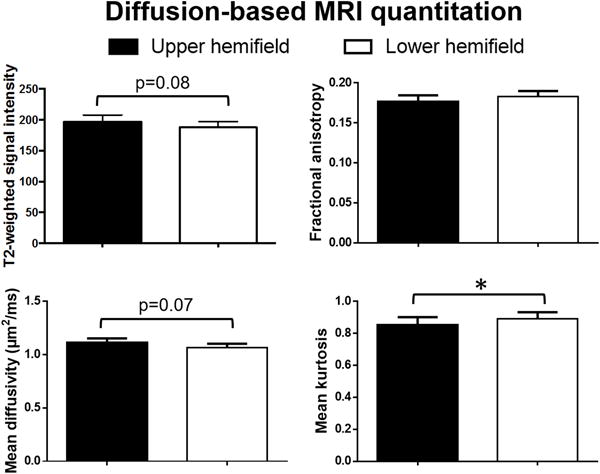
Quantitative comparisons of diffusion-based MRI parameters measured from overlays of fMRI activation maps of hemifield stimulation in Figure 1 onto the brain structures. (Mean ± SEM; Wilcoxon matched-pairs signed rank tests, *p<0.05)
Figure 5.
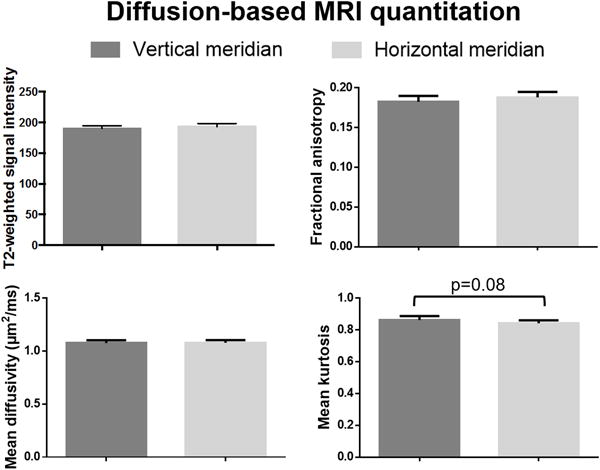
Quantitative comparisons of diffusion-based MRI parameters measured from overlays of fMRI activation maps of meridian stimulation in Figure 1 onto the brain structures. (Mean ± SEM; Wilcoxon matched-pairs signed rank tests, *p<0.05)
The Pearson correlation coefficients between functional BOLD % change and diffusion-based MRI measures are presented in Table 1. Significant positive relationships were observed between BOLD % change and mean kurtosis for the lower field brain representation only.
Table 1.
Pearson correlations between fMRI BOLD % change and diffusion-based MRI parameters in the lower and upper visual field brain regions. (*p<0.05) (T2WI: T2-weighted MRI; FA: fractional anisotropy; MD: mean diffusivity; and MK: mean kurtosis)
| Upper field BOLD% change vs | T2WI | FA | MD | MK |
|---|---|---|---|---|
| r | −0.42 | 0.25 | 0.15 | 0.39 |
| p | 0.12 | 0.37 | 0.61 | 0.15 |
| Lower field BOLD% change vs | T2WI | FA | MD | MK |
|
| ||||
| r | −0.08 | 0.23 | −0.37 | 0.57 |
| p | 0.78 | 0.42 | 0.17 | *0.03 |
Discussion
The present results corroborate recent psychophysical1–3 and neurophysiological studies6–9,19 that showed asymmetries between upper and lower field visual information processing. Specifically, lower hemifield visual stimulation produced stronger brain responses than upper hemifield stimulation in fMRI8,9, visual evoked potentials7 and magnetoencephalography6, suggesting that the human brain is more sensitive to certain environmental changes in the lower visual field than the upper visual field. In DKI, the brain regions represented by the lower visual field showed generally greater mean kurtosis than the upper visual field. This suggests the presence of neuroanatomical differentiation across visual field brain regions. For example, recent literature suggested a larger number of cortical neurons corresponding to stimuli in the lower than upper visual field9. Significant differences in receptor densities were also observed between dorsal and ventral visual cortices in the human brains20. Such neuronal and molecular distributions may restrict water diffusion to different extents between lower and upper field brain representations leading to the different mean kurtosis as observed in the current study. Both structural and functional brain differences between hemifields may also arise due to the fact that there is more cortical area designated to the lower field observed in both humans and non-human primates19,21. Only kurtosis, and not tensor measures showed a significant difference between hemifield brain presentations in diffusion-based MRI, possibly because DKI is more sensitive than DTI in detecting brain microstructural differences in neural tissues, particularly in the gray matter12.
There was a trend approaching significance toward greater BOLD activation volumes and lower mean kurtosis for the horizontal meridian presentation than the vertical meridian in the brain. The vertical and horizontal meridians are known to retinotopically map to the V1–V2 and V2–V3 borders, respectively, and may possess horizontal-vertical anisotropy perceptually in humans4,5. Although visual stimulation to the horizontal meridian activated slightly larger brain areas than the vertical meridian, the lack of difference between the strengths of functional brain responses to the vertical and horizontal meridian visual stimulation suggests that the asymmetry in visual brain processing between upper and lower visual fields is more pronounced than the anisotropy between vertical and horizontal meridians using current testing visual presentation paradigms. However, it should be noted that this disparity could also be partly attributed to the smaller size of the meridian stimuli than the hemifield stimuli. More precise experiments with different types and sizes of stimuli are expected to further examine the causes of such observations in the future.
Diffusion-based MRI and fMRI had been combined to evaluate the structure-function relationships in the human visual system22. In this study, the comparisons between fMRI and diffusion-based MRI measures in different parts of the visual field indicated that there is a strong positive correlation between functional activation and diffusion kurtosis in brain regions represented by the lower visual field. DKI may also be more sensitive than DTI at probing gray matter microstructural differences that may be the basis of variations in functional brain responses and behavioral performance.
There are several limitations to the present study, the first being a small sample size of only young adults. Future studies should include a larger population and encompass a greater age range to determine any age-dependent effects on visual field asymmetry in the brain. This may also provide clinical relevance because of the increasing aging population and age-related diseases that are susceptible to regional visual field loss in the brain such as glaucoma23. Additionally, the quantitative fMRI and DKI comparisons were based on the global average across activated brain regions for each type of visual field stimulations. It has been shown that the sizes of visual areas V1, V2 and V3 may vary by more than a factor of 2 across individuals19. The microstructural organization may also vary across visual areas and between dorsal and ventral brain regions in humans20. Although there was no apparent correlation between BOLD activation volume and DKI measures in each visual field stimulation presented to our subjects (data not shown), global averaging might have smoothened out any varying local differences between visual areas leading to the relatively small DKI or DTI differences across visual field brain representations. In addition to comparing activation strength, size and microstructural complexities globally between hemifield brain representations, future studies may utilize more precise retinotopic mapping to account for individual variability and to determine which localized regions of the occipital cortex are more susceptible to visual field asymmetry, and whether there is any top-down or bottom-up modulation of neural asymmetry across lower- and higher-order visual brain areas using different experimental tasks24,25.
In conclusion, using DKI and fMRI, significant structural and functional brain involvements were found in visual vertical asymmetry in healthy adults, whereas some evidence of brain involvement might be observed toward horizontal-vertical meridian anisotropy. The brain regions corresponding to the lower visual field showed greater functional activation and diffusion kurtosis compared to the upper visual field. Further, there was a significant positive correlation between functional activation and diffusion kurtosis in the lower visual field brain representations, suggestive of a strong structural-functional relationship in the human brain that processes visual information from the lower field. The identified structural and functional brain differences across visual fields in this study can be important in providing insights into the neurophysiological and psychological bases of human visual information processing in health and disease.
Acknowledgments
Sources of funding: This work was supported by the National Institutes of Health P30-EY008098, and T32-EY017271 (Bethesda, Maryland); BrightFocus Foundation G2016030 (Clarksburg, Maryland); Eye and Ear Foundation (Pittsburgh, Pennsylvania); and Research to Prevent Blindness (New York, New York).
Footnotes
Conflicts of interest: None declared
References
- 1.Rubin N, Nakayama K, Shapley R. Enhanced perception of illusory contours in the lower versus upper visual hemifields. Science (New York, NY) 1996;271(5249):651–653. doi: 10.1126/science.271.5249.651. [DOI] [PubMed] [Google Scholar]
- 2.Levine MW, McAnany JJ. The relative capabilities of the upper and lower visual hemifields. Vision research. 2005;45(21):2820–2830. doi: 10.1016/j.visres.2005.04.001. [DOI] [PubMed] [Google Scholar]
- 3.Thomas NA, Elias LJ. Upper and lower visual field differences in perceptual asymmetries. Brain research. 2011;1387:108–115. doi: 10.1016/j.brainres.2011.02.063. [DOI] [PubMed] [Google Scholar]
- 4.Abrams J, Nizam A, Carrasco M. Isoeccentric locations are not equivalent: the extent of the vertical meridian asymmetry. Vision research. 2012;52(1):70–78. doi: 10.1016/j.visres.2011.10.016. [DOI] [PMC free article] [PubMed] [Google Scholar]
- 5.Anderson JE, Leslie Cameron E, Levine MW. A method for quantifying visual field inhomogeneities. Vision research. 2014;105:112–120. doi: 10.1016/j.visres.2014.09.010. [DOI] [PubMed] [Google Scholar]
- 6.Portin K, Vanni S, Virsu V, Hari R. Stronger occipital cortical activation to lower than upper visual field stimuli Neuromagnetic recordings. Experimental brain research. 1999;124(3):287–294. doi: 10.1007/s002210050625. [DOI] [PubMed] [Google Scholar]
- 7.Hagler DJ., Jr Visual field asymmetries in visual evoked responses. J Vis. 2014;14(14):13. doi: 10.1167/14.14.13. [DOI] [PMC free article] [PubMed] [Google Scholar]
- 8.Chen H, Yao D, Liu Z. A study on asymmetry of spatial visual field by analysis of the fMRI BOLD response. Brain Topogr. 2004;17(1):39–46. doi: 10.1023/b:brat.0000047335.00110.6a. [DOI] [PubMed] [Google Scholar]
- 9.Liu T, Heeger DJ, Carrasco M. Neural correlates of the visual vertical meridian asymmetry. J Vis. 2006;6(11):1294–1306. doi: 10.1167/5.1.1. [DOI] [PMC free article] [PubMed] [Google Scholar]
- 10.Traynis I, De Moraes CG, Raza AS, Liebmann JM, Ritch R, Hood DC. Prevalence and nature of early glaucomatous defects in the central 10 degrees of the visual field. JAMA ophthalmology. 2014;132(3):291–297. doi: 10.1001/jamaophthalmol.2013.7656. [DOI] [PMC free article] [PubMed] [Google Scholar]
- 11.Black AA, Wood JM, Lovie-Kitchin JE. Inferior field loss increases rate of falls in older adults with glaucoma. Optom Vis Sci. 2011;88(11):1275–1282. doi: 10.1097/OPX.0b013e31822f4d6a. [DOI] [PubMed] [Google Scholar]
- 12.Cheung MM, Hui ES, Chan KC, Helpern JA, Qi L, Wu EX. Does diffusion kurtosis imaging lead to better neural tissue characterization? A rodent brain maturation study. NeuroImage. 2009;45(2):386–392. doi: 10.1016/j.neuroimage.2008.12.018. [DOI] [PubMed] [Google Scholar]
- 13.Veraart J, Poot DH, Van Hecke W, Blockx I, Van der Linden A, Verhoye M, et al. More accurate estimation of diffusion tensor parameters using diffusion Kurtosis imaging. Magnetic resonance in medicine : official journal of the Society of Magnetic Resonance in Medicine/Society of Magnetic Resonance in Medicine. 2011;65(1):138–145. doi: 10.1002/mrm.22603. [DOI] [PubMed] [Google Scholar]
- 14.Jenkinson M, Beckmann CF, Behrens TE, Woolrich MW, Smith SM. FSL. NeuroImage. 2012;62(2):782–790. doi: 10.1016/j.neuroimage.2011.09.015. [DOI] [PubMed] [Google Scholar]
- 15.Jenkinson M, Bannister P, Brady M, Smith S. Improved Optimization for the Robust and Accurate Linear Registration and Motion Correction of Brain Images. NeuroImage. 2002;17(2):825–841. doi: 10.1016/s1053-8119(02)91132-8. [DOI] [PubMed] [Google Scholar]
- 16.Smith SM. Fast robust automated brain extraction. Hum Brain Mapp. 2002;17(3):143–155. doi: 10.1002/hbm.10062. [DOI] [PMC free article] [PubMed] [Google Scholar]
- 17.Woolrich MW, Ripley BD, Brady M, Smith SM. Temporal Autocorrelation in Univariate Linear Modeling of FMRI Data. NeuroImage. 2001;14(6):1370–1386. doi: 10.1006/nimg.2001.0931. [DOI] [PubMed] [Google Scholar]
- 18.Worsley KJ. Statistical analysis of activation images. In: Jezzard P, Matthews PM, Smith SM, editors. Functional MRI: An Introduction to Methods. New York: Oxford University Press; 2001. [Google Scholar]
- 19.Dougherty RF, Koch VM, Brewer AA, Fischer B, Modersitzki J, Wandell BA. Visual field representations and locations of visual areas V1/2/3 in human visual cortex. J Vis. 2003;3(10):586–598. doi: 10.1167/3.10.1. [DOI] [PubMed] [Google Scholar]
- 20.Eickhoff SB, Rottschy C, Kujovic M, Palomero-Gallagher N, Zilles K. Organizational principles of human visual cortex revealed by receptor mapping. Cereb Cortex. 2008;18(11):2637–2645. doi: 10.1093/cercor/bhn024. [DOI] [PMC free article] [PubMed] [Google Scholar]
- 21.Van Essen DC, Newsome WT, Maunsell JH. The visual field representation in striate cortex of the macaque monkey: asymmetries, anisotropies, and individual variability. Vision research. 1984;24(5):429–448. doi: 10.1016/0042-6989(84)90041-5. [DOI] [PubMed] [Google Scholar]
- 22.Werring DJ, Clark CA, Parker GJ, Miller DH, Thompson AJ, Barker GJ. A direct demonstration of both structure and function in the visual system: combining diffusion tensor imaging with functional magnetic resonance imaging. Neuroimage. 1999;9(3):352–361. doi: 10.1006/nimg.1999.0421. [DOI] [PubMed] [Google Scholar]
- 23.Murphy MC, Conner IP, Teng CY, Lawrence JD, Safiullah Z, Wang B, et al. Retinal Structures and Visual Cortex Activity are Impaired Prior to Clinical Vision Loss in Glaucoma. Sci Rep. 2016;6:31464. doi: 10.1038/srep31464. [DOI] [PMC free article] [PubMed] [Google Scholar]
- 24.Talgar CP, Carrasco M. Vertical meridian asymmetry in spatial resolution: visual and attentional factors. Psychon Bull Rev. 2002;9(4):714–722. doi: 10.3758/bf03196326. [DOI] [PubMed] [Google Scholar]
- 25.Montaser-Kouhsari L, Carrasco M. Perceptual asymmetries are preserved in short-term memory tasks. Atten Percept Psychophys. 2009;71(8):1782–1792. doi: 10.3758/APP.71.8.1782. [DOI] [PMC free article] [PubMed] [Google Scholar]


