

Abstract
Background
Clinical decision support systems are used to help predict patient stability and mortality in the Intensive Care Unit (ICU). Accurate patient information can assist clinicians with patient management and in allocating finite resources. However, systems currently in common use have limited predictive value in the clinical setting. The increasing availability of Electronic Health Records (EHR) provides an opportunity to use medical information for more accurate patient stability and mortality prediction in the ICU.
Objective
Develop and evaluate an algorithm which more accurately predicts patient mortality in the ICU, using the correlations between widely available clinical variables from the EHR.
Methods
We have developed an algorithm, AutoTriage, which uses eight common clinical variables from the EHR to assign patient mortality risk scores. Each clinical variable produces a subscore, and combinations of two or three discretized clinical variables also produce subscores. A combination of weighted subscores produces the overall score. We validated the performance of this algorithm in a retrospective study on the MIMIC III medical ICU dataset.
Results
AutoTriage 12 h mortality prediction yields an Area Under Receiver Operating Characteristic value of 0.88 (95% confidence interval 0.86 to 0.88). At a sensitivity of 80%, AutoTriage maintains a specificity of 81% with a diagnostic odds ratio of 16.26.
Conclusions
Through the multidimensional analysis of the correlations between eight common clinical variables, AutoTriage provides an improvement in the specificity and sensitivity of patient mortality prediction over existing prediction methods.
Keywords: Clinical decision support systems, Mortality prediction, Electronic health records, Medical informatics
Highlights
-
•
Multi-dimensional analysis of clinical inputs used to generate mortality risk scores.
-
•
AutoTriage 12 h mortality prediction achieves an AUROC of 0.88.
-
•
Sensitivity of 80% at a specificity of 81% with diagnostic odds ratio of 16.
-
•
Outperforms MEWS, SOFA and SAPS II for mortality prediction, with an accuracy of 80%.
1. Introduction
There is a need for accurate prediction of mortality risk and patient deterioration in the Intensive Care Unit (ICU) [1]. Advanced warning of patient deterioration is crucial for timely medical intervention and patient management, and accurate risk assessment aids in the allocation of limited ICU resources. Clinical Decision Support Systems (CDSS) have been used in the ICU for predicting patient outcome and to score the severity of patient condition [2], [3], [4]. The vast majority of prediction models currently in use are based on aggregate baseline patient characteristics. These systems usually rely on a weighted linear combination of features, such as age, type of admission, and vital sign measurements. However, the most commonly used CDSS such as the Modified Early Warning Score (MEWS) [5], the Sequential Organ Failure Assessment (SOFA) [6], and the Simplified Acute Physiology Score (SAPS II) [7], have suboptimal specificity and sensitivity when applied to patient mortality prediction [2]. These CDSS assessments assume that risk factors are independent from one another, and, therefore, they are not sensitive to the underlying complex homeostatic physiologies of patients. Additionally, they do not account for variations in individual patient physiologies and trends in patient information.
The increasing prevalence of Electronic Health Records (EHR) provides an opportunity to extract clinically relevant patient vital signs and laboratory results for increased predictive value in patient outcome [8]. In the ICU, a variety of relevant clinical measurements are available with high frequency and present a wealth of information regarding patient status and trends. Some recent studies have attempted to use these EHR data and trends to improve patient mortality predictions with computational algorithms, with some success [9], [10], [11]. In particular, analyses of time interval motifs have led to accurate predictions, and we build on this previous work in this study [12]. We present here a computational approach called AutoTriage, which not only utilizes patient clinical variables including vital signs, but also analyzes the correlations and trends between these measurements to provide information about patient stability. Using correlations among clinical variables allows us to achieve improved accuracy of patient stability prediction, using only eight very common measurements. AutoTriage provides an all-cause mortality prediction score 12 h in advance for ICU patients.
2. Methods
2.1. Data set
We used a dataset of 9683 patient records from the Multiparameter Intelligent Monitoring in Intensive Care (MIMIC) III database [13], which were selected according to the patient exclusion process depicted in Fig. 1. This subset consisted of anonymized clinical documentation of adult patients admitted to the Beth Israel Deaconess Medical Center (BIDMC) Medical Intensive Care Unit (MICU), with a variety of chief complaints (Table 1). The Institutional Review Boards of BIDMC and the Massachusetts Institute of Technology waived the requirement for individual patient consent, as the study did not impact clinical care and all data were de-identified.
Fig. 1.
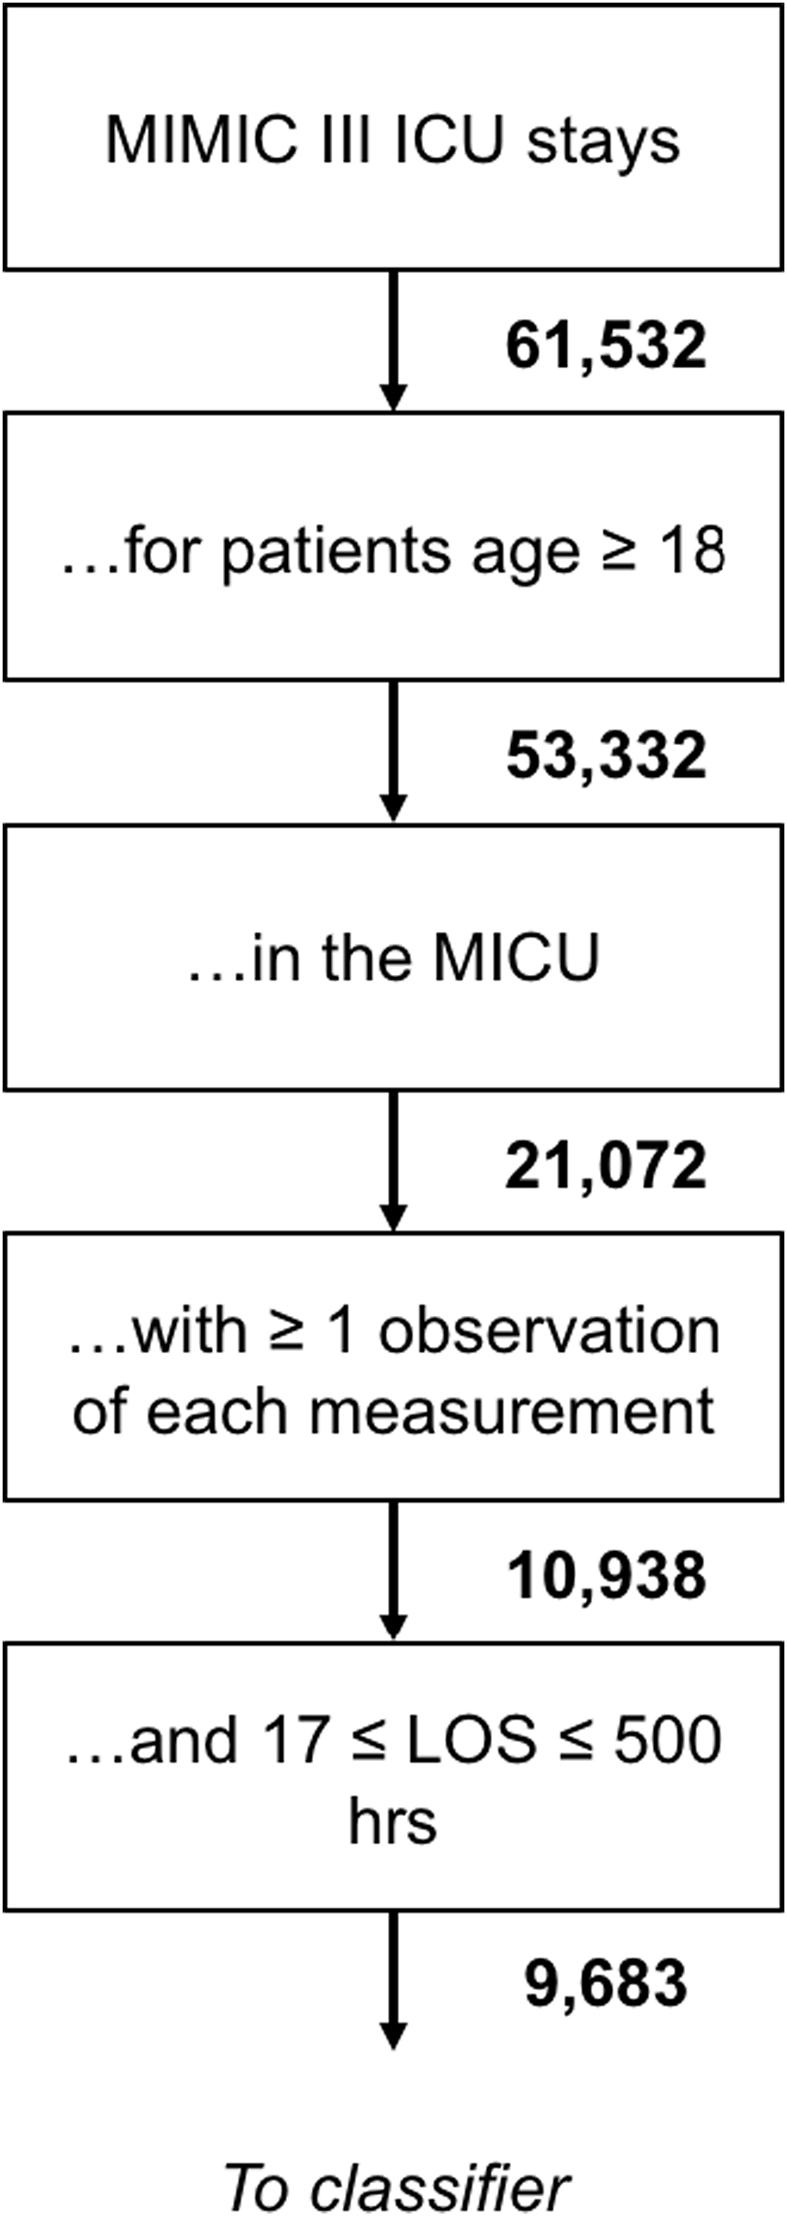
Patient inclusion flowchart.
Table 1.
Demographics of patient population over 18 years of age in the MICU of the MIMIC III database (20,108 total hospital admissions).
| Demographic overview | Characteristic | Number of ICU stays | Percentage |
|---|---|---|---|
| Gender | Female | 10,176 | 48.29% |
| Male | 10,896 | 51.71% | |
|
Age Median 64, IQR (51–78) |
18–29 | 984 | 4.67% |
| 30–39 | 1328 | 6.30% | |
| 40–49 | 2421 | 11.49% | |
| 50–59 | 3717 | 17.64% | |
| 60–69 | 4147 | 19.68% | |
| 70+ | 8475 | 40.22% | |
|
Length of Stay (days) Median 2.1, IQR (1.2–4.1) |
0–2 | 13,646 | 64.76% |
| 3–5 | 4057 | 19.25% | |
| 6–8 | 1301 | 6.17% | |
| 9–11 | 685 | 3.25% | |
| 12+ | 1383 | 6.56% | |
| Death During Hospital Stay | Yes | 18,821 | 89.32% |
| No | 2251 | 10.68% |
Inclusion criteria for this study were:
-
I.
Adult (i.e. age ≥18 years) admitted to the MICU.
-
II.
Documented length-of-stay and survival for at least 17 h and fewer than 500 h following admission. The cutoff of 17-h observation was chosen to allow 12-h advance prediction based on at least 5 h of data. The limit of 500 h was chosen to reduce memory usage and the time cost of computations.
We utilized dynamic physiological measurements with a one hour timeresolution. Specifically, we used heart rate, pH, pulse pressure, respiration rate, blood oxygen saturation, systolic blood pressure, temperature, and white blood cell count. These eight measurements were chosen due to the practical considerations of implementing a stability recommendation tool in a clinical setting and to facilitate comparison of our results with MEWS, SAPS II, and SOFA, which also rely on similar inputs. In particular, these measurements were chosen because they are commonly available in the ICU, ensuring that our predictions are up-to-date and less susceptible to missing data. We selected the variables used here because of their frequency (measured often) and their prevalence (measured for most of the patients in the population), as well as their relevance to patient stability and outcome.
2.2. Gold standard
Our gold standard was in-hospital mortality. This gold standard definition classified 1574 patients as having in-hospital deaths and 8109 patients as survivors, resulting in a prevalence of 16.26% in-hospital mortality.
The partitioning was done with a built-in MATLAB (MathWorks, Natick, MA, R2014a) function, which randomized the patient ICU stays being placed in each group based on their ICU stay identification number (ID). In the MIMIC-III database, ICU stay IDs were assigned to patients with randomized medical record numbers to meet the HIPAA Privacy Rule in de-identified clinical data.
2.3. Binning, feature construction, and score assignment
We allocated individual measurements into bins - categories based on ranges of numerical values. For example, one bin would contain heart rate values between 80 and 90, a second bin would contain values between 90 and 100, and so on. By grouping measurements into bins, we were able to estimate the likelihood of in-hospital death associated with measurement ranges and consider the likelihood of death associated with multiple kinds of measurements together. The effect of two- and three-variable combinations of these binned measurements on mortality risk was assessed. Each variable and each combination of binned measurements thus produces a subscore indicating a contribution to the risk of in-hospital death, and the subscores were combined to produce the overall score.
The time-parameterized sequences of measurements were used to calculate the corresponding trends for the measurements of each patient. Trends were considered to be features in the same way as the measurements from which they were calculated. In other words, for each pair of adjacent hours with a blood pressure measurement, we calculated a corresponding change in blood pressure, and both the measurements and changes were correlated with in-hospital death. For hours without an updated value of a given measurement, the value was taken to be the most recent value available, and trends were calculated from this imputed value.
At any time, we use 5 h of data to calculate our mortality score. For this retrospective study, we chose to make predictions at a time 12 h prior to the patient's discharge or death. These parameters can be easily adjusted, and in prospective implementation the parameters for the initial data calculation window and subsequent alert windows can be set to the clinician's preference. For this implementation, we required 17 h of patient data to be able to generate an alert at 12 h prior to patient death or discharge, after the 5-h data gathering window.
Custom MATLAB scripts were used to correlate measurements and their trends with the in-hospital death gold standard outcomes. For example, we calculated the correlations between bins of blood pressure, heart rate, and respiration rate individually with in-hospital death, as well as for pairs (one bin from each measurement in the pair) and triplets (one bin from each measurement in the triplet). Each individual, pair, and triplet of measurements or trends was then weighted with a numerical value from 0 to 1, with higher weights given to groups of measurements or trends that were more highly correlated with in-hospital death. After this step, weights were fixed.
In order to scale and combine the weights of features from individual, pairs, and triplets of measurements or trends to best predict patient outcomes, we performed a logistic regression. First the weights of individual measurements were summed and, likewise, the weights of individual trends, pairs of trends, and triplets of trends were summed. These sums were then scaled and combined according to the following equation to form AutoTriage scores which best reflected the patient outcomes from a training set.
The coefficients αi were chosen by an algorithm to maximize the area under the training set receiver operating characteristic curve, and the Pi represent the correlations between measurement groupings and mortality [14], [15]. The index, i, runs through all possible groupings of singlets, pairs, and triplets of measurements and trends.
2.4. Generating MEWS, SAPS II, and SOFA scores for comparison
MEWS scores were calculated over time for each patient by referencing the MEWS heuristic table, similar to the binning step of AutoTriage score generation. SAPS II and SOFA scores were generated using open source severity score calculation code accompanying the MIMIC III database [16]. We chose to compare our algorithm's performance with just three disease severity scores for clarity of presentation. The most commonly used disease severity scores employ tabulations of vital signs and physiological measurements to achieve patient mortality predictions. There are many potential comparators, such as APACHE II, the Mortality Probability Model (MPM), the Multiple Organ Dysfunction Score (MODS), Logistic Organ Dysfunction System (LODS), the National Early Warning Score (NEWS), and Rapid Emergency Medicine Score (REMS). While differing in the exact clinical measurements used, each of these scoring systems tabulates vital signs and clinical measurements independently of one another and without calculating the time-based trajectories of these variables. Despite the differences in the precise measurements utilized, these linear scoring systems are broadly similar in their results [17], [18].
3. Results
AutoTriage 12 h mortality prediction on the test set is shown in Fig. 2, yielding an Area Under Receiver Operating Characteristic (AUROC) value of 0.88 (95% confidence interval 0.86 to 0.88). Four-fold cross validation results in similar AUROCs. In comparison, MEWS, SAPS II and SOFA calculations on the same data set yield an AUROC of 0.75, 0.71, and 0.72, respectively.
Fig. 2.

Receiver Operating Characteristic (ROC) curves for 12-h mortality prediction in the Medical Intensive Care Unit for AutoTriage, Modified Early Warning Score (MEWS), Sequential Organ Failure Assessment (SOFA), and Simplified Acute Physiology Score (SAPS II). A MEWS of at least 3 has a specificity of 74% and a sensitivity of 66%, whereas an AutoTriage threshold of −2 at a similar specificity of 81% has a sensitivity of 80%.
Table 2 shows a comparison of the sensitivity and specificity for AutoTriage and the most commonly used disease severity scores. For a MEWS ≥ 3, a range often used to indicate patient distress, the sensitivity is only 66% with a specificity of 74%, whereas an AutoTriage score threshold of −2 demonstrates an improved sensitivity of 80% while maintaining a higher specificity of 81%. If all scores are measured at a comparable sensitivity above 75%, AutoTriage shows marked improvement in specificity as well as all other measures for accuracy and predictive value.
Table 2.
Comparison of AutoTriage performance with commonly used disease severity scores for the prediction of 12 h mortality in the Medical Intensive Care Unit. PPV = positive predictive value, NPV = negative predictive value, DOR = diagnostic odds ratio. SAPS II = Simplified Acute Physiology Score, SOFA = Sequential Organ Failure Assessment, MEWS = Modified Early Warning Score.
| AutoTriage (≥-2) | SAPS II (≥21) | SOFA (≥6) | MEWS (≥2) | MEWS (≥3) | |
|---|---|---|---|---|---|
| AUROC | 0.88 | 0.71 | 0.72 | 0.75 | 0.75 |
| Sensitivity | 0.80 | 0.76 | 0.76 | 0.78 | 0.66 |
| Specificity | 0.81 | 0.51 | 0.53 | 0.59 | 0.74 |
| PPV | 0.44 | 0.23 | 0.24 | 0.27 | 0.33 |
| NPV | 0.95 | 0.92 | 0.92 | 0.93 | 0.92 |
| DOR | 16.26 | 3.35 | 3.59 | 5.01 | 5.41 |
| Accuracy | 0.80 | 0.55 | 0.57 | 0.62 | 0.73 |
In Fig. 3 we represent the distribution of patients across the AutoTriage score for survivors and non-survivors. The vertical line represents the threshold of AutoTriage = −2, which represents a sensitivity of 80% and a specificity of 81%. Adjusting the threshold to a lower value will flag additional patients at risk but increase the number of false positive alarms.
Fig. 3.

Patient distribution across AutoTriage score for survivors and non-survivors. The vertical line represents an AutoTriage score of −2.
Additional information about patient stability is provided by the duration of their time above a distress threshold. Setting an AutoTriage threshold above −2 identifies patients in distress for longer consecutive periods of time prior to death than MEWS ≥ 3. The distribution of continuous hours above threshold shows more at-risk patients identified, and for longer periods, than standard disease severity scores (Fig. 4). The increased duration between the AutoTriage threshold crossover and the eventual patient decompensation provides earlier warning and greater intervention opportunity for a significant fraction of patients.
Fig. 4.

Distribution of consecutive hours of threshold breach prior to death for AutoTriage ≥ −2 in black, and Modified Early Warning Score (MEWS) ≥ 3 in red.(For interpretation of the references to colour in this figure legend, the reader is referred to the web version of this article.)
Fig. 5 shows the increase in AUROC as a function of time, calculated over the time distribution of patient data. The predictive power of the algorithm increases as the patients' vital signs continue to destabilize. As expected, models trained for prediction of in-hospital death nearer the time of death are increasingly informative.
Fig. 5.

Area under receiver operating characteristic for AutoTriage as a function of time preceding in-hospital death in the Medical Intensive Care Unit.
4. Discussion
We have previously applied multidimensional analysis of patient measurements and trends to predict stability and recommend discharge [14], and for early detection of sepsis [19] and septic shock [20]. Here, we have shown that a similar framework can also identify patients at risk for in-hospital death. AutoTriage is designed to detect imbalances in homeostasis through the analysis of correlations between patient vital signs and clinical measurements over time. These correlations are used to flag irregularities which are indicative of the loss of feedback mechanisms designed to keep the individual in homeostasis. While these correlations and trends are meaningful and accurate at identifying impending patient distress, it does not provide relevant clinical information to deconstruct these measurements to single values of the component vital signs. The score provided by AutoTriage is an all-factor mortality risk score incorporating available information into an early warning of patient decompensation.
AutoTriage represents an improvement on the accuracy of mortality prediction in the ICU over current severity scoring measures in use. Using only eight commonly available clinical variables we analyze the correlations between pairs and triplets of measurements over time to produce an accurate assessment of impending patient deterioration 12 h before death. This provides the opportunity for appropriate medical intervention or patient management in a timely manner. AutoTriage can accommodate the types and frequencies of measurements available in any given setting. The eight measurements we have used in this study could be substituted or observed less frequently without producing substantial changes in performance. This is because the features used in AutoTriage incorporate the natural redundancy amongst clinical variables and their correlations, and so are relatively robust to variations in the types and frequencies of measurements. Of course, the quality of mortality prediction will degrade if sufficient information about patient condition is not provided.
In this retrospective study, AutoTriage demonstrates improved accuracy, specificity and sensitivity over the commonly used MEWS, SAPS II, and SOFA scores in the prediction of patient mortality (Fig. 2 and Table 2). The increase in PPV for AutoTriage to 44% from 23 to 33% for other methods means fewer false alarms, and thus could be useful in reducing alarm fatigue and increasing the confidence in the need for intervention for patients determined to be at risk. PPV is skewed to be relatively low for all scores because it depends on the prevalence of the condition being measured in the population and mortality is a rare event. However, AutoTriage does result in a substantial improvement of the PPV over commonly used prediction methods and the quality of AutoTriage predictions are further vetted by the strong diagnostic odds ratio (DOR). The DOR -- the ratio of the probability that a patient is predicted positive when they are positive to the probability that a patient is predicted positive when they are not -- increases to 16.26 for AutoTriage. The DOR is particularly important when evaluating prediction quality for mortality prediction, since it is not affected by the low prevalence of mortality, unlike the PPV. The accuracy of AutoTriage significantly improves over other methods, indicating overall improved metrics for mortality prediction 12 h in advance of mortality. In addition, compared to MEWS, AutoTriage is able to continuously maintain an alarm for patients in distress for substantially longer (Fig. 4).
The cutoff threshold for AutoTriage scores that was used to generate the tabulated performance metrics was chosen to maintain high sensitivity without inducing a high false alarm rate [21]. This was illustrated in Fig. 3 by comparing the score distribution of all patients with that of at-risk patients. To maximize specificity, a relatively small fraction of at-risk patients will go undetected 12-h pre-onset. However, for each hour that passes, these patients are increasingly detectable in our framework (Fig. 5).
Because AutoTriage utilizes only common, frequently measured patient clinical variables, we anticipate a more seamless real-time integration of the AutoTriage algorithm into a hospital's existing EHR system. This retrospective study has shown the efficacy of the predictive algorithm on banked patient data. However, in future work, we intend to test AutoTriage in a prospective validation study at multiple clinical sites. AutoTriage is designed to continuously sample and analyze patient measurement correlations automatically, and be able to alert clinicians to a deteriorating patient's state. In implementation, the algorithm can be trained on each unit's population for maximum accuracy, and the thresholds of alerts can be set to clinician's preferences in order to reduce alarm fatigue while maintaining meaningful vigilance over each patient's stability. This additional, automatically generated information of the correlations of clinical variables is intended to be a valuable contribution to the understanding of the patient's ongoing health trajectory.
Limitations of our study include a retrospective design and the use of a single center cohort. Our performance may be overestimated because the training and testing were executed on partitions of the same data set. In the future we would like to test the performance of the algorithm on data from different medical centers. Also in future studies we would like to validate the AutoTriage algorithm prospectively in multiple hospitals. Demographic and institutional differences could result in AutoTriage performance variability. Different measurements or missing data may affect performance. However, these differences can be handled by retraining the algorithm on a retrospective data set from each center prior to implementation in order to increase the effectiveness of predictions. Additionally, while this study required that patients have at least one observation of each measurement, preliminary tests indicate that our results are robust when faced with several of the measurements missing entirely, indicating potential flexibility in the data requirements. Together, these limitations call for future validation studies against demographically varied patient populations from different institutions.
AutoTriage leverages multidimensional analysis across diverse time-series inputs to provide earlier and more reliable warning of patient deterioration than existing scoring systems. These predictions are made using a sparse set of frequently measured and widely available patient measurements. While AutoTriage was used to identify at-risk patients, we believe that its underlying framework could be applied to the prediction of other patient outcomes and empower clinicians to respond more effectively to patients with impending critical conditions.
Ethical approval
None.
Sources of funding
This material is based upon work supported by the National Science Foundation under Grant No. 1549867. The funder had no role in the conduct of the study; collection, management, analysis, and interpretation of data; preparation, review, and approval of the manuscript; and decision to submit the manuscript for publication.
Author contribution
Jake Calvert, Thomas Desautels: Study design, data collection, data analysis, writing.
Uli Chettipally, Study design, review.
Jana Hoffman: Study design, writing.
Melissa Jay, Qingqing Mao, Hamid Mohamadlou: Data collection, data analysis.
Ritankar Das: Study design, editing.
Conflicts of interest
We declare no conflicts of interest.
Guarantor
Ritankar Das.
List of abbreviations
- AUROC
Area Under Receiver Operating Characteristic
- BIDMC
Beth Israel Deaconess Medical Center
- CDSS
Clinical Decision Support Systems
- DOR
Diagnostic Odds Ratio
- EHR
Electronic Health Records
- GCS
Glasgow Coma Score
- HIPAA
Health Insurance Portability and Accountability Act
- ICU
Intensive Care Unit
- MATLAB
Matrix Laboratory numerical computing environment
- MEWS
Modified Early Warning Score
- MICU
Medical Intensive Care Unit
- MIMIC III
Multiparameter Intelligent Monitoring in Intensive Care version III
- NPV
Negative Predictive Value
- PPV
Positive Predictive Value
- qSOFA
quick Sequential Organ Failure Assessment
- ROC
Receiver Operating Characteristic
- SAPS II
Simplified Acute Physiology Score II
- SIRS
Systemic Inflammatory Response Syndrome
- SOFA
Sequential Organ Failure Assessment
- SpO2
Peripheral Capillary Oxygen Saturation
- WBC
White Blood Cell count
Footnotes
Supplementary data related to this article can be found at http://dx.doi.org/10.1016/j.amsu.2016.09.002.
Appendix A. Supplementary data
The following is the supplementary data related to this article:
References
- 1.Karandeep S., Wright A. Clinical decision support. In: Finnell J.T., Dixon B.E., editors. Clinical Informatics Study Guide. Springer International Publishing; 2016. pp. 111–133. ISBN:978-3-319-22752-8 (Print) 978-3-319-22753-5 (Online) [Google Scholar]
- 2.Siontis G.C., Tzoulaki I., Ioannidis J.P. Predicting death: an empirical evaluation of predictive tools for mortality. Arch. Intern. Med. 2011;171(19):1721–1726. doi: 10.1001/archinternmed.2011.334. PMID:21788535. [DOI] [PubMed] [Google Scholar]
- 3.Reini K., Fredrikson M., Oscarsson A. The prognostic value of the Modified Early Warning Score in critically ill patients: a prospective, observational study. Eur. J. Anaesthesiol. 2012;29(3):152–157. doi: 10.1097/EJA.0b013e32835032d8. PMID:22273831. [DOI] [PubMed] [Google Scholar]
- 4.Khazaei H., McGregor C., Eklund J.M., El-Khatib K. Real-time and retrospective health-analytics-as-a-service: a novel framework. JMIR Med. Inf. 2015;3(4) doi: 10.2196/medinform.4640. PMID:26582268. [DOI] [PMC free article] [PubMed] [Google Scholar]
- 5.Subbe C., Slater A., Menon D., Gemmell L. Validation of physiological scoring systems in the accident and emergency department. Emerg. Med. J. 2006;23(11):841–845. doi: 10.1136/emj.2006.035816. PMID:17057134. [DOI] [PMC free article] [PubMed] [Google Scholar]
- 6.Vincent J., Moreno R., Takala J., Willatts S., De Mendonça A., Bruining H., Reinhart C.K., Suter P.M., Thijs L.G. The SOFA (Sepsis-related Organ Failure Assessment) score to describe organ dysfunction/failure. Intensive Care Med. 1996;22(7):707–710. doi: 10.1007/BF01709751. PMID:8844239. [DOI] [PubMed] [Google Scholar]
- 7.Le Gall J.R., Lemeshow S., Saulnier F. A new simplified acute physiology score (SAPS II) based on a European/North American multicenter study. JAMA. 1993;270(24):2957–2963. doi: 10.1001/jama.270.24.2957. PMID:8254858. [DOI] [PubMed] [Google Scholar]
- 8.Celi LA, Zimolzak AJ, Stone DJ. Dynamic clinical data mining: search engine-based decision support. JMIR Med. Inf., 2(1), e13. PMID:25600664. [DOI] [PMC free article] [PubMed]
- 9.Lehman L.W., Adams R.P., Mayaud L., Moody G.B., Malhotra A., Mark R.G., Nemati S. A physiological time series dynamics-based approach to patient monitoring and outcome prediction. IEEE J. Biomed. Health Inf. 2015;19(3):1068–1076. doi: 10.1109/JBHI.2014.2330827. PMID:25014976. [DOI] [PMC free article] [PubMed] [Google Scholar]
- 10.Ghose S, Mitra J, Khanna S, Dowling J. An Improved Patient-Specific Mortality Risk Prediction in ICU in a Random Forest Classification Framework. Driving Reform: Digital health is Everyone's business: Selected Papers from the 23rd Australian National Health Informatics Conference (HIC 2015). IOS Press. PMID:26210418. [PubMed]
- 11.Pirracchio R., Petersen M.L., Carone M., Rigon M.R., Chevret S., van der Laan M.J. Mortality prediction in intensive care units with the Super ICU Learner Algorithm (SICULA): a population-based study. Lancet Respir. Med. 2015;3(1):42–52. doi: 10.1016/S2213-2600(14)70239-5. PMID:25466337. [DOI] [PMC free article] [PubMed] [Google Scholar]
- 12.Moskovitch R., Walsh C., Wang F., Hripcsak G., Tatonetti N. IEEE International Conference on Data Mining (ICDM) 2015. Outcomes prediction via time intervals related patterns; pp. 919–924. [Google Scholar]
- 13.Johnson A.E., Pollard T.J., Shen L., Lehman L.W., Feng M., Ghassemi M., Moody B., Szolovits P., Celi L.A., Mark R.G. MIMIC-III, a freely accessible critical care database. Sci. Data. 2016 May 24;3:160035. doi: 10.1038/sdata.2016.35. PubMed PMID: 27219127; PubMed Central PMCID: PMC4878278. [DOI] [PMC free article] [PubMed] [Google Scholar]
- 14.Calvert J.S., Price D.A., Barton C.W., Chettipally U.K., Das R. Discharge recommendation based on a novel technique of homeostatic analysis. J. Am. Med. Inf. Assoc. 2016:ocw014. doi: 10.1093/jamia/ocw014. PMID: 27026611. [DOI] [PMC free article] [PubMed] [Google Scholar]
- 15.Calvert J.S., Mao Q., Rogers A.J., Barton C., Jay M., Desautels T., Mohamadlou H., Jan J., Das R. A computational approach to mortality prediction of alcohol use disorder inpatients. Comput. Biol. Med. 2016 Aug 1;75:74–79. doi: 10.1016/j.compbiomed.2016.05.015. PMID: 27253619. [DOI] [PubMed] [Google Scholar]
- 16.https://github.com/MIT-LCP/mimic-code. Archived at: http://www.webcitation.org/6ffJC48Mj.
- 17.Rapsang A.G., Shyam D.C. Scoring systems in the intensive care unit: a compendium. Indian J. Crit. Care Med. Peer-reviewed, Off. Publ. Indian Soc. Crit. Care Med. 2014;18(4):220–228. doi: 10.4103/0972-5229.130573. PMC. Web. 3 Aug. 2016. PMID: 24872651. [DOI] [PMC free article] [PubMed] [Google Scholar]
- 18.Sekulic A.D., Trpkovic S.V., Pavlovic A.P., Marinkovic O.M., Ilic A.N. Scoring systems in assessing survival of critically ill ICU patients. Med. Sci. Monit. Int. Med. J. Exp. Clin. Res. 2015;21:2621. doi: 10.12659/MSM.894153. PMID: 26336861. [DOI] [PMC free article] [PubMed] [Google Scholar]
- 19.Calvert J.S., Price D.A., Chettipally U.K., Barton C.W., Feldman M.D., Hoffman J.L. A computational approach to early sepsis detection. Comput. Biol. Med. 2016;74:69–73. doi: 10.1016/j.compbiomed.2016.05.003. PMID: 27208704. [DOI] [PubMed] [Google Scholar]
- 20.Calvert J., Desautels T., Chettipally U., Barton C., Hoffman J., Jay M., Mao Q., Mohamadlou H., Das R. High-performance detection and early prediction of septic shock for alcohol-use disorder patients. Ann. Med. Surg. 2016 May 10;8:50–55. doi: 10.1016/j.amsu.2016.04.023. eCollection 2016 Jun. PubMed PMID: 27489621; PubMed Central PMCID: PMC4960347. [DOI] [PMC free article] [PubMed] [Google Scholar]
- 21.Roshanov P.S., Fernandes N., Wilczynski J.M., Hemens B.J., You J.J., Handler S.M., Nieuwlaat R., Souza N.M., Beyene J., Van Spall H.G., Garg A.X., Haynes R.B. Features of effective computerised clinical decision support systems: meta-regression of 162 randomised trials. BMJ. 2013;346:f657. doi: 10.1136/bmj.f657. PMID:23412440. [DOI] [PubMed] [Google Scholar]
Associated Data
This section collects any data citations, data availability statements, or supplementary materials included in this article.