Figure 6.
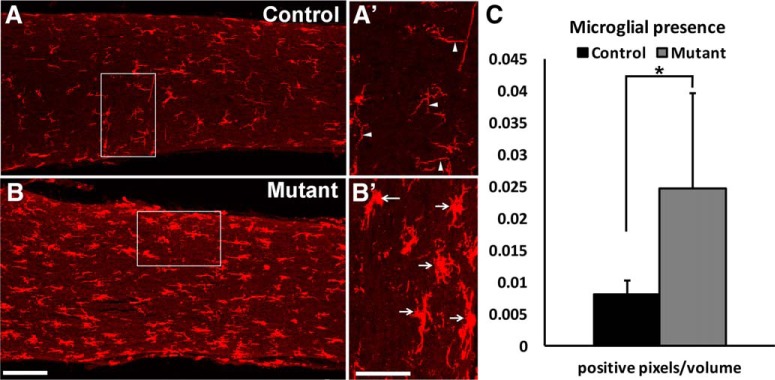
Activation of microglia was observed in the Ikbkap CKO optic nerves. Maximum-intensity z-stack projections of longitudinal optic nerve sections were stained with microglial/macrophage marker Iba1 in 9-month control (A) and mutant (B) optic nerves. Representative images are shown. Microglia in control optic nerves had thin ramified branches (arrowheads in Aʹ inset); microglia in mutant optic nerves had ameboid morphology (arrows in Bʹ) indicative of inflammatory response. White boxes in A and B indicate areas imaged at higher magnification in Aʹ and Bʹ, respectively. (C) The number of Iba1-positive pixels that met the criteria was counted and divided by the total number of pixels in the volume of the area, as described in Materials and Methods. The data show that mutant microglia occupied increased areas in the optic nerve, suggesting the presence of inflammatory response. *p = 0.05 with a two-tailed t-test (n = 6 for control and n = 5 for mutant). Scale bars, 100 μm (A and B) and 50 μm (Aʹ and Bʹ).

