Abstract
The water flea Daphnia are planktonic crustaceans commonly found in freshwater environment that can switch their reproduction mode from parthenogenesis to sexual reproduction to adapt to the external environment. As such, Daphnia are great model organisms to study the mechanism of reproductive switching, the underlying mechanism of reproduction and development in cladocerans and other animals. However, little is known about the Daphnia’s reproductive behaviour at a molecular level. We constructed a genetic database of the genes expressed in a sexual female (SF) and a parthenogenetic female (PF) of D. similoides using Illumina HiSeq 2500. A total of 1,763 differentially expressed genes (865 up- and 898 down-regulated) were detected in SF. Of the top 30 up-regulated SF unigenes, the top 4 unigenes belonged to the Chitin_bind_4 family. In contrast, of the top down-regulated SF unigenes, the top 3 unigenes belonged to the Vitellogenin_N family. This is the first study to indicate genes that may have a crucial role in reproductive switching of D. similoides, which could be used as candidate genes for further functional studies. Thus, this study provides a rich resource for investigation and elucidation of reproductive switching in D. similoides.
The water flea Daphnia are planktonic crustaceans commonly found in freshwater environments. They are sensitive to environmental changes and are a primary food source for fish and other invertebrate predators, thus playing a key role in aquatic ecosystems1,2,3.
As a response to environmental stimuli, Daphnia can switch their reproduction mode from parthenogenesis to sexual reproduction. This unique reproductive strategy includes two stages: they produce clonal female offspring by parthenogenesis under normal conditions; and in response to certain unfavourable environmental and biological factors, such as shortened daylight, low temperature, overpopulation, and lack of nutrients, they can switch to sexual reproduction and produce male offspring4,5,6,7,8,9. Barton’s studies showed that sexual reproduction leads to an increase in genetic diversity and survival rate, while parthenogenesis contributes to rapid propagation during favourable seasons10. These findings indicate that both different reproductive tissues (for ovarian development and breeding of offspring) and chemosensory tissues (for chemosensation of environmental changes such as temperate, food, population density, and so on) may be involved in reproductive switching of Daphnia. Hence, Daphnia is a great model organism for studying the mechanism of reproductive switching in cladocerans and other animals. However, very little is known about the molecular processes involved in Daphnia’s reproductive behaviour.
To thoroughly explore the mechanisms of reproductive switching, molecular identification, differential expression analysis in sexual females (SF) and parthenogenetic females (PF), as well as functional analyses of genes related to reproductive switching are the primary steps that should be performed. RNA-seq is considered to be a timesaving, cost effective, and highly efficient method, which has been used lately in large-scale studies identifying target genes in Daphnia and other invertebrates whose genomes have not been sequenced11,12,13,14,15.
The aim of the present study was to construct a genetic database of genes expressed in SF and PF of D. similoides and thus provide a rich resource of data for investigation and elucidation of reproductive switching in D. similoides. We further identified reproductive switching-related genes by comparing the transcriptome sequencing data and, as the first step toward understanding the physiological processes involved in reproductive switching, conducted a comparative analysis of differentially expressed genes (DEGs) and identified a set of up-regulated and down-regulated genes in SF and PF.
Results
Transcriptome sequencing and sequence assembly
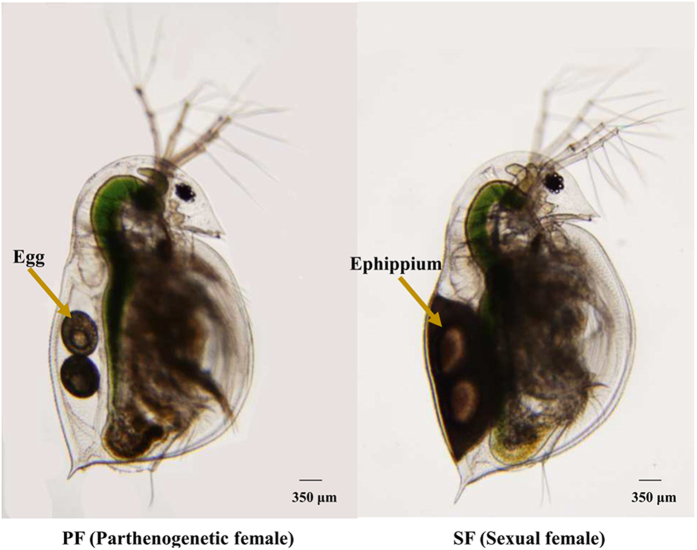
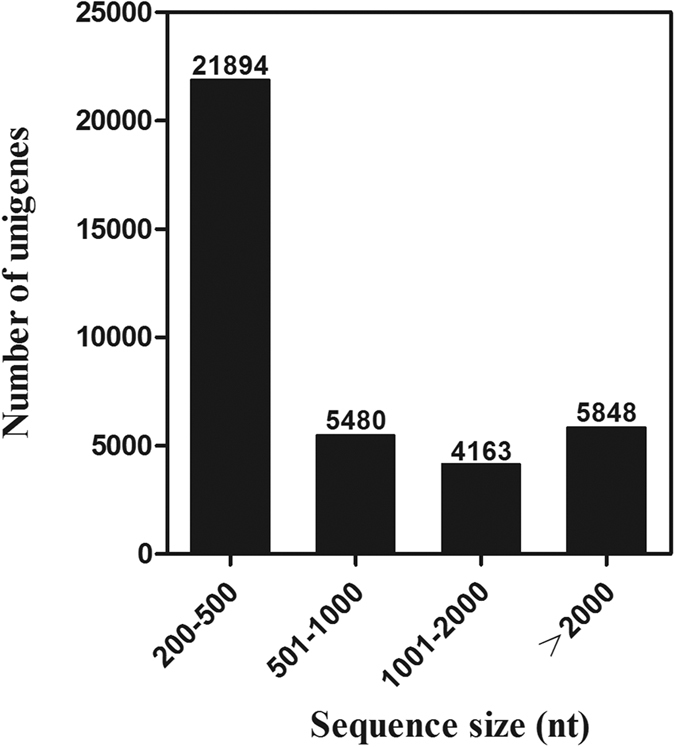
We carried out a next-generation sequencing project on a cDNA library constructed from D. similoides (Fig. 1) using an Illumina HiSeq™ 2500 platform. Low quality raw reads and reads with adapters and N content of more than 10% were excluded. The number of clean reads obtained from SF and PF of D. similoides was 62,395,405 and 52,037,554, respectively. All clean reads were assembled into transcripts by Trinity software; the longest copy of redundant transcripts was regarded a unigene16,17. In total, 61,047 transcripts were obtained and assembled into 37,385 unigenes. Of the 37,385 unigenes, those with a sequence length more than 500 bp accounted for 41.43% of the transcriptome assembly (Fig. 2). All the clean reads of SF and PF are deposited and available from the NCBI/SRA data base (SRA experiment accession number: PF: SRX1645097, SF: SRX1645182).
Figure 1. The photograph of D. similoides female.
Figure 2. Distribution of unigene size in the D. similoides transcriptome assembly.
Homology analysis and gene ontology annotation
Among the 37,385 unigenes, 13,072 were matched by the BLASTX homology search to the entries in NCBI non-redundant (Nr) protein database with a cut-off E-value of 10−5. The highest percentage of matching bases (88.30%) was to the D. pulex sequences, followed by the sequences of Zootermopsis nevadensis (0.80%), D. magna (0.60%), Tribolium castaneum (0.50%), and Trichuris suis (0.40%) (Fig. 3).
Figure 3. Percentage of homologous hits of the D. similoides transcripts to other species.
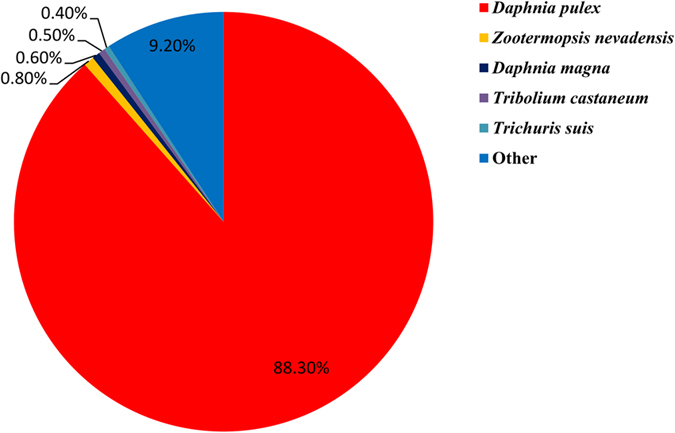
The D. similoides transcripts were searched by Blastx against the non-redundancy protein database with a cutoff E-value 10−5.
The gene ontology (GO) annotation was used to classify the transcripts into functional groups according to the GO category. Of 37,385 unigenes, 12,113 (32.40%) were annotated based on sequence homology. In the molecular function category, the genes expressed in SF and PF were mostly enriched to binding, catalytic activity, and transporter activity. In the biological process category, the cellular, metabolic, and single-organism processes were the most represented. In the cellular component category, the cell, cell part, and organelle were the most abundant (Supplementary Fig. S1).
Differentially expressed genes
DEGs were selected by RSEM with conditions of log2 fold change > 1 and q-value < 0.00518. The number of unigenes with RPKM > 0.3 expressed specifically in SF or PF was 9,543 and 2,832, respectively, and 22,703 unigenes were common in both SF and PF (Fig. 4). In the comparative analysis, 865 and 898 unigenes in SF were expressed at significantly higher and lower levels, respectively, compared to those in PF (Fig. 5).
Figure 4. Venn diagram of the number of unigenes with reads per kilo bases per million mapped (RPKM) > 0.3 in SF and PF.
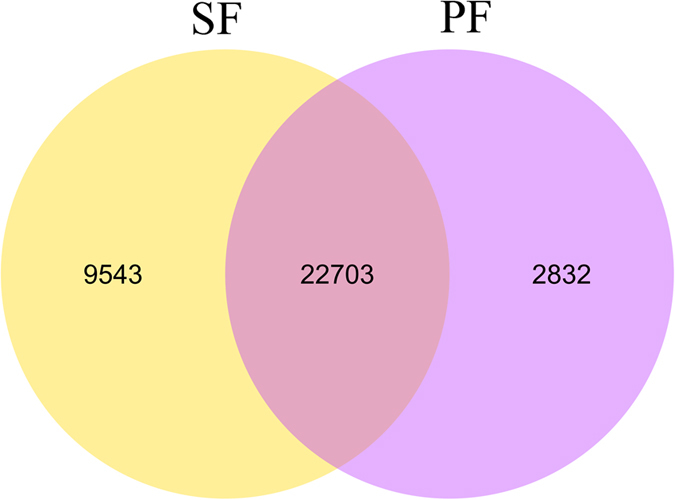
SF: sexual female, PF: parthenogenetic female.
Figure 5. Volcano plot of differentially expressed genes in SF and PF.
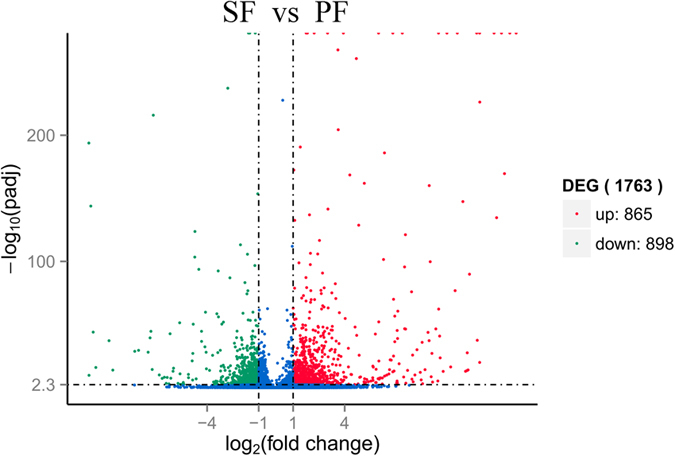
Differentially expressed genes were selected by q-value < 0.005&|log2 (fold change)|> 1 according the method of Storey et al.18. The x-axis shows the fold change in gene expression between SF and PF, and the y-axis shows the statistical significance of the differences. Splashes represent different genes. Blue splashes means genes without significant different expression. Red splashes means significantly up expressed genes. Green splashes means significantly down expressed genes. SF: sexual female, PF: parthenogenetic female, −log10(padj): the corrected p-value.
GO enrichment analysis
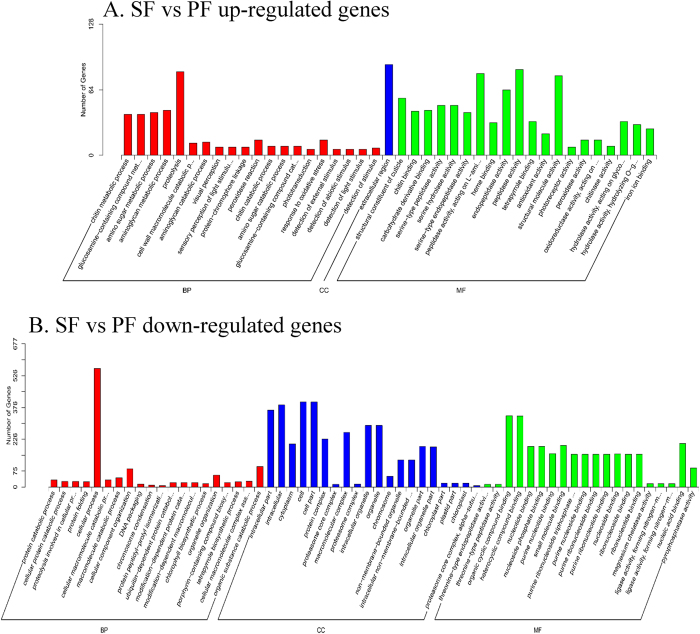
To compare the functions of these DEGs in SF and PF, we conducted GO enrichment analysis of the identified 1,763 DEGs with the threshold value for corrected P < 0.05 (Fig. 6). The results of the GO enrichment analysis showed that all up-regulated genes (SF vs. PF) were mostly enriched in the extracellular region, peptidase activity, proteolysis, structural molecule activity, and endopeptidase activity GO processes. However, all down-regulated (SF vs. PF) genes were mostly enriched in the cellular process, cell, cell part, intracellular part, and organic cyclic compound binding GO processes.
Figure 6. GO enrichment analysis of differentially expressed genes in SF and PF.
BP: Biological Process, MF: Molecular Function, CC: Cellular Component, SF: sexual female, PF: parthenogenetic female. (A) SF vs PF up-regulated genes; (B) SF vs PF down-regulated genes.
Reproductive switching-related genes
To better understand the mechanism of reproductive switching in D. similoides, we compared the SF and PF transcriptomes and identified 30 of the most differentially (based on the q-value) up-regulated and down-regulated unigenes from SF (Table 1 and Supplementary Table S1 available). Of the top 30 up-regulated SF unigenes, 4 unigenes (gene order: 1, 3, 4, and 14) belonged to the Chitin_bind_4 family, 10 were unknown functional unigenes, and the rest of the unigenes might have participated in the defence, digestion, enzyme metabolism, redox reactions, and transmission of nerve signals. In contrast, of the top down-regulated SF unigenes, 3 unigenes (gene order 1, 2, and 3) belonged to the Vitellogenin_N family, 10 were unknown functional unigenes, and the rest of the unigenes might have been involved in cell growth, differentiation, defence, and regulation of signals.
Table 1. The top 30 differentially expressed genes in sexual females (SF) vs. parthenogenetic females (PF).
| Up-regulated |
Down-regulated |
||||
|---|---|---|---|---|---|
| Gene ID | PFAM Description | q-value | Gene ID | PFAM Description | q-value |
| c22292_g2 | Chitin_bind_4 | 0 | c22798_g1 | Vitellogenin_N | 0 |
| c18268_g1 | Leucine Rich Repeat | 0 | c23345_g1 | Vitellogenin_N | 0 |
| c36850_g1 | Chitin_bind_4 | 0 | c23476_g2 | Vitellogenin_N | 0 |
| c22292_g1 | Chitin_bind_4 | 0 | c18434_g2 | Chitin_bind_4 | 5.189E-238 |
| c13553_g1 | unknown | 0 | c16077_g1 | unknown | 1.327E-216 |
| c13267_g1 | unknown | 0 | c2265_g1 | unknown | 1.606E-194 |
| c14229_g1 | unknown | 0 | c20736_g1 | Tubulin_C | 2.782E-154 |
| c20567_g1 | 7tm_1 | 0 | c16114_g1 | unknown | 1.474E-144 |
| c1950_g1 | unknown | 0 | c21178_g1 | Endoribonuclease XendoU | 1.992E-124 |
| c11892_g1 | Defensin propeptide | 0 | c15033_g1 | unknown | 6.966E-114 |
| c7151_g1 | Ferritin | 0 | c16911_g1 | Reticulon | 2.035E-106 |
| c19046_g2 | unknown | 0 | c21985_g2 | Animal haem peroxidase | 3.889E-104 |
| c16684_g1 | SecA DEAD-like domain | 0 | c16323_g1 | Tubulin_C | 1.9075E-97 |
| c21753_g2 | Chitin_bind_4 | 0 | c14544_g1 | unknown | 2.0145E-94 |
| c22095_g1 | FHb-globin | 0 | c31684_g1 | unknown | 3.7586E-93 |
| c18106_g2 | unknown | 0 | c9802_g1 | Caveolin | 1.072E-87 |
| c22854_g1 | Animal haem peroxidase | 0 | c31718_g1 | Lectin C-type domain | 6.5101E-84 |
| c20987_g1 | Short chain dehydrogenase | 2.35E-268 | c13264_g1 | TCP-1/cpn60 chaperonin family | 1.8185E-77 |
| c23239_g2 | Pyridoxal-dependent decarboxylase conserved domain | 1.76E-261 | c31673_g1 | HMG-box domain | 5.4632E-75 |
| c8533_g1 | unknown | 5.34E-227 | c22501_g1 | SPRY domain | 1.7373E-60 |
| c17941_g1 | unknown | 4.32E-205 | c23556_g2 | unknown | 1.8503E-60 |
| c17991_g3 | Trypsin | 2.27E-191 | c16151_g1 | Rapamycin-insensitive companion of mTOR | 1.2664E-59 |
| c20854_g1 | Kazal | 9.92E-187 | c16413_g2 | unknown | 3.332E-59 |
| c19171_g1 | DEAD | 3.94E-173 | c12941_g1 | unknown | 9.6416E-57 |
| c20224_g1 | Fasciclin | 2.78E-170 | c19155_g1 | Innexin | 2.5575E-54 |
| c22933_g1 | Animal haem peroxidase | 3.2E-169 | c16110_g1 | unknown | 4.416E-54 |
| c23017_g1 | Ligand-gated ion channel | 1.3E-162 | c9752_g1 | Tubulin_C | 5.821E-54 |
| c19046_g1 | unknown | 8.23E-161 | c15362_g1 | Protein of unknown function (DUF1075) | 1.3176E-52 |
| c16960_g1 | unknown | 3.91E-148 | c13754_g1 | Trypsin | 4.4932E-52 |
| c3162_g1 | Cysteine-rich secretory protein family | 3.38E-142 | c16548_g1 | Chitin binding Peritrophin-A domain | 5.1991E-51 |
Validation of transcriptome data by qPCR
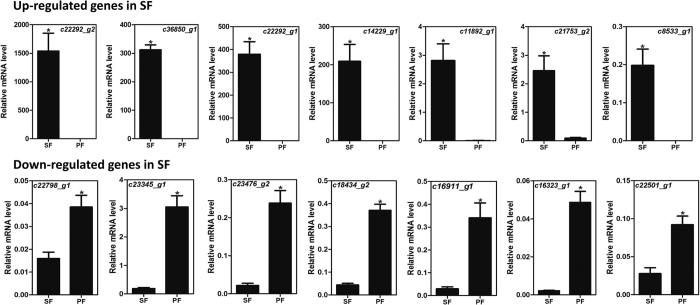
In order to validate the transcriptome results, we randomly selected 14 significant DEGs from Table 1 for quantitative real-time PCR (qPCR) conformation. The primers used for qPCR are shown in Supplementary Table S2 available. The results of the qPCR were consistent with the RNA-seq data (Fig. 7).
Figure 7. qPCR results of differentially expressed genes in SF and PF.
SF: sexual female, PF: parthenogenetic female. The relative expression level is indicated as mean ± SE (N = 3). “*” Means significant difference between SF and PF (P < 0.05, Student t-test).
Discussion
Daphnia undergo parthenogenesis in suitable environments, forming a large population, while they enter sexual reproduction under unfavourable conditions, producing fertilised eggs2,10,19. However, studies that explore reproductive switching in Daphnia at molecular level are scarce or non-comprehensive, so more data was a research priority for investigating the mechanism in this genus. In the present study, we used comparative transcriptome analysis to investigate the differences in gene expression of D. similoides and identify those that are involved in reproductive switching.
We carried out the transcriptome de novo assembly with short reads because of the lack of D. similoides genome sequences. In this study, the N50 of the unigenes were 2,685 bp long, much longer than those reported in other studies20,21, suggesting high quality sequencing and assembly. Among the 37,385 unigenes identified, only 34.96% gene translations shared significant similarity with entries in the NCBI Nr protein database, indicating that large numbers of the unigenes were either non-coding or specific to D. similoides. Additionally, we found that D. similoides shared highest similarity with D. pulex, 88.30% of sequence similarity, indicating a relatively close phylogenetic relationship between these two species of Daphnia.
By comparing the differences in gene expressions in SF and PF of D. similoides, we found that the number of genes expressed specifically in PF was greater than that in SF, suggesting that there is a certain correlation between the development of egg chambers as well as embryos and these genes in PF22. Remarkably, up-regulated and down-regulated genes of D. similoides (SF vs. PF) had different GO enrichment: extracellular region and peptidase activity were the most frequently enriched groups of up-regulated genes. The extracellular region refers to the space external to the outermost structure of the cell; it does not include gene products uniformly attached to the cell membrane. Since the reproduction in SF is sexual under unfavourable environmental and biological conditions19,23,24, the SF receives more stimuli from the external environments, such as perception of the temperature and interaction with the sperm, and resist better the unfavourable conditions compared to PF. Regarding the peptidase activity, some peptidase genes in D. pulex might have specific adaptations to the lifestyle of a planktonic filter feeder in a highly variable aquatic environment25. In addition, some studies in other animals showed that peptidases play key roles in reproduction; for example, peptidase 2-like gene (Immp2l) can impair fertility in mice26, and DmCatD is involved in the process of follicular atresia of Dipetalogaster maxima27, which suggests that certain peptidases in SF of D. similoides may have similar functions in the process of adaption to external environment and reproduction. In contrast, cellular and intracellular processes were the most frequently enriched groups of down-regulated genes. The development of an embryo from a female gamete without any contribution by a male gamete indicates that some genes involved in cellular and/or intracellular process (e.g., mutation, hybridisation, microbial infection, and genetic contagion) may be responsible for the transition from SF to PF28,29,30 and the development of reproductive organs22,31. Additionally, previous studies based on molecular biology showed that embryo-associated22 and meiosis-suppression genes24,32 play key roles in PF of Daphnia, and they belong to cellular and/or intracellular processes. Herein, we acknowledge the challenging nature of interpreting the SF/PF up- regulated GO terms. Nonetheless, these GO terms can be broadly associated with morphological plasticity of D. similoides and may participate in the reproductive switching between SF and PF.
The PFAM annotation of up-regulated and down-regulated unigenes of SF vs. PF identified two gene families, the Chitin_bind_4 and Vitellogenin_N families, that were more differentially expressed compared to other genes in SF and PF, respectively. The Chitin_bind_gene family is associated with the cuticle in cladoceran33 and other invertebrates34,35. The cladoceran cuticle consists of proteins and chitin and can withstand adverse conditions of the external environment33,36,37. Therefore, the up-regulated expression of cuticle-related genes in SF may help D. similoides undergo a series of corresponding changes in cuticle structure as a response to adverse external environment conditions. In contrast, the genes belonging to Vitellogenin_N family play a key role in the formation of yolk proteins in cladoceran crustaceans38,39,40 and help to ensure normal development of the embryo. Previous results41 and the results presented herein indicate that some genes from the up-regulated Vitellogenin_N family in PF participate in the process of ovarian development of D. similoides. Other DEGs in SF vs. PF may have different functions in sexual reproduction and parthenogenesis, which warrant further studies along with integrated functional studies.
Conclusions
In conclusion, we identified genes related to reproductive switching by comparing transcriptome sequencing data from SF and PF of D. similoides. Our findings suggest that some DEGs are similar to those reported for other Daphnia species, which in turn indicates that functional requirements in Daphnia are conserved. Thus, these DEGs could be used to study the molecular evolution in Daphnia. Our results will not only provide indispensable contributions to the studies of reproductive and evolutionary biology in Daphnia but they can also be used as a model to study other cladocerans.
Methods
Sample preparation
D. similoides was originally obtained from the Lake Chaohu in Anhui Province, China. The field studies did not involve endangered or protected species, and no specific permissions were required for these research activities in these locations. Healthy parthenogenetic organisms were identified and cultivated by a monoclonal method in our laboratory. Briefly, under optimal environmental conditions, the eggs produced by the adult female of D. similoides, although not fertilised with sperm, developed directly into juveniles. Such adult females were regarded parthenogenetic females. With worsening of the environmental conditions (such as high population density and food deficiency), some eggs produced by the parthenogenetic females of D. similoides developed into males, while others developed into females, among which then mated with the males. Such adult females that mated and produced ephippia or resting eggs were regarded as sexual females. Usually, the ephippia were observed on the dorsa of sexual females (Fig. 1). D. similoides was incubated at 25 °C, under a 12-h light (2500LX)/12-h dark photoperiod, and fed Scenedesmus obliquus for 3–4 weeks. As a result of the particular reproductive behaviour in cladocerans, when population density reached certain level, reproductive switching occurred. We selected and confirmed different developmental stages of the offspring using an OLYMPUS CX21FS1 microscope (OLYMPUS, Tokyo, Japan). Fifty virgin SF and 50 mature PF were collected for transcriptome sequencing. All samples were immediately frozen in liquid nitrogen and stored at −80 °C until use.
cDNA library construction
Total RNA was extracted using a TRIzol reagent (Invitrogen, Carlsbad, CA, USA), and cDNA library construction and Illumina sequencing of the samples were performed at Novogene Bioinformatics Technology Co., Ltd., Beijing, China. The mRNA was purified from 3 μg of total RNA using oligo (dT) magnetic beads and fragmented into short sequences in the presence of divalent cations at 94 °C for 5 min. The first-strand cDNA was generated using random hexamer-primed reverse transcription, followed by synthesis of the second-strand cDNA using RNaseH and DNA polymerase I. After the end repair and ligation of adaptors, the products were amplified by PCR and purified using a QIAquick PCR Purification Kit (Qiagen, Valencia, CA, USA) to create a cDNA library; the library quality was assessed on an Agilent Bioanalyzer 2100 system (Santa Clara, CA, USA).
Clustering and sequencing
The clustering of the index-coded samples was performed on a cBot Cluster Generation System using TruSeq PE Cluster Kit v3-cBot-HS (Illumina, San Diego, CA, USA) according to the manufacturer’s instructions. After cluster generation, the library preparations were sequenced on an Illumina Hiseq 2500 platform and paired-end reads were generated.
De novo assembly of short reads and gene annotation
Clean short reads were obtained by removing reads containing adapters and ploy-N, as well as low quality reads from raw reads. Transcriptome de novo assembly was conducted with these short reads using assembling program Trinity (r20140413p1)42,43 with min_kmer_cov set to 2 and all other parameters set to default. The resulting sequences were named unigenes. The unigenes larger than 150 bp were first aligned by BLASTX against protein databases Nr, Swiss-Prot, KEGG, and COG (E-value < 10−5), retrieving proteins with the highest sequence similarity with the given unigenes along with their protein functional annotations. GO annotation of the unigenes was conducted using Blast2GO program44, and GO functional classification was carried out by using WEGO software45. The similarity searches of unigenes were performed by using the NCBI-BLAST network server (http://blast.ncbi.nlm.nih.gov/).
Expression abundance analysis of the unigenes
The expression abundance of the unigenes was calculated by the reads per kilobase per million mapped reads (RPKM) method46, using the formula: RPKM (A) = (1,000,000 × C × 1,000)/(N × L), where RPKM (A) is the expression abundance of gene A, C is the number of reads that are uniquely aligned to gene A, N is the total number of reads that are uniquely aligned to all genes, and L is the number of bases on gene A. The RPKM method eliminates the influence of different gene lengths and sequencing discrepancy on the calculation of expression abundance.
Differential expression and GO enrichment analysis
Differential expression analysis of two samples was performed using the DEGSeq (2010) package. P-value was adjusted using q-value, and the q-value < 0.005&|log 2 (fold change)|> 1 was set as the threshold for significant differential expression18. GO enrichment analysis of DEGs was implemented by the GOseq packages based on Wallenius’ non-central hyper-geometric distribution47, which can adjust for gene length bias in DEGs.
RNA isolation and cDNA synthesis
Total RNA was extracted by an SV 96 Total RNA Isolation System (Promega, Madison, WI, USA) following the manufacturer’s instructions, in which a DNaseI digestion was included to eliminate genomic DNA contamination. RNA quality was checked with a spectrophotometer (NanoDrop 2000, Thermo Fisher Scientific, Waltham, WI, USA). The single-stranded cDNA templates were synthesised from 1 μg of total RNA from various tissue samples using a PrimeScript™RT Master Mix (TaKaRa, Dalian, China).
Quantitative real time-PCR validation
The qPCR was performed on an ABI 7300 (Applied Biosystems, Foster City, CA, USA) using a mixture of 10 μL 2 × TransStart Top Green qPCR SuperMix (TransGen Biotech, Beijing, China), 0.4 μL of each primer (10 μM), 2.5 ng of sample cDNA, and 6.8 μL of sterilised ultrapure H2O. The reaction program consisted of an initial step for 30 s at 94 °C, followed by 40 cycles at 94 °C for 5 s and at 60 °C for 31 s. This was followed by the measurement of fluorescence during a 55 °C to 95 °C melting curve in order to detect a single gene-specific peak and to check for the absence of primer-dimer peaks; a single and discrete peak was detected for all primers tested. Negative controls were non-template reactions (cDNA was replaced with H2O). The results were analysed using the ABI 7300 analysis software SDS 1.4. The qPCR primers (see Supplementary Table S2) were designed using Beacon Designer 7.9 (PREMIER Biosoft International, Palo Alto, CA, USA).
Expression levels of these genes were calculated relative to two reference genes DsimGAPDH (glyceraldehyde-3-phosphate dehydrogenase) and DsimACT (actin) using the Q-Gene method in Microsoft Excel-based software Visual Basic48,49. Each sample comprised three biological replicates and each biological replicate was measured in three technical replicates.
Statistical analysis
Two-sample analysis of the data (mean ± SE) was performed by the Student’s t-test for the mean comparison using SPSS 17.0 software (SPSS Inc., Chicago, IL, USA).
Additional Information
How to cite this article: Zhang, Y.-N. et al. Reproductive switching analysis of Daphnia similoides between sexual female and parthenogenetic female by transcriptome comparison. Sci. Rep. 6, 34241; doi: 10.1038/srep34241 (2016).
Supplementary Material
Acknowledgments
We thank Bachelor students Zhi-Qiang Wang and Geng Chen (Huaibei Normal University, China) for help collecting samples. This work was supported by grants from the National Natural Science Foundation (No. 31370470) of China.
Footnotes
Author Contributions Y.-N.Z. and D.-G.D. conceived and designed the experimental plan. W.-P.W., Y.W., L.W., X.-X.X. and K.Z. preformed the experiments. Y.-N.Z., X.-Y.Z. and D.-G.D. analyzed and interpreted the sequence data. Y.-N.Z. and D.-G.D. drafted the manuscript. All authors read and approved the final manuscript.
References
- Watanabe H. et al. Analysis of expressed sequence tags of the water flea Daphnia magna. Genome 48, 606–609, g05-03810.1139/g05-038 (2005). [DOI] [PubMed] [Google Scholar]
- Eads B. D., Andrews J. & Colbourne J. K. Ecological genomics in Daphnia: stress responses and environmental sex determination. Heredity (Edinb) 100, 184–190, 10.1038/sj.hdy.6800999 (2008). [DOI] [PubMed] [Google Scholar]
- Colbourne J. K. et al. The ecoresponsive genome of Daphnia pulex. Science 331, 555–561, 10.1126/science.1197761331/6017/555 (2011). [DOI] [PMC free article] [PubMed] [Google Scholar]
- Hebert P. D. N. Population biology of Daphnia (Crustacea, Daphnidae) Biol. Rev. 53, 387–426 (1978). [Google Scholar]
- Banta A. M. & Brown L. A. Control of sex in cladocera. II. The unstable nature of 618 the excretory products involved in male production Physiol. Zool. 2, 93–98 (1929). [Google Scholar]
- Kato Y., Kobayashi K., Watanabe H. & Iguchi T. Environmental sex determination in the branchiopod crustacean Daphnia magna: deep conservation of a Doublesex gene in the sex-determining pathway. PLoS Genet. 7, e1001345, 10.1371/journal.pgen.1001345 (2011). [DOI] [PMC free article] [PubMed] [Google Scholar]
- Baer K. N. & Owens K. D. Evaluation of selected endocrine disrupting compounds on sex determination in Daphnia magna using reduced photoperiod and different feeding rates. B. Environ. Contam. Tox. 62, 214–221 (1999). [DOI] [PubMed] [Google Scholar]
- K. K. O. & A. H. Sexual reproduction in Daphnia magna requires three 694 stimuli. Oikos 65, 197–206 (1992). [Google Scholar]
- La G. H. et al. Mating behavior of Daphnia: impacts of predation risk, food quantity, and reproductive phase of females. PLoS One 9, e104545, 10.1371/journal.pone.0104545PONE-D-14-10433 (2014). [DOI] [PMC free article] [PubMed] [Google Scholar]
- Barton N. H. & Charlesworth B. Why sex and recombination? Science 281, 1986–1990 (1998). [PubMed] [Google Scholar]
- Rozenberg A. et al. Transcriptional profiling of predator-induced phenotypic plasticity in Daphnia pulex. Front. Zool. 12, 1–13, 10.1186/s12983-015-0109-x (2015). [DOI] [PMC free article] [PubMed] [Google Scholar]
- McTaggart S. J., Cezard T., Garbutt J. S., Wilson P. J. & Little T. J. Transcriptome profiling during a natural host-parasite interaction. BMC Genomics 16, 1–9, 10.1186/s12864-015-1838-0 (2015). [DOI] [PMC free article] [PubMed] [Google Scholar]
- Zhang Y. N. et al. Differential expression patterns in chemosensory and non-chemosensory tissues of putative chemosensory genes identified by transcriptome analysis of insect pest the purple stem borer Sesamia inferens (Walker). PLoS One 8, e69715, 10.1371/journal.pone.0069715 (2013). [DOI] [PMC free article] [PubMed] [Google Scholar]
- Leitch O., Papanicolaou A., Lennard C., Kirkbride K. P. & Anderson A. Chemosensory genes identified in the antennal transcriptome of the blowfly Calliphora stygia. BMC Genomics 16, 1–17, 10.1186/s12864-015-1466-810.1186/s12864-015-1466-8 (2015). [DOI] [PMC free article] [PubMed] [Google Scholar]
- Zhang Y. K., Ding X. L., Rong X. & Hong X. Y. How do hosts react to endosymbionts? A new insight into the molecular mechanisms underlying the Wolbachia-host association. Insect Mol. Biol. 24, 1–12, 10.1111/imb.12128 (2014). [DOI] [PubMed] [Google Scholar]
- Grabherr M. G. et al. Full-length transcriptome assembly from RNA-Seq data without a reference genome. Nat. Biotechnol. 29, 644–652, 10.1038/nbt.1883 (2011). [DOI] [PMC free article] [PubMed] [Google Scholar]
- Haas B. J. et al. De novo transcript sequence reconstruction from RNA-seq using the Trinity platform for reference generation and analysis. Nat. Protoc. 8, 1494–1512, 10.1038/nprot.2013.084 (2013). [DOI] [PMC free article] [PubMed] [Google Scholar]
- Storey J. D. The positive false discovery rate: a Bayesian interpretation and the q-value. Ann. Stat. 31, 2013–2035 (2003). [Google Scholar]
- Xu X. et al. Analysis and comparison of a set of expressed sequence tags of the parthenogenetic water flea Daphnia carinata. Mol. Genet. Genomics 282, 197–203, 10.1007/s00438-009-0459-1 (2009). [DOI] [PubMed] [Google Scholar]
- Wang Z. L. et al. Transcriptome analysis of the asian honey bee Apis cerana cerana. PLoS One 7, e47954, 10.1371/journal.pone.0047954 (2012). [DOI] [PMC free article] [PubMed] [Google Scholar]
- Xue J. et al. Transcriptome analysis of the brown planthopper Nilaparvata lugens. PLoS One 5, e14233, 10.1371/journal.pone.0014233 (2010). [DOI] [PMC free article] [PubMed] [Google Scholar]
- Eads B. D., Colbourne J. K., Bohuski E. & Andrews J. Profiling sex-biased gene expression during parthenogenetic reproduction in Daphnia pulex. BMC Genomics 8, 1–13, 1471-2164-8-46410.1186/1471-2164-8-464 (2007). [DOI] [PMC free article] [PubMed] [Google Scholar]
- Roulin A. C. et al. Local adaptation of sex induction in a facultative sexual crustacean: insights from QTL mapping and natural populations of Daphnia magna. Mol. Ecol. 22, 3567–3579, 10.1111/mec.12308 (2013). [DOI] [PubMed] [Google Scholar]
- Innes D. J. & Ginn M. A population of sexual Daphnia pulex resists invasion by asexual clones. Proc. Biol. Sci. 281, 20140564–20140564, 10.1098/rspb.2014.0564 (2014). [DOI] [PMC free article] [PubMed] [Google Scholar]
- Schwerin S. et al. Acclimatory responses of the Daphnia pulex proteome to environmental changes. II. Chronic exposure to different temperatures (10 and 20 degrees C) mainly affects protein metabolism. BMC physiology 9, 8, 10.1186/1472-6793-9-8 (2009). [DOI] [PMC free article] [PubMed] [Google Scholar]
- Lu B. et al. A mutation in the inner mitochondrial membrane peptidase 2-like gene (Immp2l) affects mitochondrial function and impairs fertility in mice. Biol. Reprod. 78, 601–610, 10.1095/biolreprod.107.065987 (2008). [DOI] [PubMed] [Google Scholar]
- Leyria J., Fruttero L. L., Nazar M. & Canavoso L. E. The role of DmCatD, a cathepsin D-like peptidase, and acid phosphatase in the process of follicular atresia in Dipetalogaster maxima (Hemiptera: Reduviidae), a vector of chagas’ disease. PLoS One 10, e0130144, 10.1371/journal.pone.0130144 (2015). [DOI] [PMC free article] [PubMed] [Google Scholar]
- Simon J. C., Delmotte F., Rispe C. & Crease T. Phylogenetic relationships between parthenogens and their sexual relatives: the possible routes to parthenogenesis in animals. Biol. J. Linn. Soc. 79, 151–163 (2003). [Google Scholar]
- Maccari M., Amat F., Hontoria F. & Gomez A. Laboratory generation of new parthenogenetic lineages supports contagious parthenogenesis in Artemia. PeerJ 2, e439, 10.7717/peerj.439 (2014). [DOI] [PMC free article] [PubMed] [Google Scholar]
- Dedryver C. A., Le Gallic J. F., Maheo F., Simon J. C. & Dedryver F. The genetics of obligate parthenogenesis in an aphid species and its consequences for the maintenance of alternative reproductive modes. Heredity (Edinb) 110, 39–45, 10.1038/hdy.2012.57 (2013). [DOI] [PMC free article] [PubMed] [Google Scholar]
- Toyota K. et al. Methyl farnesoate synthesis is necessary for the environmental sex determination in the water flea Daphnia pulex. J. Insect Physiol. 80, 1566–1576, 10.1016/j.jinsphys.2015.02.002 (2015). [DOI] [PubMed] [Google Scholar]
- Tucker A. E., Ackerman M. S., Eads B. D., Xu S. & Lynch M. Population-genomic insights into the evolutionary origin and fate of obligately asexual Daphnia pulex. Proc. Natl. Acad. Sci. USA 110, 15740–15745, 10.1073/pnas.1313388110 (2013). [DOI] [PMC free article] [PubMed] [Google Scholar]
- Liu A. et al. Cloning and expression profiling of a cuticular protein gene in Daphnia carinata. Dev. Genes Evol. 224, 129–135, 10.1007/s00427-014-0469-9 (2014). [DOI] [PubMed] [Google Scholar]
- Papandreou N. C., Iconomidou V. A., Willis J. H. & Hamodrakas S. J. A possible structural model of members of the CPF family of cuticular proteins implicating binding to components other than chitin. J. Insect. Physiol. 56, 1420–1426, 10.1016/j.jinsphys.2010.04.002 (2010). [DOI] [PMC free article] [PubMed] [Google Scholar]
- Zhang J. & Pelletier Y. Characterization of cuticular chitin-binding proteins of Leptinotarsa decemlineata (Say) and post-ecdysial transcript levels at different developmental stages. Insect. Mol. Biol. 19, 517–525, 10.1111/j.1365-2583.2010.01011.x (2010). [DOI] [PubMed] [Google Scholar]
- Repka S., Walls M. & Ketola M. Neck spine protects Daphnia pulex from predation by Chaoborus, but individuals with longer tail spine are at a greater risk. J. Plankton Res. 17, 393–403 (1995). [Google Scholar]
- Tollrian R. Predator-induced morphological defenses: costs, life history shifts, and maternal effects in Daphnia pulex. Ecology 76, 1691–1705 (1995). [Google Scholar]
- Kato Y., Tokishita S. I., Ohta T. & Yamagata H. A vitellogenin chain containing a superoxide dismutase-like domain is the major component of yolk proteins in cladoceran crustacean Daphnia magna. Gene 334, 157–165, 10.1016/j.gene.2004.03.030 (2004). [DOI] [PubMed] [Google Scholar]
- Avarre J. C., Lubzens E. & Babin P. J. Apolipocrustacein, formerly vitellogenin, is the major egg yolk precursor in decapod crustaceans and is homologous to insect apolipophorin II/I and vertebrate apolipoprotein B. BMC Evol. Biol. 7, 103–109, 10.1186/1471-2148-7-3 (2007). [DOI] [PMC free article] [PubMed] [Google Scholar]
- Jeong S. W., Min Lee S., Yum S. S., Iguchi T. & Seo Y. R. Genomic expression responses toward bisphenol-A toxicity in Daphnia magna in terms of reproductive activity. Mol. Cell Toxicol. 9, 149–158, 10.1007/s13273-013-0019-y (2013). [DOI] [Google Scholar]
- Tokishita S. et al. Organization and repression by juvenile hormone of a vitellogenin gene cluster in the crustacean, Daphnia magna. Biochem. Biophys. Res. Commun. 345, 362–370, 10.1016/j.bbrc.2006.04.102 (2006). [DOI] [PubMed] [Google Scholar]
- Grabherr M. G. et al. Full-length transcriptome assembly from RNA-Seq data without a reference genome. Nat. Biotechnol. 29, 644–652, 10.1038/nbt.1883 (2011). [DOI] [PMC free article] [PubMed] [Google Scholar]
- Li R. et al. De novo assembly of human genomes with massively parallel short read sequencing. Genome Res. 20, 265–272, gr.097261.10910.1101/gr.097261.109 (2010). [DOI] [PMC free article] [PubMed] [Google Scholar]
- Conesa A. et al. Blast2GO: a universal tool for annotation, visualization and analysis in functional genomics research. Bioinformatics 21, 3674–3676, bti610 10.1093/bioinformatics/bti610 (2005). [DOI] [PubMed] [Google Scholar]
- Ye J. et al. WEGO: a web tool for plotting GO annotations. Nucleic Acids Res. 34, W293–W297, 34/suppl_2/W293 10.1093/nar/gkl031 (2006). [DOI] [PMC free article] [PubMed] [Google Scholar]
- Mortazavi A., Williams B. A., McCue K., Schaeffer L. & Wold B. Mapping and quantifying mammalian transcriptomes by RNA-Seq. Nat. Methods 5, 621–628, nmeth.1226 10.1038/nmeth.1226 (2008). [DOI] [PubMed] [Google Scholar]
- Young M. D., Wakefield M. J., Smyth G. K. & Oshlack A. Gene ontology analysis for RNA-seq: accounting for selection bias. Genome Biol. 11, R14, 10.1186/gb-2010-11-2-r14 (2010). [DOI] [PMC free article] [PubMed] [Google Scholar]
- Simon P. Q-Gene: processing quantitative real-time RT-PCR data. Bioinformatics 19, 1439–1440, 10.1093/bioinformatics/btg157 (2003). [DOI] [PubMed] [Google Scholar]
- Muller P. Y., Janovjak H., Miserez A. R. & Dobbie Z. Processing of gene expression data generated by quantitative real-time RT-PCR. Biotechniques 32, 1372–1374, 1376, 1378–1379 (2002). [PubMed] [Google Scholar]
Associated Data
This section collects any data citations, data availability statements, or supplementary materials included in this article.


