

Abstract
EDP-239, a novel hepatitis C virus (HCV) inhibitor targeting nonstructural protein 5A (NS5A), has been investigated in vitro and in vivo. EDP-239 is a potent, selective inhibitor with potency at picomolar to nanomolar concentrations against HCV genotypes 1 through 6. In the presence of human serum, the potency of EDP-239 was reduced by less than 4-fold. EDP-239 is additive to synergistic with other direct-acting antivirals (DAAs) or host-targeted antivirals (HTAs) in blocking HCV replication and suppresses the selection of resistance in vitro. Furthermore, EDP-239 retains potency against known DAA- or HTA-resistant variants, with half-maximal effective concentrations (EC50s) equivalent to those for the wild type. In a phase I, single-ascending-dose, placebo-controlled clinical trial, EDP-239 demonstrated excellent pharmacokinetic properties that supported once daily dosing. A single 100-mg dose of EDP-239 resulted in reductions in HCV genotype 1a viral RNA of >3 log10 IU/ml within the first 48 h after dosing and reductions in genotype 1b viral RNA of >4-log10 IU/ml within 96 h. (This study has been registered at ClinicalTrials.gov under identifier NCT01856426.)
INTRODUCTION
Chronic infection with the hepatitis C virus (HCV) is a major global health burden, infecting approximately 3.5 million individuals in the United States (1) and up to 150 million worldwide (2). HCV is estimated to infect approximately 3 to 4 million people each year, with a prevalence in the United States estimated at 1.3% (1) and prevalences as high as 22% in Egypt, 4.8% in Pakistan, and 3.2% in China (3). Chronic HCV infection can lead to cirrhosis of the liver and hepatocellular carcinoma, contributing to the deaths of 700,000 individuals each year (3).
HCV is an enveloped, single-stranded, positive-sense RNA virus in the family Flaviviridae. The ∼9.6-kb genome is translated into a single polyprotein that is subsequently processed into at least 10 structural and nonstructural proteins that are necessary for replication of viral RNA and assembly of new virions (4). At least six distinct HCV genotypes (GTs) and more than 50 subtypes have been characterized, with significant variability in their geographic distributions (5).
Within the past 5 years, treatment options for HCV infection have improved dramatically, with approvals from the U.S. Food and Drug Administration for sofosbuvir, ledipasvir, daclatasvir, ombitasvir, paritaprevir, dasabuvir, simeprevir, grazoprevir, and elbasvir. However, it is becoming apparent that differences in potency among the existing approved drugs against various HCV genotypes, as well as their associated resistant variants, demonstrate a clear unmet medical need for additional approved therapies. EDP-239, a small-molecule inhibitor targeting the nonstructural protein 5A (NS5A) of HCV, was designed to address this unmet need.
NS5A is a nonstructural HCV protein, with no known enzymatic activities, and is an essential component of the HCV replication complex (6). NS5A possesses RNA binding activity and is comprised of an amphipathic α-helix (amino acids 5 to 25) that is important for membrane localization, followed by three distinct structural domains (7–9). Domain I (amino acids 37 to 213) is essential for viral replication, possesses a zinc binding motif, and has been crystallized as a homodimer (9, 10). Domains II (amino acids 250 to 342) and III (amino acids 356 to 447) are less well characterized and exist in a natively unfolded conformation (11, 12). Current evidence indicates that the NS5A protein is essential not only for genome replication but also for the assembly of infectious virions (13). Given its involvement in multiple stages of the viral life cycle, NS5A is an attractive target for small-molecule inhibition. Clinically, rapid and profound reductions of HCV RNA have been observed following monotherapy with several other NS5A inhibitors, including daclatasvir, ledipasvir, ACH-3102, and PPI-668 (14–17).
EDP-239 is a novel NS5A inhibitor with half-maximal effective concentrations (EC50s) in vitro of 31 and 7 pM against genotype 1a (GT1a) and GT1b replicons, respectively. In this report, we demonstrate that EDP-239 does not experience a reduction in potency against replicons resistant to other host-targeted antivirals (HTAs) and direct-acting antivirals (DAAs). In combination experiments, EDP-239 was additive to synergistic with other DAAs or HTAs in inhibiting HCV replication, and apparent combination effects suppressed the selection of HCV resistance in vitro following persistent treatment of replicon cells. Insights gained from the in vitro data presented here were used to guide the clinical development of EDP-239. A phase Ib proof-of-concept study was initiated to determine the efficacy of a single dose of EDP-239, and some of the clinical results are reported here.
MATERIALS AND METHODS
HCV inhibitors.
The chemical reagents used in this study were EDP-239, alisporivir (CAS number 1190307-88-0), daclatasvir (CAS number 1009119-64-5), GSK625433 (CAS number 885264-71-1), simeprevir (CAS number 923604-59-5), and sofosbuvir (CAS number 1190307-88-0), which were synthesized by the chemistry department at Enanta Pharmaceuticals. Dimethyl sulfoxide (DMSO) was used as the solvent for these chemicals. Human interferon alpha 2A was purchased from Sigma (CAS number 105388-21-4) and diluted in sterile phosphate-buffered saline (PBS).
Cell culture and replicons.
Vero, MDBK, MRC-5, HEK293, and Raji cells were obtained from the ATCC and cultured according to ATCC recommendations. Human hepatoma cells (Huh7 Lunet and derivatives) were obtained from ReBLikon GmbH and maintained in complete Dulbecco's modified Eagle's medium (DMEM) supplemented with 10% fetal bovine serum, 1% Glutamax (Life Technologies), 1% penicillin-streptomycin (Life Technologies), and 1% nonessential amino acids solution (MEM NEAA; Life Technologies). Huh7 Lunet cells, described previously (18), were used as host cells for replicon transient transfections and subsequent assays. Several stably transfected subgenomic replicon cell lines were used for compound characterization in cell culture: GT1a replicon cell line En5-3 (19) (Stan Lemon, UNC) and GT1b replicon cell lines Huh-luc/neo-ET and Huh SGR11-7 (18, 20) (ReBLikon, GmbH) were maintained in complete DMEM additionally supplemented with 0.25, 0.5, or 0.75 mg/ml Geneticin, respectively.
The GT1a replicon clone expressed in En5-3 cells, Htat2ANeo/QR/VI/KR/KR5A/SI (19), was modified by first removing the XbaI site from the luc-ubi-neo cassette in the GT1b replicon construct I389luc-ubi-neo/NS3-3′/ET (ReBLikon GmbH) prior to exchanging it for the Htat2ANeo cassette. The resulting LucUbiNeo/QR/VI/KR/KR5A/SI construct was reverse transcribed, and RNA was stably transfected into Huh7 Lunet cells, as previously described (21), to create Huh1a-Luc cells.
GT2a, GT3a, and GT4a replicon cell lines JFH1/SG-Feo, S52/SG-Feo (SH), and ED43/SG-Feo (VYG), respectively (22), were obtained from Apath and maintained in complete DMEM described above and supplemented with 0.75 mg/ml Geneticin. HCV RNA was isolated from the sera of patients infected with HCV GT3a, GT4a, and GT5a and was amplified by reverse transcription (RT)-PCR to generate a DNA fragment encoding either the first 100 amino acids of NS5A (100) or the full-length protein (FL). Chimeric GT1b/3a (FL), GT1b/4a (FL), and GT1b/5a (100) luciferase reporter replicon constructs were subsequently created. Briefly, a unique SbfI restriction enzyme site followed by a stop codon was first engineered by site-directed mutagenesis into the 5′ end of the GT1b wild-type NS5A gene within the I389luc-ubi-neo/NS3-3′/ET replicon construct (ReBLikon GmbH) to create an I389luc-ubi-neo/NS3-3′/ET-SbfI-stop construct. Patient isolate DNA fragments encoding the first 100 amino acids were molecularly stitched by PCR to amplified DNA encoding the last 347 amino acids of GT1b NS5A plus the first 88 amino acids of NS5B. DNA fragments encoding the full-length NS5A or chimeric stitched DNA fragments were subsequently digested using PstI (site included in 5′ primer) and BclI. The digested fragments were ligated into an I389luc-ubi-neo/NS3-3′/ET-SbfI-stop replicon construct that had been predigested with SbfI and BclI. Ligation of the insert into the vector removed the previously introduced stop codon and eliminated the SbfI site. The ligated plasmid was transformed into Escherichia coli by chemical transformation and amplified in liquid culture. The final sequence was confirmed by DNA sequence analysis. HCV GT6a testing was performed by WuXi AppTec, Inc., using a GT1b (Con1) chimeric replicon expressing GT6a NS5A (full-length strain 6a61; GenBank accession number DQ480516).
Cross-resistance testing.
Amino acid mutations reported to confer resistance to inhibitors of the NS3, NS5A, and NS5B proteins (14, 21, 25, 26) were created by introducing substitutions into the GT1b (Con1, I389luc-ubi-neo/NS3-3′/ET) HCV replicon bicistronic clone using site-directed mutagenesis (Stratagene QuikChange XL II) and standard cloning methods. The presence of each mutation was confirmed by sequence analysis. Prior to in vitro transcription of replicon RNA, each plasmid was linearized by digestion with AseI and ScaI. The HCV subgenomic RNA was transiently transfected via chemical transfection into Huh7 Lunet cells using DMRIE-C (Invitrogen) reagent as described previously (21), with modifications. Briefly, Huh7 Lunet cells were seeded at 106 cells per 10-cm tissue culture plate in transfection seed medium (DMEM supplemented with 10% charcoal dextran-stripped fetal bovine serum [FBS] and 1% MEM NEAA) and incubated overnight at 37°C, in 5% CO2. Replicon RNA (15 μg) was diluted in 6 ml DMEM (no supplements) plus 60 μl DMRIE-C reagent. Each overnight 10-cm cell culture was washed twice in DMEM, and each diluted RNA sample was added to one plate and incubated for 3.5 h at 37°C, in 5% CO2. Plates were subsequently washed twice with DMEM, followed by the addition of 10 ml complete DMEM (described above). Transfected cells were incubated overnight at 37°C, in 5% CO2, and seeded the following day at 5,000 cells/well on white 96-well plates (assay plate) in 100-μl/well assay medium (assay medium is DMEM without phenol red, supplemented with 10% FBS, 1% penicillin-streptomycin, 1% MEM NEAA, and 1% Gluta MAX-1). Assay plates were incubated overnight at 37°C, in 5% CO2. The following day, compounds previously titrated in DMSO were diluted 1,000-fold when added to each assay plate (0.1% DMSO final concentration). Each assay plate was subsequently incubated for 72 h at 37°C, in 5% CO2, and then 100 μl/well BriteLite Plus (PerkinElmer) was added and the luminescence was read with an EnVision Excite multilabel plate reader (PerkinElmer). Inhibition of luciferase expression, a measure of viral replication, was determined, and EC50s were calculated by fitting the inhibition data to a four-parameter logistical model using XLfit.
For cytotoxicity measurements, cell lines were seeded at approximately 30% confluence and incubated in the presence of 1,000-fold-diluted compounds (previously titrated in 2- or 3-fold dilutions in DMSO) for 72 h at 37°C, in 5% CO2, and then 60 μl/well ATPlite (PerkinElmer) was added and the luminescence was read with an EnVision Excite multilabel plate reader.
Drug combination testing.
Huh1a-Luc cells were seeded in assay medium (described above) at 5,000 cells/well on white (for viral inhibition assay) or black (for proliferation inhibition assay) 96-well assay plates and incubated overnight at 37°C, in 5% CO2. Compound master plates were prepared, with each compound titrated in DMSO in an x or y direction in an 8-point 2-fold dilution curve with the 90% effective concentration (EC90) used as a top concentration. x and y direction master plates were diluted 100-fold in assay medium and then an additional 10-fold onto each assay plate for a final compound dilution of 1:1,000, generating an 8 × 8 (64-point) dose-response combination matrix. The cells were then incubated for 72 h before the measurement of luciferase activity (viral inhibition) or ATP reduction (cell viability). BriteLite Plus was added to each white viral inhibition assay plate, and ATPlite (PerkinElmer) was added to each black cell viability assay plate, according to the manufacturer's directions. All luminescence measurements were assayed, as described above, using an EnVision Excite multilabel plate reader. Compound combinations were assessed in biological quadruplicate dose matrices, and DMSO or PBS (interferon) control wells were included as negative, untreated controls. The combinations were analyzed for synergy, additivity, or antagonism using either the Loewe additivity model and quantified by the combination index (CI) using CalcuSyn software from Biosoft (24) or the Bliss additivity model, determined using MacSynergy II (23).
Colony formation assay.
Resistance suppression combinations were performed by seeding En5-3 (GT1a) or Huh11-7 (GT1b) cells on 6-well plates at subconfluence. Compounds were diluted in DMSO and applied as single agents or in combination every 3 days to growth medium containing G418 for approximately 2 weeks. Two independent experiments per treatment were conducted with 6-well plates. Cells were incubated with compound until the control samples (0.2% DMSO) reached confluence. Cells were subsequently passaged 1:12 onto fresh 6-well plates and continuously cultured until macroscopic colonies were visible and G418-sensitive cells had died. The cells were subsequently fixed and stained with 1% crystal violet in 70% ethanol.
Clinical study design.
EDP-239 was investigated in a randomized, double-blind, placebo-controlled, parallel-cohort multicentered study (ClinicalTrials.gov registration no. NCT01856426). The study was approved by the institutional review boards at all study centers and conducted in accordance with good clinical practice and ethical principles. Twenty-eight male and female patients with chronic GT1 HCV infection were enrolled. The study was stratified by equal numbers of subjects infected with HCV GT1a and GT1b and randomized into 1 of 5 treatment arms to receive single doses of EDP-239 or placebo. In all patients, a single dose of EDP-239 or placebo was administered (time zero, day 1). Doses of EDP-239 in individual treatment arms were as follows: 10, 30, 100, and 200 mg. Each EDP-239 treatment cohort was intended to have 6 patients, with 2 patients from each cohort receiving placebo. One patient's HCV genotype was incorrectly identified as GT1b prior to receipt of the first dose; subsequent sequencing analysis and confirmatory genotyping near the end of the study indicated that the patient was infected with GT1a HCV. Plasma samples for determining HCV RNA levels were drawn at screening, prior to the first dose on day 1 (baseline), at 0.5, 1, 1.5, 2, 3, 4, 5, 6, 8, 12, 24, 48, 72, 96, 120, 216, and 312 h after the initial dose, and on weeks 12, 24, and 48. HCV RNA levels were measured by Covance, Inc., using the Roche COBAS TaqMan HighPure HCV v2.0 assay, with a lower limit of quantification of 25 IU/ml.
PK assessments.
Patient blood (plasma) samples for analysis of EDP-239 concentrations were collected on day 1 before dosing (time zero) and at 0.5, 1, 1.5, 2, 3, 4, 5, 6, 8, 12, 24, 48, 72, 96, and 120 h after dosing. Plasma samples were analyzed by a validated liquid chromatography-tandem mass spectrometry (LC-MS/MS) method for determination of EDP-239 concentrations. The resulting data underwent analysis, whereby pharmacokinetic (PK) parameters of EDP-239 were determined using the actual recorded sampling times and a noncompartmental approach consistent with the oral route of administration. WinNonlin Pro (Pharsight Corporation, St. Louis, MO; version 5.2 or higher) was used for PK analysis with the following parameters determined from the plasma concentration-time data: maximum concentration of drug in serum (Cmax), time to maximum concentration of drug in serum (Tmax), area under the concentration-time curve from zero to infinity (AUC0–inf), half-life (t1/2), and the apparent total clearance of drug from plasma after oral administration (CL/F).
RESULTS
EDP-239 inhibits HCV replication in replicon cells.
The chemical structure of EDP-239 is shown in Fig. 1. EDP-239 is a potent inhibitor of multiple HCV genotypes, with EC50s of 4 to 394 pM for GT1a, -1b, -4a, -5a, and -6a, respectively, and EC50s of 5 to >50 nM for GT2a and -3a, respectively (Table 1). In the presence of 40% human serum, the potency of EDP-239 was reduced by 3.8- and 2.7-fold against GT1a and GT1b, respectively. In cytotoxicity assays using multiple cell lines, EDP-239 did not inhibit cell proliferation significantly (>50% growth inhibition) at concentrations up to 10 μM during a 3-day exposure. Thus, in vitro selectivity indexes (50% cytotoxic concentration [CC50]/EC50) of >320,512 and >1,369,863 were calculated for GT1a replicon cells and GT1b replicon cells, respectively, in the absence of 40% human serum. The results of these experiments establish that EDP-239 is a potent, selective inhibitor of subgenomic HCV replication in cell culture assays.
FIG 1.
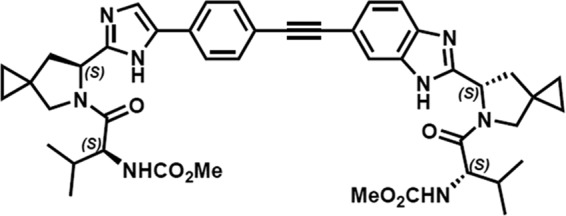
Chemical structure of EDP-239.
TABLE 1.
EDP-239 potency against GT1 to GT6a subgenomic replicon cell lines and cytotoxicity in multiple cell types
| HCV subgenomic replicon genotype and/or cell type | EC50 (nM) (mean ± SD)a |
EC50 fold shift in human serum | CC50 (nM)c | Selectivity index (CC50/EC50) | |
|---|---|---|---|---|---|
| 0% human serumb | 40% human serumb | ||||
| 1a (H77c) | 0.031 ± 0.004 | 0.118 ± 0.039 | 3.8 | >10,000 | >322,581 |
| 1b (Con1) | 0.007 ± 0.002 | 0.019 ± 0.006 | 2.7 | >10,000 | >1,428,571 |
| 2a (JFH1) | 6.5 ± 1.4 | ||||
| 3a (S52) | >50 | ||||
| 1b/3a (FL)d | 5.01 ± 0.49 | ||||
| 4a (ED43) | 0.063 ± 0.012 | ||||
| 1b/4a (FL)d | 0.004 ± 0.001 | ||||
| 1b/5a (100)d | 0.011 ± 0.002 | ||||
| 1b/6a (FL)d | 0.394 ± 0.044 | ||||
| Vero, African Green Monkey kidney | >10,000 | ||||
| MDBK, bovine kidney | >10,000 | ||||
| MRC-5, human lung fibroblast | >10,000 | ||||
| HEK293, human embryonic kidney | >10,000 | ||||
| Raji, human lymphoma | >10,000 | ||||
EC50s and standard deviations (SD) were calculated from at least two separate experiments using biological duplicates.
Assay media with 0% and 40% human serum also include 10% fetal bovine serum. All replicons are stable replicon cell lines except genotypes 1b/5a and 1b/6a, which were transiently transfected.
n = 12 biological replicates for each cell line. CC50 is the 50% cytotoxic concentration.
Chimeric replicons expressing full-length NS5A (FL) or the first 100 amino acids of NS5A (100) cloned from patient isolates.
HCV variants resistant to DAAs or HTAs are not cross-resistant to EDP-239.
Antiviral compounds targeting specific viral proteins can select for mutations that lead to reduced potency of that compound and can also result in decreased susceptibility to other antiviral compounds of a similar class. While less common, the effectiveness of compounds targeting different proteins within the same protein complex may also be affected by mutations in an off-target protein. Therefore, we sought to investigate the impact of resistance-associated mutations (RAMs) previously identified within the NS3, NS5A, and NS5B proteins of HCV on EDP-239 potency (Table 2) (25–29; M. Gao, R. Fridell, D. O'Boyle, D. Qiu, J. Sun, J. Lemm, P. Nower, L. Valera, S. Voss, M. Liu, M. Belema, V. Nguyen, J. Romine, S. Martin, M. Serrano-Wu, D. St Laurent, L. Snyder, R. Colonno, L. Hamann, and N, Meanwell, presented at the 15th International Symposium on Hepatitis C Virus and Related Viruses, San Antonio, TX, 5–9 October 2008). GT1b replicons expressing amino acid substitutions that confer resistance to NS3 protease (R155K or D168V), NS5B polymerase (M414T or S282T), or cyclophilin inhibitors (D320E in NS5A) are not cross-resistant to EDP-239, as demonstrated by the lack of potency shifts observed against these HCV RAMs. However, it is apparent that EDP-239 potency is reduced by NS5A RAMs (Y93H, L31M, or L31V) selected by similar classes of approved NS5A inhibitors such as ledipasvir or daclatasvir (21, 28). EDP-239 was less sensitive to Y93H and L31M resistance mutations than daclatasvir, experiencing 22- and 2-fold EC50 increases, respectively, compared to 89- and 36-fold EC50 increases for daclatasvir. The L31V RAM was determined to confer a higher degree of resistance (20-fold) against EDP-239 than against daclatasvir (5-fold). A more detailed analysis of RAMs selected in vitro in GT1a and GT1b replicon cells, as well as an analysis of these data in the context of clinical RAMs identified in the phase I clinical trial, are reported in an accompanying article (29).
TABLE 2.
Antiviral activity of EDP-239 and other DAAs against transiently transfected GT1b HCV replicon variants
| GT1b replicon variant expressing RAMs or wild-type sequence (drug class)a | EC50a fold shift vs wild type |
|||||
|---|---|---|---|---|---|---|
| EDP-239 | Daclatasvir | Alisporivir | Simeprevir | Sofosbuvir | GSK625433 | |
| Wild type | 1 | 1 | 1 | 1 | 1 | 1 |
| R155K (PI) | 1 | 1 | 1 | 44 | 1 | 1 |
| D168V (PI) | 1 | 1 | 1 | >120 | 1 | 1 |
| M414T (NNI) | 1 | 1 | 1 | 1 | 1 | 96 |
| S282T (NI) | 1 | 1 | 1 | 1 | 10 | 1 |
| D320E (CyPI) | 1 | 1 | 3 | 1 | 1 | 1 |
| Y93H (NS5AI) | 22 | 89 | 1 | 1 | 1 | 1 |
| L31V (NS5AI) | 20 | 5 | 1 | 1 | 1 | 1 |
| L31M (NS5AI) | 2 | 36 | 1 | 1 | 1 | 1 |
PI, protease inhibitor; NI, nucleoside inhibitor; NNI, nonnucleoside inhibitor; CypI, cyclophilin inhibitor; NS5AI, NS5A protein inhibitor.
Averages from 4 to 12 biological replicates; calculated from the ratio of the average EC50s for variant replicons to that of the wild-type replicon.
EDP-239 combinations with DAAs or HTAs.
Given the encouraging data regarding the lack of cross-resistance between EDP-239 and RAMs selected by protease, cyclophilin, or polymerase inhibitors, we sought to assess the possible benefits associated with EDP-239 in combination with other DAA or HTA compounds. Two types of combination studies were conducted to identify combination effects following either transient or persistent treatment of replicon cells.
First, EDP-239 and other HTA or DAA compounds were titrated in an x or y direction, generating an 8-point, 2-fold dilution curve with the EC90 used as a top concentration. Combinations of EDP-239 with simeprevir (protease inhibitor), sofosbuvir (nucleoside inhibitor), alisporivir (cyclophilin inhibitor), or interferon alpha (IFN) were then added to Huh1a-Luc replicon cells. The inhibition of luciferase, a measure of viral replication, was determined for each combination. The combination data were analyzed for antagonistic, additive, or synergistic combination effects across the entire combination surface created by the diluted compounds by using two separate metrics for quantifying additivity.
The predicted additive effects for each combination were first calculated using the Bliss independence additivity model (I = IX + IY − IXIY), where IX and IY are the single-agent inhibition levels at concentrations X and Y (30). This model is employed by the MacSynergy program (23) and is a frequently used additivity model that allows additivity to be calculated from minimally sampled experiments. Despite its popularity, it remains a poor predictor of dose additivity between combinations of the same drug, and thus its relevance to combinations of drugs in biological settings is questionable. Nevertheless, Fig. 2 represents the differences (within 95% confidence intervals) between experimental inhibition effects and predicted Bliss independence additive effects for each combination matrix. A positive value in excess of the predicted additivity is considered synergistic, while a negative value is considered antagonistic. The effects of EDP-239 in combination with all antivirals tested were either at or exceeded the levels predicted by the Bliss independence model for EDP-239 in combination with other DAAs or HTAs, suggesting additive to synergistic inhibition of HCV replication. There was no significant antagonism or cytotoxicity (data not shown) observed for any of the combinations of compounds.
FIG 2.

Bliss additivity excess for combinations of EDP-239 with simeprevir (protease inhibitor), sofosbuvir (nucleoside inhibitor), alisporivir (cyclophilin inhibitor), or interferon alpha (IFN) in GT1a replicon cells at 95% confidence intervals. Combinations were analyzed using a mathematical model, MacSynergy II. The dose matrix responses represent the difference between experimental and predicted combination effects at each combination concentration. Positive values above the zero plane signify synergy, negative values signify antagonism, and values close to zero signify additivity. The results are an average for four biological replicates of a representative experiment.
The Loewe additivity model (31) represents the expected combination response if both agents are actually the same compound. Deviations from Loewe additivity are quantified by using the combination index (CI), which is essentially a ratio of the total combined concentration to each of the constituent concentrations required to achieve the specified effect level, and was determined using the CalcuSyn program (24). When the combination inhibition data were evaluated in the context of the Loewe additivity model, CI scores were calculated for five separate ratios of each combination matrix and at four separate effective concentrations (EC50, EC75, EC90, EC95). The CI scores for each effective concentration were averaged across the multiple ratios and are shown in Table 3. A CI score of >1.1 can generally be considered indicative of antagonism, while scores between 0.9 and 1.1 signify additivity and scores less than 0.9 indicate synergy. For reference, a CI of 0.5 indicates that the total molar concentration of the combination to achieve a given effect level is only half what is needed for either of the single agents alone. All of the combinations tested with EDP-239 were generally found to be additive to synergistic by the Loewe additivity model. In particular, combinations of EDP-239 with alisporivir, simeprevir, and sofosbuvir tended toward significant synergy at concentrations achieving an EC75, EC90, or EC95. Interactions between EDP-239 and interferon alpha were calculated as additive at all effective concentrations. The CI values tended toward additivity for combinations with simeprevir at concentrations achieving an EC50, but these concentrations were lower than those that would be of clinical interest.
TABLE 3.
CI calculations for EDP-239 combinations
| EDP-239 combination | Mean CIa |
|||
|---|---|---|---|---|
| EC50 | EC75 | EC90 | EC95 | |
| Alisporivir | 0.75 | 0.54 | 0.41 | 0.34 |
| Simeprevir | 0.85 | 0.68 | 0.55 | 0.47 |
| Sofosbuvir | 0.68 | 0.56 | 0.47 | 0.41 |
| Interferon alpha | 1.09 | 1.00 | 0.94 | 0.90 |
The mean combination index (CI) was calculated by averaging the EC50, EC75, EC90, and EC95 values across five drug ratios of each 8 × 8 combination synergy surface, representing an average of four biological replicates. CI of 0.9 to 1.1 = additive; CI of >1.1 = antagonistic; CI of <0.9 = synergistic.
Combination studies were also conducted in vitro using GT1b replicons with similar results (data not shown). Given that infection with GT1a in patients has proven more difficult to treat than infection with GT1b, GT1a was highlighted for these combination studies. Future studies aimed at additional genotypes will be conducted prior to subsequent clinical testing.
In an effort to determine if combination effects between EDP-239 and a DAA or an HTA are also apparent following persistent treatment of replicons, combinations of EDP-239 and sofosbuvir or alisporivir were applied to replicon cells at the fold increases in concentration indicated above each compound's EC50 in Fig. 3. Persistent combination effects were apparent for either dose of EDP-239 in combination with sofosbuvir at 5× or 10× its EC50 in GT1a replicon cells, resulting in suppression of resistant colonies. EDP-239 in combination with alisporivir produced even more dramatic combination effects in GT1b replicon cells, with all combination doses of EDP-239 and alisporivir completely suppressing the expansion of drug-resistant colonies. These results demonstrate that transient EDP-239 synergy with DAAs or HTAs translates to combination effects observed with persistent treatment, where combinations of EDP-239 and DAAs were more effective in suppressing the selection of resistant clones than either agent alone.
FIG 3.

Suppression of resistant colony formation by combinations of EDP-239 with sofosbuvir in GT1a replicon cells (A) or alisporivir in GT1b replicon cells (B). Huh1a7 (GT1a) or Huh11-7 (GT1b) cells were seeded on 6-well plates at subconfluence. Compounds were diluted in DMSO and applied as single agents or in combination every 3 days to growth medium containing G418 for approximately 2 weeks. Cells were incubated and continuously cultured with compound until macroscopic colonies were visible and G418-sensitive cells had died. Colonies were subsequently fixed and stained with 1% crystal violet in 70% ethanol.
Clinical PK assessment.
We sought to determine whether the favorable preclinical characteristics of EDP-239 translate to the clinic by conducting a placebo-controlled proof-of-concept study of four cohorts comprised of six GT1 HCV-infected patients each. Following a single dose of EDP-239, mean concentrations in plasma reached a peak (Tmax) at approximately 2 to 3 h, followed by a biphasic decrease in concentration over 120 h (Table 4). AUC0–inf and Cmax values displayed dose-dependent increases. It appears that the increase in exposure was somewhat greater than dose proportional toward the highest dose of 200 mg, consistent with a lower apparent clearance (CL/F) when the dose increased from 100 to 200 mg. The terminal elimination half-life (t1/2) was essentially unchanged at approximately 23 to 25 h across all 4 doses, supporting once daily dosing.
TABLE 4.
Mean plasma pharmacokinetic parameters of EDP-239 in GT1 HCV-infected patientsa
| EDP-239 dose (mg) | No. of patients | AUC0–inf (h · ng/ml) | Cmax (ng/ml) | Tmax (h) | t1/2 (h) | CL/F (ml/h) |
|---|---|---|---|---|---|---|
| 10 | 6 | 2,270 (61.5) | 95.8 (36.4) | 1.75 (1.50, 3.00) | 25.1 (29.6) | 5620 (47.7) |
| 30 | 6 | 7,460 (55.6) | 305 (23.4) | 2.02 (1.50, 4.00) | 25.0 (31.7) | 5000 (47.7) |
| 100 | 6 | 21,800 (29.9) | 849 (36.1) | 2.51 (2.00, 4.00) | 23.0 (22.4) | 5080 (40.7) |
| 200 | 6 | 69,500 (50.6) | 2170 (33.2) | 3.00 (2.00, 5.00) | 22.9 (35.8) | 3330 (33.5) |
All values (except Tmax) are means, with the coefficient of variation (%) given in parentheses. Tmax values are medians, with the minimum and maximum given in parentheses.
EDP-239 induced a multi-log10 reduction in GT1 HCV RNA levels in infected patients.
Administration of a single dose of EDP-239 resulted in rapid reductions in GT1a and GT1b HCV RNA levels at all doses tested (10, 30, 100, and 200 mg), with viral loads reaching the nadir at either day 2 or 3 in GT1a patients (Fig. 4A) or at days 3 to 5 in GT1b patients (Fig. 4B). Within the first 24 h of receiving a single dose of EDP-239, mean reductions in GT1a HCV RNA levels were ≥2 log10 IU/ml in patients receiving 10 or 30 mg of compound. In patients receiving 100 mg of EDP-239, the mean reduction in GT1a RNA levels within 24 h was 3.4 log10 IU/ml. A comparable mean reduction was observed for patients receiving 200 mg EDP-239 but only if the results for one patient were excluded from the mean calculation. This patient passed the inclusion criteria for this study with a plasma HCV RNA concentration of 4.4 × 10⁵ IU/ml at screening. However, prior to receiving a single dose of EDP-239 on day 1, this patient's viral RNA level at baseline had decreased by more than 15-fold to 2.5 × 10⁴ IU/ml, below the limit (105 IU/ml) imposed for inclusion. It is additionally noteworthy that genotyping results initially categorized another patient as a GT1b patient prior to dosing with 10 mg EDP-239; however, subsequent sequencing results and repeat genotype testing confirmed that this patient was actually infected with a GT1a virus.
FIG 4.
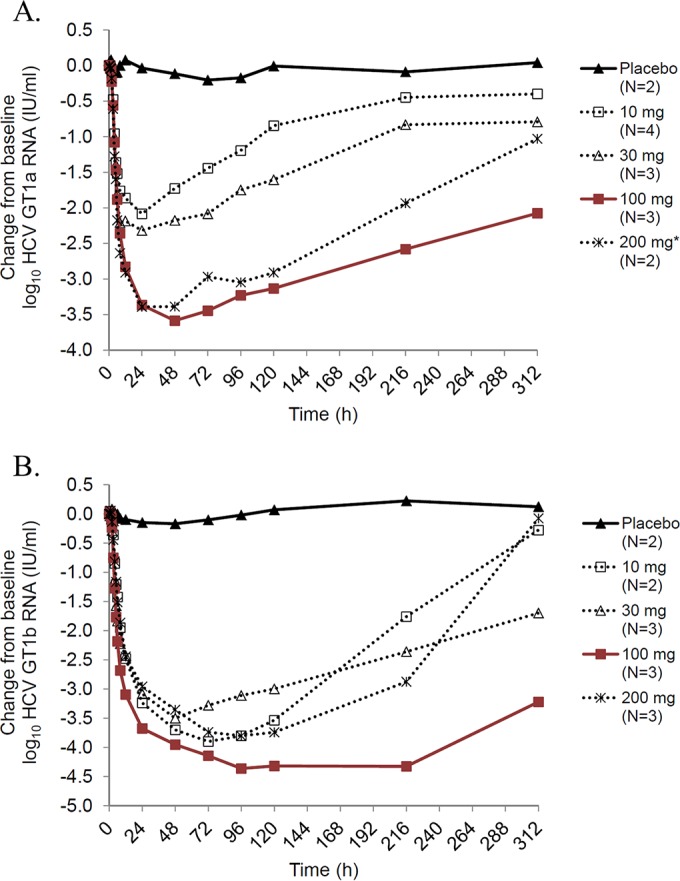
Mean log10 HCV RNA change from baseline over time by dose cohort for patients infected with GT1a HCV (A) and GT1b HCV (B). A single dose of EDP-239 was given at time zero. The results for one patient in the 200-mg dose cohort were excluded from the mean calculation due to viral RNA levels at <105 IU/ml at baseline.
GT1b viral RNA reductions in infected patients were even more rapid than in GT1a patients (Fig. 4B). Within the first 24 h, mean reductions in GT1b HCV RNA levels were >2.9 log10 IU/ml in patients in all dose cohorts. Viral RNA levels continued to decline over the subsequent 1 to 3 days, with a maximum mean decline in HCV RNA of >4 log10 IU/ml in patients receiving 100 mg of compound and of ≥3.5 log10 IU/ml in patients receiving 10-, 30-, and 200-mg doses. In addition, HCV RNA suppression was more sustained in GT1b patients, and in patients receiving 100 mg EDP-239, RNA concentrations did not rebound until 216 h postdosing.
Maximum HCV RNA reductions were determined for all patients in each dose cohort by HCV genotype and compared to the mean reductions in viral RNA by dose cohort (Fig. 5). Because the patient sample size in each cohort was small, we employed a two-tailed Student's t test to determine the statistical significance of the RNA reductions by dose. Our statistical analysis found that the 100-mg and 200-mg doses in GT1a patients (Fig. 5A) are significantly more efficacious (P = 0.05 and P = 0.02, respectively) than the 10-mg dose (Fig. 5A), but no statistically significant differences were observed between the dose cohorts in GT1b HCV-infected patients (Fig. 5B). A comparison of the dose cohorts between genotypes 1a and 1b found that only the 10-mg dose is statistically more efficacious in GT1b patients than in GT1a patients (P < 0.01).
FIG 5.

Maximum reduction in HCV RNA log10 IU/ml by dose cohort for patients infected with GT1a HCV (A) and GT1b HCV (B). The maximum change from baseline in HCV RNA plasma concentrations is plotted for each patient receiving EDP-239 (cohort mean indicated by horizontal bar). In panel A, the results for one GT1a HCV patient receiving 200 mg EDP-239 were excluded from the dot plot and the mean calculation due to viral RNA levels at <105 IU/ml at baseline.
Maximum mean HCV RNA reductions (Table 5) from baseline for the GT1a cohort were as follows (in log10 IU/ml): 0.20 (day 4) for placebo, 2.08 (day 2) for 10 mg, 2.32 (day 2) for 30 mg, 3.58 (day 3) for 100 mg, and 3.39 (day 3) for 200 mg (excluding the patient with a baseline HCV RNA level of <105 IU/ml). Maximum mean reductions from baseline for the GT1b cohort were as follows (in log10 IU/ml): 0.17 (day 3) for placebo, 3.90 (day 4) for 10 mg, 3.50 (day 3) for 30 mg, 4.36 (day 5) for 100 mg, and 3.80 (day 5) for 200 mg. In general, HCV RNA suppression was more sustained in GT1b patients than in GT1a patients, which is consistent with the previously defined differences in potency for EDP-239 against GT1a and GT1b replicons in vitro.
TABLE 5.
Mean maximum viral load reduction influenced by dose of EDP-239
| EDP-239 dose (mg) or placebo | Maximum HCV RNA reduction (log10 IU/ml) (mean ± SD)a |
|
|---|---|---|
| GT1a | GT1b | |
| 10 | 2.08 ± 0.78 (d2) | 3.90 ± 0.33 (d4) |
| 30 | 2.32 ± 1.50 (d2) | 3.50 ± 0.76 (d3) |
| 100 | 3.58 ± 0.75 (d3) | 4.36 ± 0.11 (d5) |
| 200 | 3.39 ± 0.21 (d3)b | 3.80 ± 0.73 (d5) |
| Placebo | 0.20 ± 0.16 (d4) | 0.17 ± 0.49 (d3) |
The day of measurement is indicated in parentheses (e.g., d2 indicates day 2).
This value excludes results for one patient with an HCV RNA level of <105 IU/ml at baseline.
DISCUSSION
EDP-239 is a novel, potent, and selective inhibitor of HCV replication in vitro with low cellular toxicity. EDP-239 has no significant activity against the NS3 serine protease or NS5B polymerase (data not shown). Resistance selection studies in vitro identified numerous changes within the first 100 amino acids of NS5A (29). Selection of these resistance-associated mutations in the NS5A gene further supports the hypothesis that EDP-239 interferes with HCV replication by inhibiting NS5A function. Additional analyses concerning RAMs selected in vitro and whether they are predictive of baseline or treatment-emergent mutations in vivo will be reported elsewhere (29). Here, we provide evidence of the compound's potency in numerous in vitro preclinical assays as well as its potential suitability for future development as a therapeutic to be used in combination with existing HCV antivirals. We also demonstrate the clinical efficacy of EDP-239 in GT1 HCV-infected patients and discuss the contribution of its improved pharmacokinetics to the observed clinical results.
EDP-239 inhibits HCV subgenomic replicon replication, with activity at picomolar concentrations against genotypes 1a, 1b, 4a, 5a, and 6a and potency at nanomolar concentrations against genotypes 2a and 3a. This genotypic potency profile is not dissimilar to reports of another NS5A inhibitor, ledipasvir, which has comparable potencies against similar genotypes (32). However, in a phase I clinical study of ledipasvir, there were no significant differences in HCV RNA reduction between GT1a and GT1b patients receiving three daily 10-mg doses of study drug nor were there discernible dose effects among GT1a patients receiving 10, 30, or 90 mg despite clear dose-dependent drug exposures (15). We report here statistically significant EDP-239 potency differences between GT1a and GT1b patients receiving a single 10-mg dose of study drug, as well as significant dose effects observed in GT1a patients receiving 100- and 200-mg single doses of EDP-239 in comparison to the 10-mg dose cohort. The lack of significant dose effects in GT1b patients is the result of viral RNA concentrations suppressed to levels near the limit of quantification in patients treated with all four doses. These results are consistent with in vitro data demonstrating greater EDP-239 potency against GT1b than against GT1a.
Previous clinical analyses of ledipasvir found that maximal concentrations (Cmax) achieved in patients with 10-, 30-, or 90-mg doses were 18.7, 67.0, and 166.5 ng/ml, respectively, on day 1. In contrast, maximal concentrations of EDP-239 described here were 4- to 5-fold higher with comparable doses. The apparent greater exposures for EDP-239 likely led to the continued decline in HCV RNA concentrations described here, achieving a maximum reduction 48 h after dosing in GT1a patients receiving 100 or 200 mg and up to 96 h later in GT1b patients receiving similar doses. Improved EDP-239 pharmacokinetics may also explain why a single 10-mg dose of EDP-239 resulted in a mean maximum reduction in GT1b HCV RNA of 3.9 log10 IU/ml, while three daily 10-mg doses of ledipasvir reduced GT1b HCV RNA by only a median maximum of 3.3 log10 IU/ml (15). Similarly, a single 100-mg EDP-239 dose reduced GT1a HCV RNA by 3.6 log10 IU/ml, compared to a reduction of 3.1 log10 IU/ml for three daily 90-mg doses of ledipasvir. However, given the small sample sizes of each dose cohort in this study, these differences may not be statistically significant. Due to the significant plasma exposures observed with EDP-239 monotherapy, it is expected that the NS5A inhibitor will also be efficacious in patients infected with HCV genotypes 4, 5, or 6 and potentially in patients infected with HCV genotypes 2 and 3.
When EDP-239 was tested in combination with other DAA or HTA compounds, the inhibition of replicon replication was additive to synergistic, without evidence of antagonism or cytotoxicity. Persistent treatment of replicon cells with EDP-239 in combination with sofosbuvir or alisporivir demonstrated clear combination effects consistent with the additivity excess studies and suppressed the development of HCV resistance. These results support the contention that EDP-239 may be used in combination with DAA or HTA compounds in patients to effectively suppress chronic HCV infection.
ACKNOWLEDGMENTS
We thank the patients for their participation in this study. We acknowledge the ENANTA Pharmaceuticals and Novartis chemistry departments for their compound synthesis contributions.
This study was supported by ENANTA Pharmaceuticals, Inc., and Novartis. All authors from Enanta and Novartis were employees of Enanta and Novartis at the time the research was completed.
We disclose the following commercial relationships with the indicated entities: Stefan Zeuzem discloses Abbvie, BMS, Gilead, Janssen, and Merck/MSD; Fred Poordad discloses Abbvie, Achillion Pharmaceuticals, Anadys Pharmaceuticals, Biolex Therapeutics, Boehringer Ingelheim, Bristol-Myers Squibb, Genentech, Gilead Sciences, GlaxoSmithKline, GlobeImmune, Idenix Pharmaceuticals, Idera Pharmaceuticals, Intercept Pharmaceuticals, Janssen, Medarex, Medtronic, Merck, Novartis, Santaris Pharmaceuticals, Scynexis Pharmaceuticals, Vertex Pharmaceuticals, ZymoGenetics, Kadmon, Onyx/Bayer, Salix, and Tibotec/Janssen; Peter Buggisch discloses Abbott, AbbVie, BMS, Falk, Gilead, Janssen, Merck, Merz, MSD, Novartis, and Roche; Eric Lawitz discloses AbbVie, Achillion, Regulus, Theravance, Enanta, Idenix, Janssen, Merck & Co., Novartis, Gilead, Boehringer Ingelheim, Bristol-Myers Squibb, GlaxoSmithKline, Intercept, Nitto Denko, and Salix; and Terry D. Box discloses Gilead, AbbVie, Salix, Bristol-Myers Squibb, Janssen, Merck & Co., Intercept, Idenix, Boehringer Ingelheim, Sundise, and Ikaria.
Funding Statement
This research received no specific grant from any funding agency in the public, commercial, or not-for-profit sectors.
Footnotes
For a companion article on this topic, see doi:10.1128/AAC.00815-16.
REFERENCES
- 1.Armstrong GL, Wasley A, Simard EP, McQuillan GM, Kuhnert WL, Alter MJ. 2006. The prevalence of hepatitis C virus infection in the United States, 1999 through 2002. Ann Intern Med 144:705–714. doi: 10.7326/0003-4819-144-10-200605160-00004. [DOI] [PubMed] [Google Scholar]
- 2.Anonymous. 1999. Hepatitis C—global prevalence (update). Wkly Epidemiol Rec 74:425–427. [PubMed] [Google Scholar]
- 3.Anonymous. 2016. Hepatitis C fact sheet no. 164. World Health Organization, Geneva, Switzerland. [Google Scholar]
- 4.Lindenbach BD, Rice CM. 2001. Flaviviridae: the viruses and their replication, p 991–1041. In Knipe DM, Howley PM (ed), Fields virology, 4th ed, vol 1 Lippincott-Raven Publishers, Philadelphia, PA. [Google Scholar]
- 5.Simmonds P, Bukh J, Combet C, Deleage G, Enomoto N, Feinstone S, Halfon P, Inchauspe G, Kuiken C, Maertens G, Mizokami M, Murphy DG, Okamoto H, Pawlotsky JM, Penin F, Sablon E, Shin IT, Stuyver LJ, Thiel HJ, Viazov S, Weiner AJ, Widell A. 2005. Consensus proposals for a unified system of nomenclature of hepatitis C virus genotypes. Hepatology 42:962–973. doi: 10.1002/hep.20819. [DOI] [PubMed] [Google Scholar]
- 6.Macdonald A, Harris M. 2004. Hepatitis C virus NS5A: tales of a promiscuous protein. J Gen Virol 85:2485–2502. doi: 10.1099/vir.0.80204-0. [DOI] [PubMed] [Google Scholar]
- 7.Huang L, Hwang J, Sharma SD, Hargittai MR, Chen Y, Arnold JJ, Raney KD, Cameron CE. 2005. Hepatitis C virus nonstructural protein 5A (NS5A) is an RNA-binding protein. J Biol Chem 280:36417–36428. doi: 10.1074/jbc.M508175200. [DOI] [PubMed] [Google Scholar]
- 8.Penin F, Brass V, Appel N, Ramboarina S, Montserret R, Ficheux D, Blum HE, Bartenschlager R, Moradpour D. 2004. Structure and function of the membrane anchor domain of hepatitis C virus nonstructural protein 5A. J Biol Chem 279:40835–40843. doi: 10.1074/jbc.M404761200. [DOI] [PubMed] [Google Scholar]
- 9.Tellinghuisen TL, Marcotrigiano J, Gorbalenya AE, Rice CM. 2004. The NS5A protein of hepatitis C virus is a zinc metalloprotein. J Biol Chem 279:48576–48587. doi: 10.1074/jbc.M407787200. [DOI] [PubMed] [Google Scholar]
- 10.Tellinghuisen TL, Marcotrigiano J, Rice CM. 2005. Structure of the zinc-binding domain of an essential component of the hepatitis C virus replicase. Nature 435:374–379. doi: 10.1038/nature03580. [DOI] [PMC free article] [PubMed] [Google Scholar]
- 11.Hanoulle X, Verdegem D, Badillo A, Wieruszeski JM, Penin F, Lippens G. 2009. Domain 3 of non-structural protein 5A from hepatitis C virus is natively unfolded. Biochem Biophys Res Commun 381:634–638. doi: 10.1016/j.bbrc.2009.02.108. [DOI] [PubMed] [Google Scholar]
- 12.Liang Y, Ye H, Kang CB, Yoon HS. 2007. Domain 2 of nonstructural protein 5A (NS5A) of hepatitis C virus is natively unfolded. Biochemistry 46:11550–11558. doi: 10.1021/bi700776e. [DOI] [PubMed] [Google Scholar]
- 13.Ross-Thriepland D, Harris M. 2015. Hepatitis C virus NS5A: enigmatic but still promiscuous 10 years on! J Gen Virol 96:727–738. doi: 10.1099/jgv.0.000009. [DOI] [PubMed] [Google Scholar]
- 14.Gao M, Nettles RE, Belema M, Snyder LB, Nguyen VN, Fridell RA, Serrano-Wu MH, Langley DR, Sun JH, O'Boyle DR II, Lemm JA, Wang C, Knipe JO, Chien C, Colonno RJ, Grasela DM, Meanwell NA, Hamann LG. 2010. Chemical genetics strategy identifies an HCV NS5A inhibitor with a potent clinical effect. Nature 465:96–100. doi: 10.1038/nature08960. [DOI] [PMC free article] [PubMed] [Google Scholar]
- 15.Lawitz EJ, Gruener D, Hill JM, Marbury T, Moorehead L, Mathias A, Cheng G, Link JO, Wong KA, Mo H, McHutchison JG, Brainard DM. 2012. A phase 1, randomized, placebo-controlled, 3-day, dose-ranging study of GS-5885, an NS5A inhibitor, in patients with genotype 1 hepatitis C. J Hepatol 57:24–31. doi: 10.1016/j.jhep.2011.12.029. [DOI] [PubMed] [Google Scholar]
- 16.Lalezari J, Farrell G, Shah P, Lawitz E, Schwabe C, Walsh D, Vig P, Brown N, Ruby E, Halfon S, Huang N, Huang Q, Colonno R, Li L, Johnston B, Wargin B, Gane E. 2012. PPI-668, a potent new pan-genotypic HCV NS5A inhibitor: phase 1 efficacy and safety. Hepatology 56(Suppl S1):1065A–1066A. [Google Scholar]
- 17.Muir A, Hill J, Lawitz E, Marbury T, Robarge L, Robison H, Hui J, Huang M, Agarwal A, Perelson A, Deshpande M, Kocinsky H. 2013. ACH-3102, a second generation NS5A inhibitor, demonstrates potent antiviral activity in patients with genotype 1A HCV infection despite the presence of baseline NS5A-resistant variants, abstr 876 Abstr 48th Annu Meet Eur Assoc Study Liver, Amsterdam, The Netherlands. [Google Scholar]
- 18.Lohmann V, Korner F, Koch J, Herian U, Theilmann L, Bartenschlager R. 1999. Replication of subgenomic hepatitis C virus RNAs in a hepatoma cell line. Science 285:110–113. doi: 10.1126/science.285.5424.110. [DOI] [PubMed] [Google Scholar]
- 19.Yi M, Lemon SM. 2004. Adaptive mutations producing efficient replication of genotype 1a hepatitis C virus RNA in normal Huh7 cells. J Virol 78:7904–7915. doi: 10.1128/JVI.78.15.7904-7915.2004. [DOI] [PMC free article] [PubMed] [Google Scholar]
- 20.Lohmann V, Korner F, Dobierzewska A, Bartenschlager R. 2001. Mutations in hepatitis C virus RNAs conferring cell culture adaptation. J Virol 75:1437–1449. doi: 10.1128/JVI.75.3.1437-1449.2001. [DOI] [PMC free article] [PubMed] [Google Scholar]
- 21.Fridell RA, Qiu D, Wang C, Valera L, Gao M. 2010. Resistance analysis of the hepatitis C virus NS5A inhibitor BMS-790052 in an in vitro replicon system. Antimicrob Agents Chemother 54:3641–3650. doi: 10.1128/AAC.00556-10. [DOI] [PMC free article] [PubMed] [Google Scholar]
- 22.Saeed M, Scheel TK, Gottwein JM, Marukian S, Dustin LB, Bukh J, Rice CM. 2012. Efficient replication of genotype 3a and 4a hepatitis C virus replicons in human hepatoma cells. Antimicrob Agents Chemother 56:5365–5373. doi: 10.1128/AAC.01256-12. [DOI] [PMC free article] [PubMed] [Google Scholar]
- 23.Prichard MN, Prichard LE, Shipman C Jr. 1993. Strategic design and three-dimensional analysis of antiviral drug combinations. Antimicrob Agents Chemother 37:540–545. doi: 10.1128/AAC.37.3.540. [DOI] [PMC free article] [PubMed] [Google Scholar]
- 24.Chou TC, Talalay P. 1984. Quantitative analysis of dose-effect relationships: the combined effects of multiple drugs or enzyme inhibitors. Adv Enzyme Regul 22:27–55. doi: 10.1016/0065-2571(84)90007-4. [DOI] [PubMed] [Google Scholar]
- 25.Lin C, Lin K, Luong YP, Rao BG, Wei YY, Brennan DL, Fulghum JR, Hsiao HM, Ma S, Maxwell JP, Cottrell KM, Perni RB, Gates CA, Kwong AD. 2004. In vitro resistance studies of hepatitis C virus serine protease inhibitors, VX-950 and BILN 2061: structural analysis indicates different resistance mechanisms. J Biol Chem 279:17508–17514. doi: 10.1074/jbc.M313020200. [DOI] [PubMed] [Google Scholar]
- 26.Nguyen TT, Gates AT, Gutshall LL, Johnston VK, Gu B, Duffy KJ, Sarisky RT. 2003. Resistance profile of a hepatitis C virus RNA-dependent RNA polymerase benzothiadiazine inhibitor. Antimicrob Agents Chemother 47:3525–3530. doi: 10.1128/AAC.47.11.3525-3530.2003. [DOI] [PMC free article] [PubMed] [Google Scholar]
- 27.Robida JM, Nelson HB, Liu Z, Tang H. 2007. Characterization of hepatitis C virus subgenomic replicon resistance to cyclosporine in vitro. J Virol 81:5829–5840. doi: 10.1128/JVI.02524-06. [DOI] [PMC free article] [PubMed] [Google Scholar]
- 28.Wong KA, Worth A, Martin R, Svarovskaia E, Brainard DM, Lawitz E, Miller MD, Mo H. 2013. Characterization of hepatitis C virus resistance from a multiple-dose clinical trial of the novel NS5A inhibitor GS-5885. Antimicrob Agents Chemother 57:6333–6340. doi: 10.1128/AAC.02193-12. [DOI] [PMC free article] [PubMed] [Google Scholar]
- 29.Owens CM, Brasher BB, Polemeropoulos A, Rhodin MHJ, McAllister N, Wong KA, Jones CT, Jiang L, Lin K, Or YS. 2016. Preclinical and clinical resistance profile of EDP-239, a novel hepatitis C virus NS5A inhibitor. Antimicrob Agents Chemother 60:6216–6226. doi: 10.1128/AAC.00815-16. [DOI] [PMC free article] [PubMed] [Google Scholar]
- 30.Bliss CI. 1939. The toxicity of poisons applied jointly. Ann Appl Biol 26:585–615. doi: 10.1111/j.1744-7348.1939.tb06990.x. [DOI] [Google Scholar]
- 31.Loewe S. 1928. Die quantitativen probleme der pharmakologie. Ergebn Physiol 27:47–187. doi: 10.1007/BF02322290. [DOI] [Google Scholar]
- 32.Cheng G, Tian Y, Doehle B, Peng B, Corsa A, Lee YJ, Gong R, Yu M, Han B, Xu S, Dvory-Sobol H, Perron M, Xu Y, Mo H, Pagratis N, Link JO, Delaney W. 2016. In vitro antiviral activity and resistance profile characterization of the HCV NS5A inhibitor ledipasvir. Antimicrob Agents Chemother 60:1847–1853. doi: 10.1128/AAC.02524-15. [DOI] [PMC free article] [PubMed] [Google Scholar]