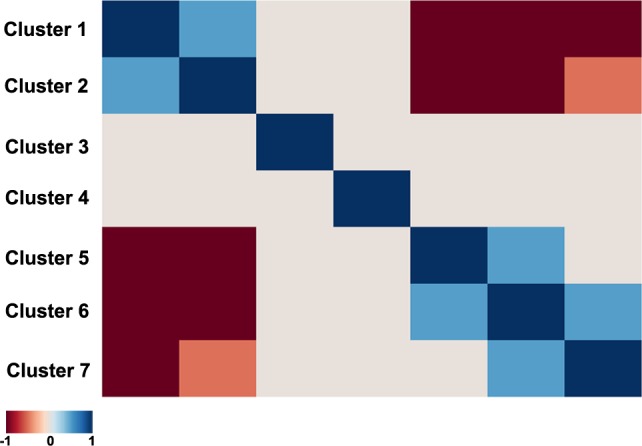
Figure 4. Heatmap of the functional interactions between the signalling pathway clusters.

Clusters are given from 1 to 7 (left to right and top down). Correlation coefficients between the Clusters activation profiles vary in the interval from -1 till 1, corresponding to variation from dark red till dark blue on the heatmap, according to the defined color key.
