

Abstract
Objective
Diet-induced obesity has been shown to alter immune function in mice, but distinguishing the effects of obesity from changes in diet composition is complicated. We hypothesized that immunological differences would exist between diet-induced obese (DIO) and obese-resistant (OB-Res) mice fed the same high-fat diet (HFD).
Methods
BALB/c mice were fed either standard chow or HFD to generate lean or DIO and OB-Res mice, respectively. Resulting mice were analyzed for serum immunologic and metabolic profiles, and cellular immune parameters.
Results
BALB/c mice on HFD can be categorized as DIO or OB-Res, based on body weight versus lean controls. DIO mice are physiologically distinct from OB-Res mice, whose serum Insulin, Leptin, GIP, and Eotaxin concentrations remain similar to lean controls. DIO mice have increased macrophage+ crown-like structures in white adipose tissue, although macrophage percentages were unchanged from OB-Res and lean mice. DIO mice also have decreased splenic CD4+ T cells, elevated serum GM-CSF, and increased splenic CD11c+ dendritic cells, but impaired dendritic cell stimulatory capacity (p < 0.05 versus lean controls). These parameters were unaltered in OB-Res mice versus lean controls.
Conclusions
Diet-induced obesity results in alterations in immune and metabolic profiles that are distinct from effects caused by HFD alone.
Keywords: Diet-induced obesity, obese, obese-resistant, immune function, dendritic cell
Introduction
Obesity is accompanied by adverse health effects that include cardiovascular disease, diabetes, and increased cancer risk (1, 2). Mounting evidence suggests that obesity is also associated with impaired immune responses to vaccinations, infections, and tumor growth (3–5), although contrary evidence does exist (6). With ~35% of the United States adult population obese (7), a better understanding of the complex immunologic implications of obesity is needed.
Models of diet-induced obese animals/diet-induced obesity (DIO), wherein animals are fed a high-fat (HFD) or other obesogenic diet, allow investigators to manipulate caloric intake and diet composition in genetically intact animals. Most HFD models utilize inbred mouse strains, with C57BL/6 being the most common (8, 9). The C57BL/6 DIO mouse model is characterized by insulin resistance, particularly in males, so permits evaluation of obesity in combination with type 2 diabetes (10). In contrast, the BALB/c strain is more resistant to developing both obesity and type 2 diabetes (11, 12). However, use of DIO BALB/c mice may at times be beneficial due to diminished confounding effects of type 2 diabetes.
Most DIO studies contain one important caveat: control groups are composed of lean mice that are fed different rodent diets. This approach renders it impossible to distinguish between effects of dietary composition on physiological outcomes versus effects of obesity per se. Evaluating these relative contributions is important, as some dietary components can alter biological function and immune responses in the absence of obesity (13, 14).
Here, we present a refinement of the DIO BALB/c model, based upon identification of a subset of genetically intact mice that are highly resistant to becoming obese. As we and others have reported, obesity has complex effects on immune responses, and dendritic cell function in particular (4, 15). Thus, we used this model to examine effects of obesity on immune and metabolic profiles of DIO and Obese-resistant (OB-Res) mice fed the same HFD. Our data illustrate that obesity alters multiple immune parameters beyond effects from HFD alone. Furthermore, we identify OB-Res BALB/c mice as important controls that lend new insight into the complex interplay of diet and obesity.
Methods
Animals and diets
Female BALB/cAnNCr and C57BL/6NCr mice were purchased (Charles River/NCI, Frederick, MD) at 7–8 weeks of age, maintained on standard chow (Teklad 7013, 18% kcal fat, 3.1 kcal/g) for 1 week then randomly assigned to standard chow or HFD (Research Diets #12492, 60% kcal fat, 5.24 kcal/g). Due to accelerated weight gain, C57BL/6NCr mice were maintained on HFD for 10 weeks to induce obesity, whereas BALB/c mice were maintained on diet for 20 weeks as previously reported (5). DUC18 TCR transgenic mice have been described (16, 17). Mice were housed five to a cage in standard static cages under pathogen-free conditions in 12:12 light:dark cycles at 25°C with ad libitum access to food and water at the University of Iowa Animal Care Facility, which is fully AALAC accredited. All animal procedures were approved by the University of Iowa IACUC. After appropriate time on feed, all mice were weighed, and the mean and standard deviation (s.d.) of lean (standard chow) groups were calculated.
Blood glucose measurement
C57BL/6NCr and BALB/c mice were maintained on standard chow or HFD as described above. Mice were fasted overnight, blood was obtained from the tail vein, and blood glucose measured via glucometer (Roche Diabetes Care).
Cytokine and chemokine evaluation by Multiplex Array
Serum samples were obtained from lean, OB-Res, and DIO mice and frozen at −80°C until use. Serum cytokine and chemokine concentrations were determined via BioPlex Pro Mouse Diabetes Assay and BioPlex Pro Mouse Cytokine Assay and run on a Bio-Rad BioPlex analyzer (Bio-Rad).
Surface staining for flow cytometry
Spleens and adipose tissue (pooled gonadal/renal fat pads) were harvested and processed as described (5, 6). Cells were stained with antibodies, then results were acquired using a BD LSR II (BD Biosciences) and analyzed with FlowJo software (Tree Star). CD19-BV510 and Vβ8.3-PE (BD Biosciences). I-Ad-A488, CD8α-A700, CD4-APC, CD11c-APC/Cy7, CD3ε-PE, CD11b-PE/Cy7, CD54-FITC, CD40-PE, H2Kd-FITC, I-Ad-PE, CD11c-biotin, SA-APC/Cy7 and TruStain FcX (BioLegend). CD86-APC (eBioscience).
T cell proliferation assay
Splenic DCs were purified from pooled lean, OB-Res, and DIO mice using CD11c microbeads (Miltenyi Biotec). DCs were pulsed with tumor extracellular signal-regulated kinase (tERK) peptide and naïve CD8+ DUC18 T cell proliferation was evaluated as described (17).
Immunohistochemistry
White adipose tissues (WAT) were stained with anti-IBA-1 (ionized calcium-binding adapter molecule 1), a defined macrophage marker (18). Tissues were examined by a veterinary pathologist using the post-examination masking method (19). To assess incidences of crown-like structures (CLS), three random WAT samples (20x magnification) were evaluated for total area and number of CLS. Values were averaged and reported as number of CLS/mm2. The number of IBA+ cells in the WAT interstitium were enumerated (n=3 random samples, 100x magnification), averaged for each tissue, and reported as macrophage number/mm2. During enumeration, solitary macrophages were recorded as a distinct pool from macrophages within CLS.
Energy balance by bomb calorimetry
Energy balance was evaluated using bomb calorimetry as described (20, 21). Briefly, mice were placed into single-mouse sized metabolic cages (Nalgene/Tecniplast) at room temperature with ad libitum access to food and water. Food intake, water intake, urine output, and fecal output were quantified to measure behavioral changes. Fecal samples were desiccated and caloric content was determined using a semi-micro bomb calorimeter (Parr). Digestive efficiency was determined as the ratio of calories absorbed to calories consumed. Energy efficiency was determined as the change in body mass divided by total calories absorbed.
Resting Metabolic Rate (RMR) evaluation by respirometry
RMR was determined using continuous respirometry as described (22, 23). Briefly, animals were placed into thermally-controlled chambers maintained at 30°C. Oxygen and carbon dioxide composition of effluent air, and chamber air flow rates (corrected to STP) during bouts of rest were used to calculate rates of oxygen consumption and carbon dioxide production. Using the equation derived from Lusk (24), RMR was calculated.
Statistical analyses
Statistical analyses were accomplished utilizing Prism, Version 6.07 (GraphPad). Gaussian distribution was assessed using D’Agostino-Pearson omnibus normality test. Data were analyzed using two-tailed unpaired Student t-tests with (carrots; ^) or without (asterisks; *) Welch’s correction (threshold of 3 s.d.), as appropriate. Non-parametric analyses were performed using two-tailed Mann-Whitney U tests (pound signs; #). Significance indicated as ^ = * = # = p < 0.05; ^^ = ** = ## = p < 0.01; ^^^ = *** = ### = p < 0.001; ^^^^ = **** = #### = p < 0.0001.
Results
Distinguishing DIO from OB-Res mice on HFD
DIO murine models are widely used to study biological and physiological implications of obesity, but comparisons to lean mice on standard chow introduce problems related to distinguishing effects of obesity from effects of diet. Previously, we noted that within BALB/c strains, individual mice showed remarkable heterogeneity to HFD, with some being highly resistant to obesity (5). Here, we leveraged this divergence to examine metabolic and immune profiles in HFD-fed DIO versus OB-Res mice.
As expected (25, 26), all C57BL/6NCr mice showed significant weight gain after 10 weeks on HFD (average weight gain versus chow controls = 25.73 gm/ mouse) (Fig. 1A). As per standard convention, these mice are referred to as DIO. In contrast, BALB/c female mice showed less dramatic and more variable weight gain on HFD, even after 20 weeks (average weight gain = 6.86 gm/mouse versus chow controls) (Fig. 1B). As previously, we defined mice with DIO as having a final body weight >3 s.d. above the mean weight of the standard chow cohort (dotted line, Fig. 1B) (5). Using this definition, 50% of BALB/c mice were classified as having DIO, versus 100% of C57BL/6NCr mice (Fig. 1A). Male BALB/c mice followed a similar trend, with 66% of mice on HFD classified as obese (data not shown). BALB/c mice that remained within one s.d. of the lean cohort’s mean weight were designated OB-Res. Onset of the DIO versus OB-Res phenotype was detectable in as few as 4–6 weeks on HFD (Fig. 1C). To determine whether these phenotypic weight differences were due to hierarchical cage status, mice showing an OB-Res or DIO phenotype were separated at 10 weeks post-HFD administration and co-housed with like counterparts (ex: OB-Res with OB-Res) for 12 additional weeks. All mice retained their original adiposity phenotypes (Fig. 1D), suggesting that intra-cage social behaviors do not substantially impact DIO status in this model. DIO mice had significantly larger gonadal and renal pads of WAT that accounted for a greater percentage of total body weight (Fig. 1E), consistent with prior findings (27).
Figure 1.

Individual examination of age-matched BALB/c mice on high fat diet identifies unique populations of DIO and OB-Res mice. (A) Body weight (g) of C57BL/6NCr mice was calculated at the end of 10 weeks for mice fed either standard chow or HFD. Dots represent individual mice. (B) Body weights of BALB/c mice at the end of 20 weeks for mice fed either standard chow or HFD. DIO mice were defined as having body weights > lean cohort mean + 3 standard deviations. OB-Res mice were defined as having body weights within 1 standard deviation of the lean cohort mean. (C) Stratification of individual BALB/c mouse body weights over the course of 20 weeks on standard or high fat diet. (D) Body weight (g) of BALB/c mice at 10 weeks of HFD administration (pre-separation) and at 22 weeks of HFD administration (post-separation). After 10 weeks on diet, mice were removed from original cages and co-housed with similar adiposity phenotypes (ex: OB-Res with OB-Res) for 12 additional weeks. Statistical significance was determined using a two-tailed Mann-Whitney U test (#p < 0.05, ##p< 0.01). (E) Gonadal and renal fat pads were removed from lean, OB-Res, and DIO mice, weighed, and the WAT weight was calculated as a percentage of total body weight. Statistical significance was determined using a two-tailed unpaired student t test (****p < 0.0001).
DIO mice have increased blood glucose, insulin, and leptin concentrations not seen in OB-Res or lean mice
Increased fasting blood glucose and elevated serum insulin and leptin concentrations are characteristic of obesity and type 2 diabetes. As reported (9, 26), DIO C57BL/6NCr mice exhibited a significant increase in fasting blood glucose compared to lean controls (Fig. 2A). Consistent with prior reports, BALB/c mice on HFD were resistant to hyperglycemia (28) (Fig. 2B). Although the absolute concentrations (mean = 62.8 mg/dL for DIO BALB/c mice) were lower than those observed for DIO C57BL/6NCr mice (mean = 115.6 mg/dL), DIO BALB/c mice did show elevated fasting blood glucose concentrations versus lean controls (Fig. 2B). BALB/c OB-Res mice had blood glucose levels that were equivalent to lean counterparts, despite being on HFD for 20 weeks. In addition, BALB/c DIO mice had increased serum insulin (Fig. 2C) and leptin (Fig. 2D) as compared to OB-Res mice and lean controls (Figs. 2C/2D). Thus, only DIO mice on HFD showed key hallmarks of obesity, whereas OB-Res mice on HFD resembled lean chow-fed controls.
Figure 2.

DIO mice have hallmarks of obesity not seen in OB-Res mice on HFD. (A) C57BL/6NCr mice were maintained on feed for 10 weeks. Mice were then fasted overnight and serum blood glucose concentration (mg/dL) was calculated. Statistical significance was determined using a two-tailed unpaired student t test (****p < 0.0001). (B) BALB/c mice were maintained on feed for 20 weeks. Mice were then fasted overnight and serum blood glucose concentration (mg/dL) was calculated. Statistical significance was determined using a two-tailed Mann-Whitney U test (##p < 0.01). (C) BALB/c serum was analyzed to obtain concentrations of insulin. Statistical significance was determined using a two-tailed unpaired student t test with Welch’s correction (^^p < 0.01). (D) BALB/c serum was analyzed to obtain concentrations of leptin. Statistical significance was determined using a two-tailed unpaired student t test with Welch’s correction (^^^p < 0.001).
OB-Res mice are resistant to weight gain due to increased energy expenditure relative to DIO mice
Leptin is an adipokine that regulates food intake and satiety; therefore decreased serum leptin in BALB/c OB-Res mice suggested that their phenotype might be due to altered food consumption or digestive efficiency. To investigate this, BALB/c DIO and OB-Res mice were singly housed in metabolic cages and given ad libitum access to HFD. Food intake, as measured in both g/day and kcal/day, was equivalent in DIO and OB-Res mice (Table I). Fecal output was also comparable. Once food is consumed, it must be digested and metabolized into useable energy forms. Therefore, we measured calories absorbed from food by DIO versus OB-Res mice using bomb calorimetry, and found these to be equivalent, indicating comparable digestive efficiency in OB-Res and DIO mice. However, energy efficiency (the amount of weight gain for any given calorie consumed) was significantly lower in OB-Res mice than in DIO mice (mean 3.65 vs 10.09 mg BW per kcal absorbed, p = 0.006). This means that for each calorie consumed, OB-Res mice used a smaller fraction for weight gain. Thus, the total energy expenditure of OB-Res animals is significantly greater than for DIO mice.
Table I.
Energy balance evaluation of DIO and OB-Res mice reveals differences in energy efficiency. BALB/c mice were maintained on high fat diet for 20 weeks. Mice (n= 13 DIO and 12 OB-Res) were then singly housed in metabolic cages for 3–5 days and given ad libitum access to high fat diet chow. Caloric densities of food and fecal samples were determined by bomb calorimetry.
| DIO | OB-Res | t-test p= | |
|---|---|---|---|
| Body weight (g) | |||
| 38.62 | 25.35 | 0.001 | |
| sem | 2.04 | 1.81 | |
| Food intake (g/day) | |||
| 2.44 | 2.45 | 0.990 | |
| sem | 0.09 | 0.39 | |
| Food intake (kcal/day) | |||
| 14.15 | 14.18 | 0.990 | |
| sem | 0.5 | 2.27 | |
| Fecal output (g/day) | |||
| 0.42 | 0.42 | 0.930 | |
| sem | 0.03 | 0.06 | |
| Fecal output (kcal/day) | |||
| 1.80 | 1.85 | 0.873 | |
| sem | 0.17 | 0.23 | |
| Calories absorbed (kcal/day) | |||
| 12.34 | 12.25 | 0.967 | |
| sem | 0.57 | 2.06 | |
| Digestive Efficiency (% consumed) | |||
| 87.30 | 85.90 | 0.595 | |
| sem | 1.43 | 2.09 | |
| Energy efficiency (D mg BW/kcal absorbed) | |||
| 10.09 | 3.65 | 0.006 | |
| sem | 1.01 | 1.4 |
Extending these data, aerobic resting metabolic rate (RMR) was determined using respirometry at thermoneutrality. DIO mice (n=15, 37.41±0.99 g) and OB-Res mice (n=18, 26.20±0.82 g, P<0.01) exhibited similar respiratory exchange ratios (RER; 0.956±0.034 vs 0.951±0.038, P=0.92). Although OB-Res mice exhibited a reduced metabolic rate compared to DIO mice when no body mass normalization was performed (0.202±0.012 vs 0.168±0.008 kcal/hr, P=0.03), correction for the difference in body mass by ANCOVA (regression homogeneity P=0.456) illustrated a normal aerobic RMR in OB-Res mice (0.179±0.013 vs 0.197±0.015 kcal/hr, P=0.460). Thus, an increase in aerobic RMR is possible in OB-Res mice, but future studies examining mice from each group of matched body size are required to fully elucidate the relative contribution of aerobic RMR to the weight gain resistance of OB-Res mice. The current data do, however, support the concept that increased energy expenditure of OB-Res mice may include an increase in anaerobic RMR or an increase in physical activity-mediated energy expenditure.
Serum protein profile analysis reveals numerous differences in DIO versus lean mice that are not present in OB-Res mice
To more fully understand the physiologic similarities and differences among DIO, OB-Res, and lean mice, we analyzed serum proteins of interest. When metabolism-associated proteins such as resistin, gastric inhibitory polypeptide (GIP), and glucagon-like peptide-1 (GLP-1) were examined in a non-fasted state, DIO mice showed statistical differences relative to lean chow-fed controls (Fig. 3). Although OB-Res mice displayed a profile with no statistical differences versus either lean controls or DIO mice for resistin or GIP, there was a general trend toward midpoint values between these two extremes (Fig. 3). OB-Res mice mirrored DIO mice in terms of GLP-1 concentration. We then analyzed pro-inflammatory proteins such as eotaxin (CCL11) and LPS-induced CXC chemokine (LIX, or CXCL5), both of which are elevated with obesity (29, 30). DIO mice had increased concentrations relative to lean controls, whereas OB-Res mice had no statistical changes. For other proteins, such as TNFα and IL-17, we found no differences among the three groups (data not shown). Serum IP-10 (CXCL10), which regulates effector T cell trafficking, was elevated in DIO mice compared to OB-Res mice, but not lean controls. Thus, only GLP-1 was altered significantly by HFD alone, but multiple serum proteins were altered in obese mice.
Figure 3.

Serum analyses reveal unique obesogenic and proinflammatory differences between DIO, OB-Res, and lean BALB/c mice. Serum was collected from BALB/c mice maintained on standard chow or HFD for 20 weeks and analyzed via Multiplex array where n= 8 lean mice, 13 OB-Res, and 10 DIO mice. Statistical significance was determined using either a two-tailed unpaired student t test (*p < 0.05), or a two-tailed Mann-Whitney U test (#p < 0.05, ##p < 0.01, ###p < 0.001), as appropriate.
Increased numbers of macrophage-containing crown-like structures (CLS) in WAT occur in DIO but not OB-Res mice
Visceral WAT contains both resident and infiltrating leukocyte populations that change in response to obesity (31, 32). Regardless of diet (HFD or chow) or weight category (DIO, OB-Res, lean), all groups of BALB/c mice showed comparable percentages of each leukocyte population evaluated (CD4+ T cells, CD8+ T cells, CD19+ B cells, CD11c+/I-Ad+/ CD11blow dendritic cells [DC], CD11b+/I-Ad+/CD11clow macrophages) in the stromal vascular fraction of dissociated visceral WAT after 20 weeks on diet (Fig. 4).
Figure 4.

No differences in leukocytic infiltration into WAT in DIO, OB-Res or lean mice. BALB/c mice (n= 9–10 mice per group) were maintained on standard chow or high fat diet for 20 weeks and gonadal and renal fat pads were collected. The stromal vascular fraction was then isolated and percentages of CD4+ and CD8+ T cells, CD19+ B cells, CD11c+ DC (CD11c+/I-Ad+/ CD11bint-low), and CD11b+ (CD11b+/I-Ad+/CD11clow) macrophages were determined by flow cytometry.
However, cell percentages in dissociated tissue do not convey information regarding leukocyte localization. For example, macrophages in WAT can be found within crown-like structures (CLS) surrounding necrotic adipocytes. Immunohistochemical staining of gonadal adipose tissue sections revealed that IBA1+ macrophages were readily detectable in tissues from lean, OB-Res, and DIO mice (Fig. 5A, black arrows). As expected, adipose tissue from DIO mice showed macrophage clustering in CLS (Fig. 5A, red arrow) (33). No differences were found in total IBA1+ macrophage numbers among DIO, OB-Res, and lean mice (Fig. 5B). DIO mice showed increased CLS relative to chow-fed lean controls, whereas OB-Res mice resembled lean mice with low CLS numbers. Thus, DIO mice have increased organization of macrophages into CLS within WAT, relative to both OB-Res mice and chow-fed lean controls.
Figure 5.

Macrophage localization within CLS in WAT distinguishes DIO mice from OB-Res and lean counterparts. (A) BALB/c mice were maintained on standard chow or high fat diet for 20 weeks and gonadal and renal fat pads were collected. Immunohistochemical staining of IBA1+ macrophages in WAT was performed. Black arrows indicate single IBA1+ macrophages, red arrow indicates IBA1+ macrophages within a representative crown-like structure (CLS). (B) Enumeration of total IBA1+ macrophages and CLS in WAT from n= 5 each lean, OB-Res and DIO mice. Statistical significance was determined using a two-tailed Mann-Whitney U test (#p < 0.05, ##p < 0.01).
DIO mice have alterations in splenocyte composition not present in OB-Res or lean mice
We previously demonstrated that DIO BALB/c mice have elevated percentages of splenic DCs (5), but we did not examine other leukocyte populations or contributions of diet versus obesity on splenocyte composition. Here, we determined that DIO mice had decreased percentages of splenic CD4+ T cells, but increased percentages of splenic CD11chigh/MHC II high DCs relative to either OB-Res or chow-fed lean mice (Fig. 6A). The percentages of CD4+ T cells and CD11chigh/MHC II high DC were equivalent in OB-Res and lean mice. To evaluate potential causes for the increased DC percentages in DIO mice, we examined serum GM-CSF, a potent mediator of DC maturation. DIO mice had elevated concentrations of GM-CSF relative to either HFD-fed OB-Res mice or chow-fed lean controls (Fig. 6B). These data suggest that administration of HFD in the absence of obesity has minimal impact on baseline splenocyte composition, but that obesity alters both splenic CD4+ T cell and CD11c+ DC percentages.
Figure 6.

DIO mice have immune alterations not present in OB-Res or lean mice. (A) BALB/c mice (n= 10 per group) were maintained on standard chow or HFD for 20 weeks prior to spleen harvest. Percentages of CD4+ and CD8+ T cells, CD19+ B cells, CD11b+ (CD11b+/I-Ad+/CD11clow) macrophages, and CD11chigh/I-Ad+ dendritic cells were determined by flow cytometric analysis. Statistical significance was determined using a two-tailed unpaired student t test (*p < 0.05, **p < 0.01) or a two-tailed Mann-Whitney U test (##p < 0.01), as appropriate. (B) Serum was collected from indicated mice (n= 8 lean mice, 13 OB-Res, and 10 DIO mice) and analyzed via Multiplex for concentrations of granulocyte macrophage colony-stimulating factor (GM-CSF) (pg/mL). Statistical significance was determined using a two-tailed Mann Whitney U test (##p < 0.01).
OB-Res mice on HFD maintain splenic DC function
We previously showed that, relative to DCs from lean chow-fed controls, splenic DCs from DIO mice are functionally deficient (5). Here we asked whether this impairment is present only in obese mice, or in all mice on HFD. We first examined the phenotype of splenic DC from OB-Res, lean, and DIO mice. Although we found increased MHC II expression on OB-Res mice compared to lean counterparts (Fig. 7A), expression of all other surface markers examined was comparable between DIO, OB-Res, and lean mice. In terms of DC ability to induce robust proliferation of naive CD8+ T cells, splenic DC from OB-Res mice were comparable to DC from lean mice (Fig. 7B). Splenic DC from DIO mice had reduced stimulatory capacity relative to both OB-Res and lean mice. Thus, the increases in circulating GM-CSF, elevated percentages of splenic DC, and the loss of splenic DC stimulatory capacity in DIO mice are not due simply to the change in diet from standard chow to HFD, but are a consequence of obesity.
Figure 7.
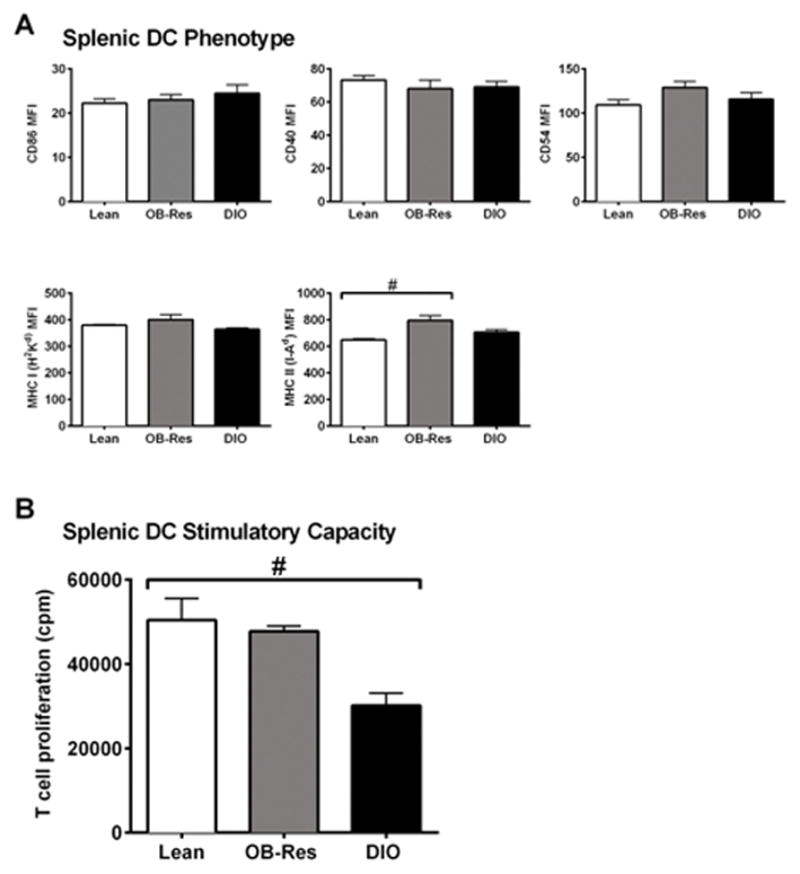
Obesity, but not HFD administration, is associated with impaired DC stimulatory capacity. (A) Expression of surface markers CD86, CD40, CD54, MHC Class I (H-2Kd) and MHC Class II (I-Ad) on gated splenic CD11chigh DC were analyzed by flow cytometry. Statistical significance was determined using a two-tailed Mann-Whitney U test (#p < 0.05). (B) CD11chigh / MHC II+/ Gr-1neg splenic DC were sort-purified from indicated mice, pulsed with exogenous peptide, then used to stimulate naive antigen-specific CD8+ T cells. T cell proliferation was measured by incorporation of 3H-thymidine (counts per minute) at 72 hours. Data are pooled from 2–5 individual experiments, with 2–3 mice pooled per experiment to generate sufficient numbers of DC. Statistical significance was determined by using a two-tailed Mann-Whitney U test (#p < 0.05).
Discussion
Here we demonstrate that obesity, and not merely HFD administration, alters immune function and metabolic profiles in inbred BALB/c mice. Given the prevalence of obesity in the United States, an increasing number of reports are examining the effects of obesity on immune function. The design of our study was unique in that it allowed us to examine genetically intact obese and non-obese mice maintained on the same HFD, thereby removing contributions from altered diet composition. This is important, as specific dietary components are known to influence immune responses (13, 14), raising the possibility that all or part of the previously reported effects of DIO could be due to changes in dietary composition alone. Our identification of OB-Res mice represents an important refinement to current murine DIO models, as it provides researchers a tool with which to dissect contributions of dietary composition versus obesity as potential causative factors of biological outcomes. However, this heterogeneous development of DIO may not be present in all inbred mouse strains. We did not see an OB-Res phenotype in C57BL/6NCr mice (Fig. 1A), an inbred strain known for having high susceptibility to DIO. Thus, our findings highlight the uniqueness of BALB/c mice for studying DIO without the confounding variables of genetic manipulation.
The BALB/c OB-Res subset described here remains statistically equivalent in weight to lean mice fed standard chow, even after 20 weeks on HFD. This disparity in body weight and visceral adiposity between DIO and OB-Res mice was not due to differences in energy intake (food intake or digestive efficiency), but instead appeared to be largely due to differences in energy expenditure, evidenced by reduced energy efficiency in OB-Res mice (Table I). Additional studies using respirometry indirectly implicated mechanisms of energy expenditure such as increased activity or anaerobic processes. We previously demonstrated that exposure of C57BL/6J mice to a 45% HFD causes a specific loss of anaerobic RMR (34). Further, we demonstrated that shifts in the gut microbiome can alter anaerobic RMR to cause excessive weight gain (20). Thus, in our current study the difference in energy expenditure between DIO and OB-Res groups may reflect a difference in maintenance/gain of anaerobic RMR in OB-Res mice. As individual DIO and OB-Res mice were cage littermates and were co-housed for >20 weeks, it is unlikely that gut dysbiosis accounts for changes in weight gain. Mice exhibit coprophagia, so co-housed mice typically have similar gut microbiomes. At present, the behavioral, biological and/or metabolic causes for differences in energy expenditure and the subsequent development of DIO versus OB-Res status remain unknown. Future studies to dissect the relative contributions of aerobic versus anaerobic RMR, the gut microbiome, physical activity, and potential stress responses to the OB-Res phenotype are required.
The effects of obesity on immune function are likely complex and highly dependent upon diet composition. Reports have shown that immune function can be impacted by physical activity (35, 36), and stress hormones (i.e., glucocorticoids) (37); therefore, it is possible that immune alterations of OB-Res versus DIO hosts could also be attributed to increased physical activity and/or stress responses. We previously demonstrated that immune responses to renal tumors are impaired in DIO BALB/c, as fewer effector CD8+ T cells infiltrate tumor-bearing kidneys (5). Others have reported impaired lymphatic drainage and DC migration to lymph nodes (38), and heightened/pathogenic CD8+ T cells in the lung after influenza challenge (39) in DIO versus chow-fed lean C57BL/6 mice, and alterations in lung metabolomic signatures in genetically modified obese versus wild type mice on chow diet (40). In contrast, Khan et al. found no changes in memory CD8+ T cell responses in DIO C57BL/6, BALB/c, or outbred Swiss Webster mice following viral challenge with either LCMV or influenza (6). In each of these prior studies, including our own, DIO mice on HFD were compared to lean mice on standard chow. The use of OB-Res mice, as described in our current study, will add an important new tool to future studies on DIO, as inclusion of this group will permit identification of immunological changes caused by dietary composition, versus outright obesity.
Conclusions
Our current study provides two main advances to our understanding of the biological implications of obesity: 1) we refined the BALB/c model of DIO so as to study OB-Res animals on the same HFD, and 2) we illustrate that obesity alters multiple parameters of immune function even when diet is controlled. Moving forward, highly obese-resistant BALB/c mice could be utilized to further delineate the immunological and broader biological consequences of obesity versus diet.
What is already known about this subject?
Murine models of high fat diet-induced obesity have been used to describe changes in immune function with obesity onset.
Controls for diet-induced obesity models typically include mice on standard chow.
Changes in diet composition in the absence of obesity can alter immune function; thus prior conclusions based upon comparison of high fat diet-induced obese mice to lean mice on standard chow may be erroneously describing effects of diet rather than obesity.
What does this study add?
We provide a refinement to diet-induced obesity models, via characterization of a subset of obese-resistant mice on high fat diet.
When diet is controlled, obesity causes multiple systemic alterations in metabolic proteins and cytokines.
When diet is controlled, obesity causes multiple changes in cellular immune cell composition and function.
Acknowledgments
Funding: NIH grant # R01CA181088 to LAN, NIH grant #HL084207 and American Diabetes Association grant #1-14-BS-079 to JLB, NIH/NCI CPCTP R25 grant #CA47888 to SKB.
The authors would like to thank Drs. Aliasger Salem and David Lubaroff for critical input to this project.
Abbreviations
- HFD
high fat diet
- DIO
diet-induced obesity or diet-induced obese
- OB-res
obese-resistant
- DC
dendritic cell
- WAT
white adipose tissue
Footnotes
Disclosure(s): The authors have no conflicts of interest to disclose.
Author Contributions: SKB: analyzed data and wrote manuscript; CMB performed experiments, analyzed data, and wrote manuscript; NAP performed experiments and analyzed data; MBF wrote manuscript; DKM performed experiments, analyzed data, and wrote manuscript; JLG performed experiments, analyzed data, and wrote manuscript; LAN performed experiments, analyzed data, and wrote manuscript.
References
- 1.Chehval V, Norian LA. Effects of obesity on immune responses to renal tumors. Immunol Res. 2014;59(1–3):211–9. doi: 10.1007/s12026-014-8533-0. [DOI] [PubMed] [Google Scholar]
- 2.Nakamura K, Fuster JJ, Walsh K. Adipokines: a link between obesity and cardiovascular disease. J Cardiol. 2014;63(4):250–9. doi: 10.1016/j.jjcc.2013.11.006. [DOI] [PMC free article] [PubMed] [Google Scholar]
- 3.Milner JJ, Beck MA. The impact of obesity on the immune response to infection. Proc Nutr Soc. 2012;71(2):298–306. doi: 10.1017/S0029665112000158. [DOI] [PMC free article] [PubMed] [Google Scholar]
- 4.Sheridan PA, Paich HA, Handy J, Karlsson EA, Hudgens MG, Sammon AB, et al. Obesity is associated with impaired immune response to influenza vaccination in humans. Int J Obes (Lond) 2012;36(8):1072–7. doi: 10.1038/ijo.2011.208. [DOI] [PMC free article] [PubMed] [Google Scholar]
- 5.James BR, Tomanek-Chalkley A, Askeland EJ, Kucaba T, Griffith TS, Norian LA. Diet-induced obesity alters dendritic cell function in the presence and absence of tumor growth. J Immunol. 2012;189(3):1311–21. doi: 10.4049/jimmunol.1100587. [DOI] [PMC free article] [PubMed] [Google Scholar]
- 6.Khan SH, Hemann EA, Legge KL, Norian LA, Badovinac VP. Diet-induced obesity does not impact the generation and maintenance of primary memory CD8 T cells. J Immunol. 2014;193(12):5873–82. doi: 10.4049/jimmunol.1401685. [DOI] [PMC free article] [PubMed] [Google Scholar]
- 7.Yang L, Colditz GA. Prevalence of Overweight and Obesity in the United States, 2007–2012. JAMA Intern Med. 2015;175(8):1412–3. doi: 10.1001/jamainternmed.2015.2405. [DOI] [PMC free article] [PubMed] [Google Scholar]
- 8.Pettersson US, Walden TB, Carlsson PO, Jansson L, Phillipson M. Female mice are protected against high-fat diet induced metabolic syndrome and increase the regulatory T cell population in adipose tissue. PLoS One. 2012;7(9):e46057. doi: 10.1371/journal.pone.0046057. [DOI] [PMC free article] [PubMed] [Google Scholar]
- 9.Surwit RS, Feinglos MN, Rodin J, Sutherland A, Petro AE, Opara EC, et al. Differential effects of fat and sucrose on the development of obesity and diabetes in C57BL/6J and A/J mice. Metabolism. 1995;44(5):645–51. doi: 10.1016/0026-0495(95)90123-x. [DOI] [PubMed] [Google Scholar]
- 10.Surwit RS, Kuhn CM, Cochrane C, McCubbin JA, Feinglos MN. Diet-induced type II diabetes in C57BL/6J mice. Diabetes. 1988;37(9):1163–7. doi: 10.2337/diab.37.9.1163. [DOI] [PubMed] [Google Scholar]
- 11.Fearnside JF, Dumas ME, Rothwell AR, Wilder SP, Cloarec O, Toye A, et al. Phylometabonomic patterns of adaptation to high fat diet feeding in inbred mice. PLoS One. 2008;3(2):e1668. doi: 10.1371/journal.pone.0001668. [DOI] [PMC free article] [PubMed] [Google Scholar]
- 12.Marcelin G, Liu SM, Schwartz GJ, Chua SC., Jr Identification of a loss-of-function mutation in Ube2l6 associated with obesity resistance. Diabetes. 2013;62(8):2784–95. doi: 10.2337/db12-1054. [DOI] [PMC free article] [PubMed] [Google Scholar]
- 13.Larsen J, Weile C, Antvorskov JC, Engkilde K, Nielsen SM, Josefsen K, et al. Effect of dietary gluten on dendritic cells and innate immune subsets in BALB/c and NOD mice. PLoS One. 2015;10(3):e0118618. doi: 10.1371/journal.pone.0118618. [DOI] [PMC free article] [PubMed] [Google Scholar]
- 14.Vaid M, Singh T, Prasad R, Elmets CA, Xu H, Katiyar SK. Bioactive grape proanthocyanidins enhance immune reactivity in UV-irradiated skin through functional activation of dendritic cells in mice. Cancer Prev Res (Phila) 2013;6(3):242–52. doi: 10.1158/1940-6207.CAPR-12-0320. [DOI] [PMC free article] [PubMed] [Google Scholar]
- 15.Zlotnikov-Klionsky Y, Nathansohn-Levi B, Shezen E, Rosen C, Kagan S, Bar-On L, et al. Perforin-Positive Dendritic Cells Exhibit an Immuno-regulatory Role in Metabolic Syndrome and Autoimmunity. Immunity. 2015;43(4):776–87. doi: 10.1016/j.immuni.2015.08.015. [DOI] [PubMed] [Google Scholar]
- 16.Hanson HL, Donermeyer DL, Ikeda H, White JM, Shankaran V, Old LJ, et al. Eradication of established tumors by CD8+ T cell adoptive immunotherapy. Immunity. 2000;13(2):265–76. doi: 10.1016/s1074-7613(00)00026-1. [DOI] [PubMed] [Google Scholar]
- 17.Norian LA, Rodriguez PC, O’Mara LA, Zabaleta J, Ochoa AC, Cella M, et al. Tumor-infiltrating regulatory dendritic cells inhibit CD8+ T cell function via L-arginine metabolism. Cancer Res. 2009;69(7):3086–94. doi: 10.1158/0008-5472.CAN-08-2826. [DOI] [PMC free article] [PubMed] [Google Scholar]
- 18.Meyerholz DK, Lambertz AM, Reznikov LR, Ofori-Amanfo GK, Karp PH, McCray PB, Jr, et al. Immunohistochemical Detection of Markers for Translational Studies of Lung Disease in Pigs and Humans. Toxicol Pathol. 2015 doi: 10.1177/0192623315609691. [DOI] [PMC free article] [PubMed] [Google Scholar]
- 19.Gibson-Corley KN, Olivier AK, Meyerholz DK. Principles for valid histopathologic scoring in research. Vet Pathol. 2013;50(6):1007–15. doi: 10.1177/0300985813485099. [DOI] [PMC free article] [PubMed] [Google Scholar]
- 20.Bahr SM, Weidemann BJ, Castro AN, Walsh JW, deLeon O, Burnett CM, et al. Risperidone-induced weight gain is mediated through shifts in the gut microbiome and suppression of energy expenditure. EBioMedicine. 2015;2(11):1725–34. doi: 10.1016/j.ebiom.2015.10.018. [DOI] [PMC free article] [PubMed] [Google Scholar]
- 21.Fink BD, Herlein JA, Guo DF, Kulkarni C, Weidemann BJ, Yu L, et al. A mitochondrial-targeted coenzyme q analog prevents weight gain and ameliorates hepatic dysfunction in high-fat-fed mice. J Pharmacol Exp Ther. 2014;351(3):699–708. doi: 10.1124/jpet.114.219329. [DOI] [PMC free article] [PubMed] [Google Scholar]
- 22.Grobe JL, Buehrer BA, Hilzendeger AM, Liu X, Davis DR, Xu D, et al. Angiotensinergic signaling in the brain mediates metabolic effects of deoxycorticosterone (DOCA)-salt in C57 mice. Hypertension. 2011;57(3):600–7. doi: 10.1161/HYPERTENSIONAHA.110.165829. [DOI] [PMC free article] [PubMed] [Google Scholar]
- 23.Weidemann BJ, Voong S, Morales-Santiago FI, Kahn MZ, Ni J, Littlejohn NK, et al. Dietary Sodium Suppresses Digestive Efficiency via the Renin-Angiotensin System. Sci Rep. 2015;5:11123. doi: 10.1038/srep11123. [DOI] [PMC free article] [PubMed] [Google Scholar]
- 24.Lusk G. The elements of the science of nutrition. 4. Vol. 2. Philadelphia London: W. B. Saunders company; 1928. pp. 1pp. 13–844. [Google Scholar]
- 25.Montgomery MK, Hallahan NL, Brown SH, Liu M, Mitchell TW, Cooney GJ, et al. Mouse strain-dependent variation in obesity and glucose homeostasis in response to high-fat feeding. Diabetologia. 2013;56(5):1129–39. doi: 10.1007/s00125-013-2846-8. [DOI] [PubMed] [Google Scholar]
- 26.Nishikawa S, Yasoshima A, Doi K, Nakayama H, Uetsuka K. Involvement of sex, strain and age factors in high fat diet-induced obesity in C57BL/6J and BALB/cA mice. Exp Anim. 2007;56(4):263–72. doi: 10.1538/expanim.56.263. [DOI] [PubMed] [Google Scholar]
- 27.Yang Y, Smith DL, Jr, Keating KD, Allison DB, Nagy TR. Variations in body weight, food intake and body composition after long-term high-fat diet feeding in C57BL/6J mice. Obesity (Silver Spring) 2014;22(10):2147–55. doi: 10.1002/oby.20811. [DOI] [PMC free article] [PubMed] [Google Scholar]
- 28.Kim HY, Kim M, Park HM, Kim J, Kim EJ, Lee CH, et al. Lysophospholipid profile in serum and liver by high-fat diet and tumor induction in obesity-resistant BALB/c mice. Nutrition. 2014;30(11–12):1433–41. doi: 10.1016/j.nut.2014.04.013. [DOI] [PubMed] [Google Scholar]
- 29.Nunemaker CS, Chung HG, Verrilli GM, Corbin KL, Upadhye A, Sharma PR. Increased serum CXCL1 and CXCL5 are linked to obesity, hyperglycemia, and impaired islet function. J Endocrinol. 2014;222(2):267–76. doi: 10.1530/JOE-14-0126. [DOI] [PMC free article] [PubMed] [Google Scholar]
- 30.Vasudevan AR, Wu H, Xydakis AM, Jones PH, Smith EO, Sweeney JF, et al. Eotaxin and obesity. J Clin Endocrinol Metab. 2006;91(1):256–61. doi: 10.1210/jc.2005-1280. [DOI] [PubMed] [Google Scholar]
- 31.Lumeng CN, Bodzin JL, Saltiel AR. Obesity induces a phenotypic switch in adipose tissue macrophage polarization. J Clin Invest. 2007;117(1):175–84. doi: 10.1172/JCI29881. [DOI] [PMC free article] [PubMed] [Google Scholar]
- 32.Nishimura S, Manabe I, Nagasaki M, Eto K, Yamashita H, Ohsugi M, et al. CD8+ effector T cells contribute to macrophage recruitment and adipose tissue inflammation in obesity. Nat Med. 2009;15(8):914–20. doi: 10.1038/nm.1964. [DOI] [PubMed] [Google Scholar]
- 33.Murano I, Barbatelli G, Parisani V, Latini C, Muzzonigro G, Castellucci M, et al. Dead adipocytes, detected as crown-like structures, are prevalent in visceral fat depots of genetically obese mice. J Lipid Res. 2008;49(7):1562–8. doi: 10.1194/jlr.M800019-JLR200. [DOI] [PubMed] [Google Scholar]
- 34.Burnett CM, Grobe JL. Dietary effects on resting metabolic rate in C57BL/6 mice are differentially detected by indirect (O2/CO2 respirometry) and direct calorimetry. Mol Metab. 2014;3(4):460–4. doi: 10.1016/j.molmet.2014.03.003. [DOI] [PMC free article] [PubMed] [Google Scholar]
- 35.Pedersen L, Idorn M, Olofsson GH, Lauenborg B, Nookaew I, Hansen RH, et al. Voluntary Running Suppresses Tumor Growth through Epinephrine- and IL-6-Dependent NK Cell Mobilization and Redistribution. Cell Metab. 2016;23(3):554–62. doi: 10.1016/j.cmet.2016.01.011. [DOI] [PubMed] [Google Scholar]
- 36.Bigley AB, Rezvani K, Chew C, Sekine T, Pistillo M, Crucian B, et al. Acute exercise preferentially redeploys NK-cells with a highly-differentiated phenotype and augments cytotoxicity against lymphoma and multiple myeloma target cells. Brain Behav Immun. 2014;39:160–71. doi: 10.1016/j.bbi.2013.10.030. [DOI] [PubMed] [Google Scholar]
- 37.Smith PJ, Cousins DJ, Jee YK, Staynov DZ, Lee TH, Lavender P. Suppression of granulocyte-macrophage colony-stimulating factor expression by glucocorticoids involves inhibition of enhancer function by the glucocorticoid receptor binding to composite NF-AT/activator protein-1 elements. J Immunol. 2001;167(5):2502–10. doi: 10.4049/jimmunol.167.5.2502. [DOI] [PubMed] [Google Scholar]
- 38.Blum KS, Karaman S, Proulx ST, Ochsenbein AM, Luciani P, Leroux JC, et al. Chronic high-fat diet impairs collecting lymphatic vessel function in mice. PLoS One. 2014;9(4):e94713. doi: 10.1371/journal.pone.0094713. [DOI] [PMC free article] [PubMed] [Google Scholar]
- 39.Milner JJ, Sheridan PA, Karlsson EA, Schultz-Cherry S, Shi Q, Beck MA. Diet-induced obese mice exhibit altered heterologous immunity during a secondary 2009 pandemic H1N1 infection. J Immunol. 2013;191(5):2474–85. doi: 10.4049/jimmunol.1202429. [DOI] [PMC free article] [PubMed] [Google Scholar]
- 40.Milner JJ, Rebeles J, Dhungana S, Stewart DA, Sumner SC, Meyers MH, et al. Obesity Increases Mortality and Modulates the Lung Metabolome during Pandemic H1N1 Influenza Virus Infection in Mice. J Immunol. 2015;194(10):4846–59. doi: 10.4049/jimmunol.1402295. [DOI] [PMC free article] [PubMed] [Google Scholar]