

Abstract
The ability of cancer cells to produce lactate through aerobic glycolysis is a hallmark of cancer. In this study, we established a positional isotopic labeling and LC-MS-based method that can specifically measure the conversion of glucose to lactate in glycolysis. We show that the rate of aerobic glycolysis is closely correlated with glucose uptake and lactate production in breast cancer cells. We also found that the production of [3-13C]lactate is significantly elevated in metastatic breast cancer cells and in early stage metastatic mammary tumors in mice. Our findings may enable the development of a biomarker for the diagnosis of aggressive breast cancer.
Introduction
While normal cells produce ATP from glucose through oxidative phosphorylation, it is known that majority of cancer cells also produce ATP by converting glucose to lactate even under aerobic conditions (1). The German Scientist, Otto Warburg discovered this phenomenon, termed aerobic glycolysis or the Warburg effect, nearly a century ago (2). However, it was not appreciated until the development of the positron emission tomography (PET) scan technology. This imaging technology uses a radiolabeled glucose analog fluorodeoxyglucose (FDG) to detect metastatic lesions or assess treatment responses in patients with cancer by measuring elevated glucose uptake in vivo.
Further, results from PET scans have shown that dramatically increased glucose uptake is closely correlated with increased breast tumor aggressiveness and poor prognosis (3). Evaluation of primary breast tumors using improved PET-computed tomography or PET/CT technology also indicates that higher levels of glucose uptake are significantly correlated with several biomarkers of breast cancer, such as negative status for the presence of estrogen receptors (ER) and/or progesterone receptors (PR), higher expression of erbB-2 (Her2), as well as tumor size and lymph node metastasis (3).
Although PET or PET/CT scan results suggest that elevated glucose uptake may be one of the driving forces behind enhanced aerobic glycolysis in cancer cells, it is still unclear how closely the glucose uptake activity and glycolysis rate are correlated in cancer cells. In addition to glycolysis, lactate could also be produced from other metabolic pathways, such as the pentose phosphate pathway (PPP), during cancer cell metabolism (Fig. 1). Therefore, a method that can definitively measure the conversion of glucose to lactate through glycolysis in tumor cells is needed.
Figure 1. A summary diagram shows the metabolism of [1-13C]glucose through the glycolysis and the pentose phosphate pathway.
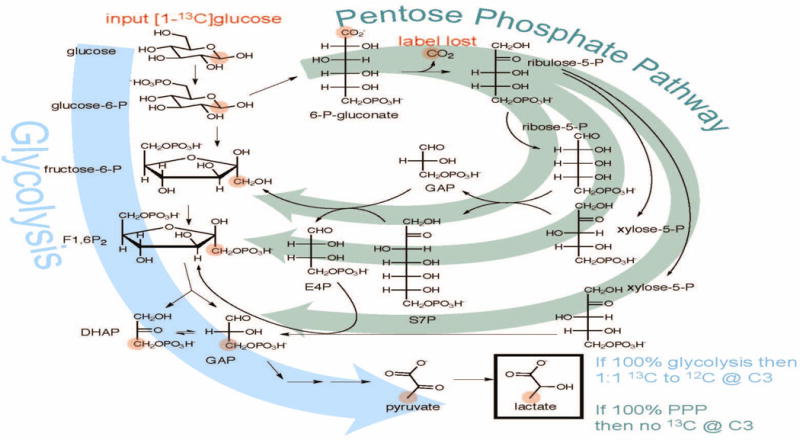
If 100% glycolysis, [1-13C]glucose will result in 1:1 13C to 12C at C3 of lactate, but all of the labeled carbon will be lost as 13CO2 if the glucose is metabolized via the pentose phosphate pathway.
Metabolomics is a field that encompasses a variety of analytical approaches that are unified with the common goal of high-throughput measurement of small molecules or metabolites found within cells and biological systems (4). Among these different analytical approaches, stable isotopic labeling or tracing is an effective method for determining the relative contribution of a substrate to a particular metabolic pathway, and mass spectrometry (MS) enables quantification of the relative abundance of molecules with different isotopic compositions.
Here, we report the establishment of a positional isotopic labeling and liquid chromatography (LC)-MS-based method that specifically measures the conversion from glucose to lactate through glycolysis in cancer cells. In addition, we also show that the rate of aerobic glycolysis obtained by this method is closely correlated with glucose uptake activity and lactate concentration in breast cancer cells. Our results further indicate significantly elevated production of [3-13C]lactate in metastatic breast cancer cells and in early stage metastatic mammary tumors in mice, which may lead to the development of a promising biomarker for invasive breast cancer.
Materials and Methods
Materials
glucose and lactate were purchased from Sigma. [1-13C]glucose and [3-13C]lactate were purchased from Cambridge Isotope Laboratories.
2-NBDG uptake assay
Glucose uptake was analyzed using a 2-NBDG (2-deoxy-2-[(7-nitro-2,1,3-benzoxadiazol-4-yl)amino]-D-glucose, a fluorescently labeled 2-deoxyglucose) glucose uptake kit from Cayman Chemical. Briefly, cells were plated at 200,000 cells/well in a 24-well plate and allowed to grow to sub-confluency. Cells were then serum starved overnight. The next morning, cells were incubated in serum- and glucose-free medium for 30 minutes. Cells were then incubated with 30 μg/mL 2-NBDG for another 30 minutes. After incubation, cells were treated with 100 nM insulin for 45 minutes. Cells were then transferred to a clear-bottom black 96 cell plate. The plate was subjected to centrifugation at 400 × g for 5 minutes. The medium was removed by aspiration and cells were washed with PBS before the addition of cell-based assay buffer (provided in the kit) to each well. Signal intensity was measured with a Synergy 2 (BioTek) microplate reader at excitation/emission= 485/535 nm.
Lactate concentration assay
Lactate was measured using the L-Lactate Assay Kit (Eton Biosciences) following the protocol from the manufacturer. Briefly, samples were diluted 1:10 with nano pure water to 50 μL total volume and then mixed with 50 μL of L-lactate assay solution provided in the kit in a 96-well plate. The plate was then incubated at 37°C for 30 minutes. The absorbance was measured at a wavelength of 492 nm with a Multiskan Ascent (Labsystems) microplate reader.
Cell culture and 1-13C-glucose labeling
MDA-MB-231 is an aggressive breast cancer cell line that has strong invasive capability, whereas MDA-MB-453 is a breast cancer cell line that displays relatively low or non-invasive capability (5, 6). These breast cancer cells were grown in DMEM (Dulbecco’s Modified Eagle Medium with 4.5 g/L D-glucose and 110 mg/L sodium pyruvate, Gibco catalog #10569) supplemented with antibiotics and 10% fetal bovine serum. Before the labeling experiment, equal cell numbers (5 × 10⁵/well) were plated on a 6-well plate and allowed to grow to subconfluency. The labeling procedure was modified from a previous report (7). Briefly, cells were serum-starved overnight. The next morning, cells were washed with PBS and cell culture medium was replaced with serum/glucose/pyruvate-free medium for 90 minutes. Following glucose/pyruvate starvation, the medium was replaced with fresh serum/glucose/pyruvate-free DMEM medium (DMEM minus D-glucose and sodium pyruvate, Gibco catalog #11966) supplemented with 10 mM [1-13C]glucose to initiate isotopic labeling, and cell culture medium (40 μL) was taken at 1 hour, 3 hour, 6 hour and 9 hour time points for further LC-MS analysis.
For this experiment, we did careful cell count to make sure that equal numbers of MDA-MB-231 and MDA-MB-453 cells were plated in the 6-well plates used for the labeling experiments. The cells were only cultured for ~30 hours before the actual experiments, which started with serum starvation (overnight), glucose/pyruvate depletion (90 minutes), and the final labeling procedure. This way, the fluctuations of cell numbers are minimal as the serum starvation halted cell growth but the starvation was not long enough to cause cell death.
Animal study
C57BL/6 female mice (Harlan) at 12 weeks of age were injected orthotopically in the fourth inguinal fat pad with ~200,000 syngeneic E0771 cells in saline or injected with saline only at the same site. E0771 is a mouse mammary tumor cell line derived from C57BL/6 mice and is metastatic in vivo when inoculated in C57BL/6 mice (8). After 3–4 weeks, mice with mammary tumors (average tumor length and width: 4.2 mm and 3.4 mm) or without were fasted overnight, and then the next morning, 0.2 mL of 1M sterile [1-13C]glucose was infused into each mouse by tail vein injection. At this early stage of the tumor development, mouse bodyweight (average = ~23 g/mouse) did not exhibit significant changes between the control and the tumor-bearing group. One hour following injection, blood was collected from the mice. Mouse serum was prepared following centrifugation and was stored at −80°C for further LC-MS analysis. Mice were later sacrificed and mouse tumors and mouse tissue samples were collected for further pathological analysis to confirm tumor grades and metastasis.
LC-MS Analysis
Cell culture medium taken or mouse serum prepared from the cell and mouse isotopic labeling experiments was mixed with 100% methanol at 2:8 (40 μL/160 μL) ratio to precipitate the proteins. After continuous mixing by vortex for 10 minutes, the mixtures were subjected to centrifugation for 10 minutes at 13,000 × g and the supernatant was used for LC-MS analysis. Briefly, 2 μL of the supernatant from each sample was injected into a ZIC-HILIC column, 100mm × 2.1mm, 3 μm from Merck SeQuant (Darmstadt, Germany) using an Ultimate 3000 UHPLC system coupled to a Q Exactive Quadrupole-Orbitrap hybrid mass spectrometer (Dionex/Thermo Fisher Scientific, Bremen, Germany) with a heated electrospray ionization (HESI) source. An eight-minute gradient using a flow rate of 400 μL/min with mobile phase A (0.1% formic acid in water) and B (0.1% formic acid in acetonitrile) with the following gradient: initial, 98% B; 0–6min, 98–40% B; 6–8min 40% B. The following MS conditions were used: full scan mode in negative, scan range of 80–1200 m/z, a resolution of 35,000 (at m/z 200), target automatic gain control (AGC) of 1×10⁶, and maximum fill times of 200 ms. Data were collected and viewed in Xcalibur software version 2.2 (Thermo Scientific, Bremen, Germany).
The identity of lactate was verified by retention time, accurate mass, and fragmentation spectra using an authentic standard. The .raw files were converted to mzXML files with msConvert tool from ProteoWizard (9). Both XCMS and ProteinTurnover software packages implemented in R were used for data processing (10). An example of the code used for data processing can be found here https://github.com/dfreund/Lactate1-13C.git. The relative rate of glycolysis for each cancer cell line was measured by the incorporation of [1-13C]glucose into [3-13C]lactate. Briefly, extracted ion chromatograms (EICs) for a specific retention time window were generated for the lactate isotopomers: [M0] =89.024 m/z (unlabeled lactate) and [M1]=90.028 (labeled [3-13C]lactate). A retention time correlation strategy is used, the EICs for each point are plotted, and linear regression is performed on the plot. The slope of the line is the ratio of intensity for the isotopomers (M1/M0, [3-13C]lactate/unlabeled lactate). The relative flux of glucose into lactate through the glycolysis pathway and the pentose phosphate pathway (PPP) was calculated using the ratios of labeled [3-13C]lactate (from glycolysis) versus [unlabeled lactate + labeled [3-13C]lactate] (from both the glycolysis and the PPP pathway) during the initial labeling phase, after depleting residual lactate in the medium by glucose/pyruvate starvation followed by a change of old medium with new medium containing [1-13C]glucose. Specifically, the following equation is used to calculate the percentage of glycolysis: 2*(M1/(M0 + M1)*100%. An amplification factor of 2 was used to reflect the isomerization or isotope exchange between DHAP and glyceraldehyde 3-P in the glycolysis pathway (Fig. 1).
Results
We measured glucose uptake activity of two breast cancer cell lines, MDA-MB-231 and MDA-MB-453 by the 2-deoxy-glucose incorporation method using a fluorescently-tagged 2-deoxyglucose, 2-NBDG. Our results show that both cell lines exhibit enhanced glucose uptake in response to insulin stimulation. Interestingly, we found that MDA-MB-231, an aggressive metastatic breast cancer cell line, exhibits much greater (~2 fold) glucose uptake activity under both basal and insulin-mediated conditions than that of MDA-MB-453, a breast cancer cell line with low metastatic capability (Fig. 2) (5, 6). To further measure the conversion of glucose to lactate through glycolysis in cancer cells, we established a stable isotopic labeling and LC-MS-based method to measure the conversion of [1-13C]glucose to [3-13C]lactate through glycolysis in cancer cells. This LC-MS method was developed for rapid separation and detection of lactate in 80% methanol extracts from medium or serum samples. Identification of lactate was confirmed with an authentic standard, verifying retention time, accurate mass, and the fragmentation or tandem mass spectra (MS/MS) (data not shown).
Figure 2. MDA-MB-231 cells exhibit higher glucose uptake than MDA-MB-453 cells.
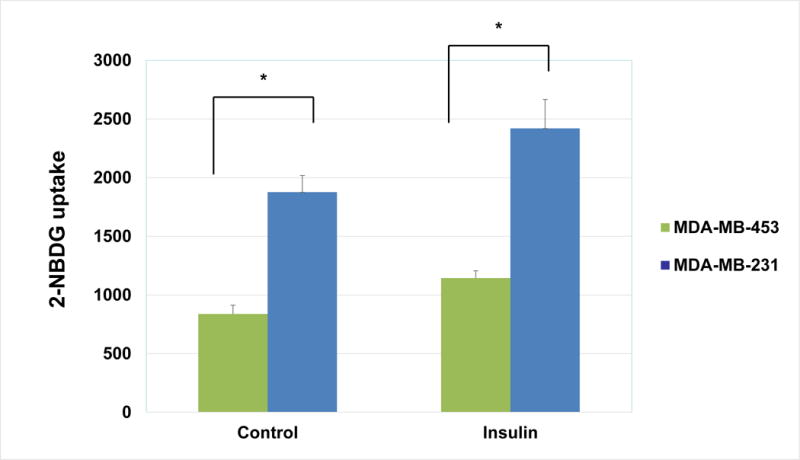
Sub-confluent cells were serum-starved overnight. Cells were then washed with PBS and cell culture medium was replaced with glucose- and serum-free medium. Fluorescently-tagged 2-NBDG (Cayman Chemical) was then added at a concentration of 30 μg/mL for 30 minutes. After addition of 2-NBDG, cells were treated with 100 nM insulin for another 45 minutes. Glucose uptake was then measured as described in Materials and Methods. The graph represents the averages of 2-NBDG glucose uptake ± SEM from 3 individual experiments (p<0.05).
Using this method, we measured the lactate production from glucose in MDA-MB-231 and MDA-MB-453 cells. Consistent with enhanced glucose uptake in breast cancer cells, our results indicate production of [3-13C]lactate from [1-13C]glucose in these breast cancer cells, even under normal aerobic growth conditions. Interestingly, we found that MDA-MB-231 cells exhibit dramatically increased production of [3-13C]lactate from [1-13C]glucose as compared to MDA-MB-453 cells (Fig. 3). We further compared lactate production in MDA-MB-231 cells versus other non- or low-metastatic breast cancer cell lines, including MDA-MB-468 and MCF-7 cells, and found that MDA-MB-231 cells also exhibit higher production of [3-13C]lactate than those cell lines (data not shown).
Figure 3. MDA-MB-231 cells exhibits higher rate of glycolysis than MDA-MB-453 cells.
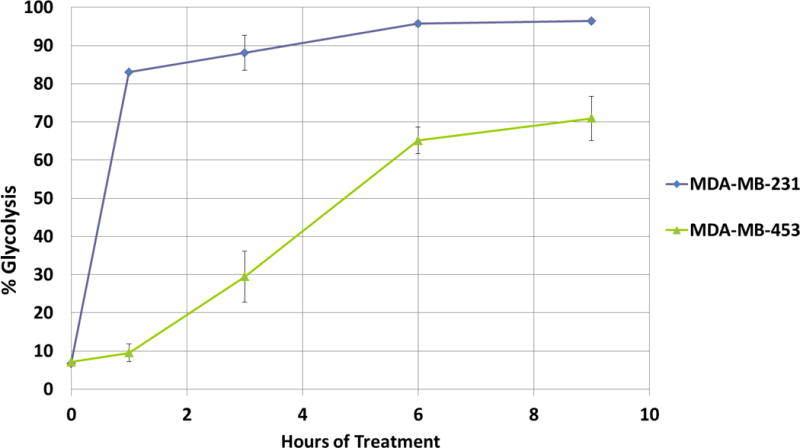
Equal number of MDA-MB-231 and MDA-MB-453 cells were cultured in DMEM medium containing 10% FBS. Sub-confluent (60–80% confluency) cells were serum starved overnight. Cells were then washed with PBS and cell culture medium was replaced with glucose/pyruvate/serum-free medium. The labeling of D-[1-13C]glucose (10 mM) was initiated following 90 minutes of glucose/pyruvate starvation. 40 μL of cell culture medium was taken at indicated time points and later diluted with 160 μL of methanol to precipitate the proteins. The LC-MS analysis of the cell culture medium was performed on a Q-Exactive mass spectrometer as described in Materials and Methods. The graph represents the averages of glycolysis rates ± SEM from 3 replicates.
Initially, it was thought that lactic acid/lactate was a waste product of glycolysis, but it is now known that elevated levels of lactate are closely correlated to increased tumor aggressiveness and poor prognosis (11, 12). To determine whether the results from the LC-MS method agree with the amount of lactate in the medium that was secreted from the cancer cells, we measured the lactate concentrations in the cell culture medium using a commercially available spectrophotometric lactate assay kit. Our results indicate that the measurements (Fig. 4) are consistent with the aerobic glycolysis rates obtained using the LC-MS method.
Figure 4. The relative rates of aerobic glycolysis in MDA-MB-231 and MDA-MB-453 cells are correlated with their lactate production.
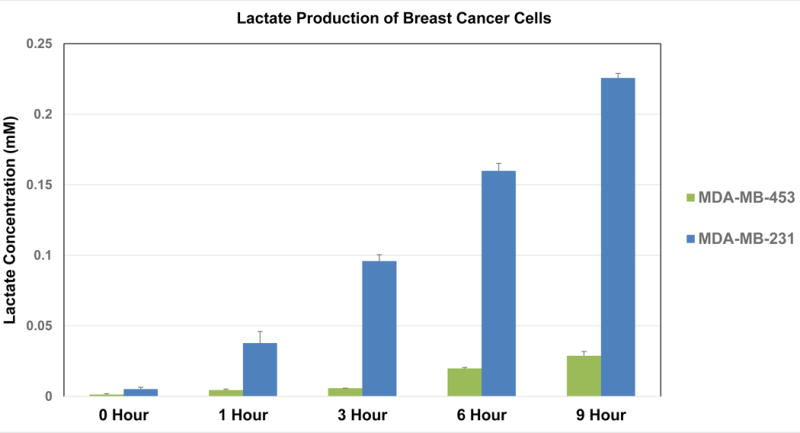
The cell culture medium obtained from the [1-13C]glucose labeling experiments performed in Fig. 3 was subjected to lactate concentration assay. As described in the Materials and Methods, lactate was measured using an L-Lactate Assay Kit following the protocol from the manufacturer. The graph represents the averages of lactate concentrations ± SEM from 3 individual experiments.
We next compared lactate production rate in C57BL/6 mice with or without mammary tumors. C57BL/6 mice were either inoculated with E0771 cells in saline, a metastatic mouse mammary tumor cell line derived from the same mouse strain (8), or inoculated with only saline. After tumors derived from E0771 cells became visible, the lactate production rates were monitored following overnight fasting of the mice. We observed a significant elevation of [3-13C]lactate in the serum samples from mice bearing early stage metastatic mammary tumors compared to those from mice bearing no mammary tumors (Fig. 5A).
Figure 5. Mice with early stage metastatic mammary tumors display significantly elevated rate of glycolysis in serum samples.
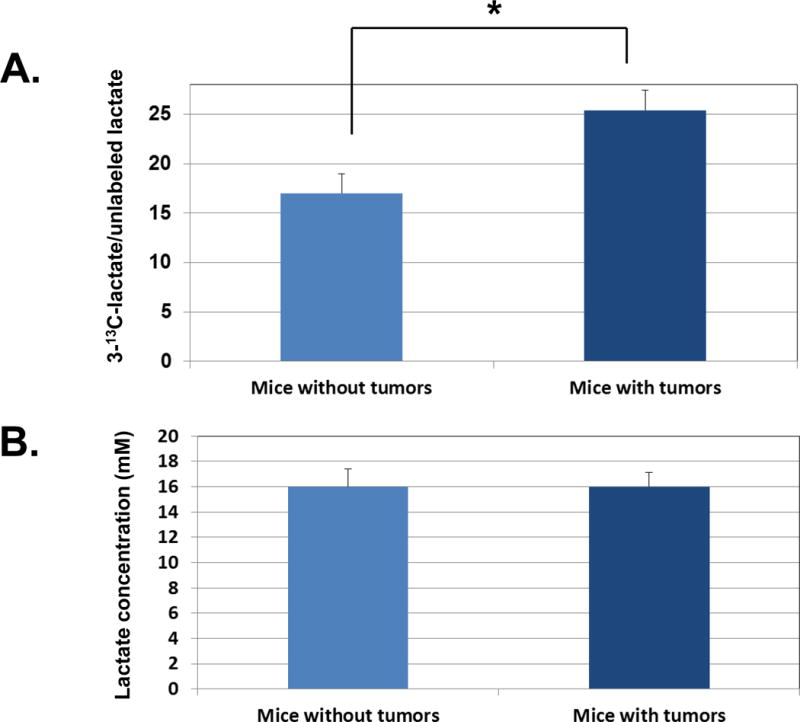
A. C57BL/6 mice were either injected orthotopically in the fourth inguinal mammary fat pad with E0771 cells in the saline or injected with saline only. After 3–4 weeks when tumor became visible, mice with or without mammary tumors were fasted overnight and injected via tail vein with 0.2 mL of 1M sterile [1-13C]glucose the next morning. Blood was drawn via facial vein one hour after injection. Blood samples were later centrifuged, and mouse serum was collected and processed as described in Materials and Methods for LC-MS analysis. The results are presented as [1-13C]lactate/unlabeled lactate in serum samples from mice (n=6) with early stage metastatic mammary tumors versus mice (n=6) without tumors (p<0.05). B. The serum samples obtained from the mouse experiments performed above were subjected to lactate concentration assay. As described in the Materials and Methods, lactate was measured using an L-Lactate Assay Kit following the manufacturer’s instructions. The graph represents the averages of lactate concentrations ± SEM from 3 individual experiments.
In contrast to cultured cancer cells in which lactate is produced by single-batch of uniformed cells under well-controlled growth conditions, lactate production in mice also involves lactate produced by other organs, namely the muscle tissue. Therefore, we also measured basal levels of lactate concentration in serum samples from C57BL/6 mice with or without mammary tumors. Interestingly, we observed the same level of lactate concentration between mice with or without mammary tumors (Fig. 5B). These results suggest that our LC-MS method for monitoring transient lactate incorporation rates is very sensitive in differentiating the lactate production in mice with or without metastatic tumors, despite the same basal levels of lactate in these mice.
Discussion
The ability of cancer cells to produce large amounts of lactate through aerobic glycolysis is coupled to high rates of glucose uptake (13). In fact, increased glucose uptake and glycolysis are among the most consistent hallmarks of cancer, including breast cancer (1, 13). These alterations in cellular metabolism play key roles in protecting cancer cells from apoptosis by rendering them independent of the need for growth factors and other environmental stimuli. Magnetic Resonance Spectroscopy (MRS), also called NMR spectroscopy, has been primarily used to detect elevated glycolysis or lactate production from glucose as an indicator of tumor development in brain cancers such as glioma (14). However, the usage of this method in other types of cancer has been limited by the sensitivity of the traditional NMR technique (15).
In addition, GC-MS methodology has been widely used to trace the lactate production or glycolysis rates in cultured cancer cells (16, 17). However, recent advancements in LC-MS have significantly improved the sensitivity of this technology compared to traditional GC-MS- or NMR-based technologies (15), which make it feasible to detect very low concentrations of small molecules or metabolites. Furthermore, one of the common methods for metabolic tracing of glucose metabolism is to use [2-13C]glucose, but it is difficult to distinguish between different pathways leading to production of lactate using this isotopic labeled glucose molecule. Moreover, there are no other currently available detection methods that can monitor the production of lactate from glucose through glycolysis in cancer cells that are not interfered by other metabolic pathways. The commercially available methods, including measurement of acidity in the cell culture medium (Seahorse Biosciences) or detection of lactate by an enzyme-based approach (various biotech companies), only measure concentrations of lactate, the end product of glycolysis, which could be from multiple metabolic pathways.
In contrast to these methods, the method we have established in cultured cancer cells is not only much more sensitive, but it can also accurately trace, at least in the initial labeling phase, the conversion of glucose to lactate through glycolysis without the interference of other pathways such as the PPP pathway and glutaminolysis. As shown in Fig. 1, the carbon at C1 of glucose (anomeric carbon) becomes CO2 in the PPP pathway. In addition, no labeled glutamine was added into the medium or injected into the mice so lactate production from glutaminolysis is not traced. Indeed, our results show a dramatically enhanced production of [3-13C]lactate from [1-13C]glucose in high-metastatic MDA-MB-231 cells (versus low-metastatic MDA-MB-453 cells), which agrees with the enhanced glucose uptake activity in MDA-MB-231 cells as well as the aggressiveness of mouse mammary tumors.
For long-term labeling experiments, the 1-13C in [1-13C]glucose converts to more end products in different glucose metabolism pathways and these end products may synthesize lactate through multiple pathways by the so called reversed Warburg effect (18). Therefore, we did short-term labeling in our assay by adding 1-13C-glucose following serum-starvation and glucose/pyruvate depletion. Under these circumstances, the activity of the reversible pathways to synthesize lactate should be very low, especially at the initial phase of the labeling (1–3 hours), before the glycolysis rates reached plateau in MDA-MB-231 cells (Fig. 3).
The detection method established in this study has shown promising results comparing the glycolysis rates in vitro in cultured cancer cells. Since we depleted basal level of lactate production through a lengthy glucose/pyruvate starvation process, our results can accurately reflect the ratio or relative flux of glycolysis versus pentose phosphate pathway, at least during the initial labeling (1–3 hours) phase (Fig. 6). In addition to reversed glycolysis, the first few steps of the PPP are also reversible, in which unlabeled glucose may be regenerated causing underestimation of the relative flux through glycolysis. However, the reverse of the decarboxylation step has been studied in vitro, which requires saturating bicarbonate and high concentrations of NADPH and ribulose-5-phosphate, which are not likely to exist in cultured cancer cells in our experiments, to drive the reaction toward 6-phosphogluconate (19). Under our experimental conditions that include glucose/pyruvate starvation and depletion of lactate, this step will be largely irreversible, which is also supported by the high relative glycolytic flux observed in some of our samples (MDA-MB-231 cells).
Figure 6. A re-presentation of the isotopic labeling results in cultured breast cancer cells from Fig. 3.
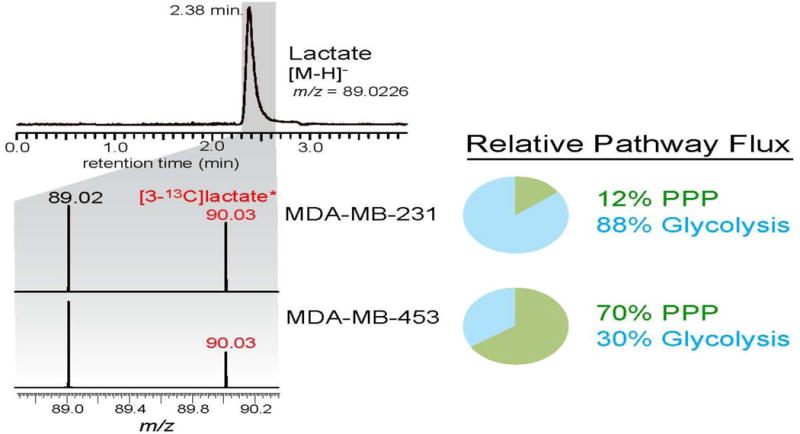
The results show the relative flux of [1-13C]glucose through glycolysis versus pentose phosphate pathway in its conversion to lactate, after three hours of labeling the breast cancer cell lines with [1-13C]glucose.
It is known that the rate of glycolysis in cancer cells is affected by glucose uptake as well as several key glycolytic enzymes. Therefore, this method could be potentially used for assessing the efficacy of a variety of chemical compounds that target glucose uptake or different enzymes in the glycolysis process in cultured cancer cells. Likewise, this method can also be used for biomedical research detecting the effects of different genetic mutations on aerobic glycolysis in cancer cells, which may aid in the development of personalized therapy for cancer patients.
The majority of cancer-related death, including those in breast cancer, is caused by metastasis. Recent studies have shown that lactate can be used by adjacent cancer or stromal cells as an energy source to promote angiogenesis and metastasis (11, 12). Indeed, our results suggest that elevated lactate production from glycolysis is an indicator of tumor metastasis in breast cancer cell lines. In fact, increased expression of multiple metastatic-related proteins has been reported in MDA-MB-231 rather than MDA-MB-453 cells or other low-or non-invasive breast cancer cell lines (5, 6), which is consistent with our results. Our results also agree with a recent findings using isotopic labeled, isogenic non-metastatic versus metastatic breast cancer cells which show enhanced lactate production in metastatic breast cancer cells (20).
Although mammography screenings have led to increased earlier detection of ductal carcinoma in situ or DCIS breast tumors (indolent abnormal cells confined within milk ducts), recent reports suggest that this method has failed to reduce breast cancer death from metastatic breast cancer because it cannot distinguish pre-invasive breast cancer from indolent breast cancer (21). While PET imaging technique using radiolabeled FDG is considered a method that mimics aerobic glycolysis rate in cancer cells, this method is not sensitive enough for detecting small lesions of breast tumors and cannot be used to detect pre-invasive cancer. Yet, the majority of the DCIS lesions never become metastatic, and it is unclear why certain DCIS lesions develop into invasive breast cancer. As a result, a considerable number of patients suffer from aggressive treatment-related morbidities. Therefore, novel approaches and new technologies are urgently needed in searching for biomarkers suitable for detection of pre-invasive cancer.
We have observed significant differences in incorporation rates of [1-13C]glucose into [3-13C]lactate in serum samples obtained in mice with early stage metastatic mammary tumors or without tumors. Different from the in vitro cell study results, which measures glycolysis/PPP ratio, the relative rate of isotope incorporation in vivo in the mouse study reflects the glycolysis rate using basal levels of lactate as the control. Therefore, it may be a better indicator for abnormal glycolysis from cancer cells in vivo. It is conceivable that this approach could be further developed to measure elevated production of [3-13C]lactate in patients’ serum samples as a biomarker for pre-invasive breast cancer, following the injection of a small amount of stable isotope-labeled [1-13C]glucose into patients after overnight fasting.
While several newly developed NMR-based techniques have been tested in their capability to detect invasive cancer, these techniques, like PET imaging, are much more expensive than our technique and are still at early stage of development (22, 23). In contrast, our detection method could be a minimally invasive, non-radioactive, and economic procedure that can be performed in women who have already developed DCIS breast tumors, detected by mammography screenings. Our results thus may pave the way for further exploration of the elevated production of stable isotopic lactate as a promising biomarker for pre-invasive breast cancer in clinical trials.
Acknowledgments
We thank Dr. David Potter in the Department of Medicine of the University of Minnesota for his helpful input for our experiments. We also thank Susan Jiang for her technical assistance. This project is supported by a Grant-In-Aid Award (Yang) from the University of Minnesota, a Research Project grant form National Cancer Institute of National Institute of Health (1R01CA157012-01A1, Cleary), the National Science Foundation (NSF) Plant Genome Research Program grants (IOS-1400818 & IOS-1238812, Hegeman), and a NSF Fellowship grant (IOS-1400818, Freund).
Footnotes
Author contributions:
DY conceived, designed, and performed the study and wrote the manuscript; DF designed and performed the study; BH and DW performed the study; MC and AH conceived the study and revised manuscript.
References
- 1.DeBerardinis RJ, Lum JJ, Hatzivassiliou G, Thompson CB. The biology of cancer: metabolic reprogramming fuels cell growth and proliferation. Cell Metab. 2008;7:11–20. doi: 10.1016/j.cmet.2007.10.002. [DOI] [PubMed] [Google Scholar]
- 2.Warburg O. On the origin of cancer cells. Science. 1956;123:309–314. doi: 10.1126/science.123.3191.309. [DOI] [PubMed] [Google Scholar]
- 3.Ueda S, Tsuda H, Asakawa H, Shigekawa T, Fukatsu K, Kondo N, Yamamoto M, Hama Y, Tamura K, Ishida J, Abe Y, Mochizuki H. Clinicopathological and prognostic relevance of uptake level using 18F-fluorodeoxyglucose positron emission tomography/computed tomography fusion imaging (18F-FDG PET/CT) in primary breast cancer. Jpn J Clin Oncol. 2008;38:250–258. doi: 10.1093/jjco/hyn019. [DOI] [PubMed] [Google Scholar]
- 4.Hegeman AD. Plant metabolomics–meeting the analytical challenges of comprehensive metabolite analysis. Brief Funct Genomics. 2010;9:139–148. doi: 10.1093/bfgp/elp053. [DOI] [PubMed] [Google Scholar]
- 5.Zhang Z, Yang M, Chen R, Su W, Li P, Chen S, Chen Z, Chen A, Li S, Hu C. IBP regulates epithelial-to-mesenchymal transition and the motility of breast cancer cells via Rac1, RhoA and Cdc42 signaling pathways. Oncogene. 2013 doi: 10.1038/onc.2013.337. [DOI] [PMC free article] [PubMed] [Google Scholar]
- 6.Wang Y, Li SJ, Pan J, Che Y, Yin J, Zhao Q. Specific expression of the human voltage-gated proton channel Hv1 in highly metastatic breast cancer cells, promotes tumor progression and metastasis. Biochem Biophys Res Commun. 2011;412:353–359. doi: 10.1016/j.bbrc.2011.07.102. [DOI] [PubMed] [Google Scholar]
- 7.Ben-Sahra I, Howell JJ, Asara JM, Manning BD. Stimulation of de novo pyrimidine synthesis by growth signaling through mTOR and S6K1. Science. 2013;339:1323–1328. doi: 10.1126/science.1228792. [DOI] [PMC free article] [PubMed] [Google Scholar]
- 8.Chen CT, Du Y, Yamaguchi H, Hsu JM, Kuo HP, Hortobagyi GN, Hung MC. Targeting the IKKbeta/mTOR/VEGF signaling pathway as a potential therapeutic strategy for obesity-related breast cancer. Mol Cancer Ther. 2012;11:2212–2221. doi: 10.1158/1535-7163.MCT-12-0180. [DOI] [PMC free article] [PubMed] [Google Scholar]
- 9.Chambers MC, Maclean B, Burke R, Amodei D, Ruderman DL, Neumann S, Gatto L, Fischer B, Pratt B, Egertson J, Hoff K, Kessner D, Tasman N, Shulman N, Frewen B, Baker TA, Brusniak MY, Paulse C, Creasy D, Flashner L, Kani K, Moulding C, Seymour SL, Nuwaysir LM, Lefebvre B, Kuhlmann F, Roark J, Rainer P, Detlev S, Hemenway T, Huhmer A, Langridge J, Connolly B, Chadick T, Holly K, Eckels J, Deutsch EW, Moritz RL, Katz JE, Agus DB, MacCoss M, Tabb DL, Mallick P. A cross-platform toolkit for mass spectrometry and proteomics. Nat Biotechnol. 2012;30:918–920. doi: 10.1038/nbt.2377. [DOI] [PMC free article] [PubMed] [Google Scholar]
- 10.Smith CA, Want EJ, O’Maille G, Abagyan R, Siuzdak G. XCMS: processing mass spectrometry data for metabolite profiling using nonlinear peak alignment, matching, and identification. Anal Chem. 2006;78:779–787. doi: 10.1021/ac051437y. [DOI] [PubMed] [Google Scholar]
- 11.Doherty JR, Cleveland JL. Targeting lactate metabolism for cancer therapeutics. J Clin Invest. 2013;123:3685–3692. doi: 10.1172/JCI69741. [DOI] [PMC free article] [PubMed] [Google Scholar]
- 12.Dhup S, Dadhich RK, Porporato PE, Sonveaux P. Multiple biological activities of lactic acid in cancer: influences on tumor growth, angiogenesis and metastasis. Curr Pharm Des. 2012;18:1319–1330. doi: 10.2174/138161212799504902. [DOI] [PubMed] [Google Scholar]
- 13.Chen JQ, Russo J. Dysregulation of glucose transport, glycolysis, TCA cycle and glutaminolysis by oncogenes and tumor suppressors in cancer cells. Biochim Biophys Acta. 2012;1826:370–384. doi: 10.1016/j.bbcan.2012.06.004. [DOI] [PubMed] [Google Scholar]
- 14.Schupp DG, Merkle H, Ellermann JM, Ke Y, Garwood M. Localized detection of glioma glycolysis using edited 1H MRS. Magn Reson Med. 1993;30:18–27. doi: 10.1002/mrm.1910300105. [DOI] [PubMed] [Google Scholar]
- 15.Wolfender JL, Marti G, Thomas A, Bertrand S. Current approaches and challenges for the metabolite profiling of complex natural extracts. J Chromatogr A. 2014 doi: 10.1016/j.chroma.2014.10.091. [DOI] [PubMed] [Google Scholar]
- 16.Fan TW, Kucia M, Jankowski K, Higashi RM, Ratajczak J, Ratajczak MZ, Lane AN. Rhabdomyosarcoma cells show an energy producing anabolic metabolic phenotype compared with primary myocytes. Mol Cancer. 2008;7:79. doi: 10.1186/1476-4598-7-79. [DOI] [PMC free article] [PubMed] [Google Scholar]
- 17.Gaglio D, Metallo CM, Gameiro PA, Hiller K, Danna LS, Balestrieri C, Alberghina L, Stephanopoulos G, Chiaradonna F. Oncogenic K-Ras decouples glucose and glutamine metabolism to support cancer cell growth. Mol Syst Biol. 2011;7:523. doi: 10.1038/msb.2011.56. [DOI] [PMC free article] [PubMed] [Google Scholar]
- 18.Witkiewicz AK, Whitaker-Menezes D, Dasgupta A, Philp NJ, Lin Z, Gandara R, Sneddon S, Martinez-Outschoorn UE, Sotgia F, Lisanti MP. Using the “reverse Warburg effect” to identify high-risk breast cancer patients: stromal MCT4 predicts poor clinical outcome in triple-negative breast cancers. Cell Cycle. 2012;11:1108–1117. doi: 10.4161/cc.11.6.19530. [DOI] [PMC free article] [PubMed] [Google Scholar]
- 19.Hanau S, Montin K, Cervellati C, Magnani M, Dallocchio F. 6-Phosphogluconate dehydrogenase mechanism: evidence for allosteric modulation by substrate. J Biol Chem. 2010;285:21366–21371. doi: 10.1074/jbc.M110.105601. [DOI] [PMC free article] [PubMed] [Google Scholar]
- 20.Simoes RV, Serganova IS, Kruchevsky N, Leftin A, Shestov AA, Thaler HT, Sukenick G, Locasale JW, Blasberg RG, Koutcher JA, Ackerstaff E. Metabolic plasticity of metastatic breast cancer cells: adaptation to changes in the microenvironment. Neoplasia. 2016;17:671–684. doi: 10.1016/j.neo.2015.08.005. [DOI] [PMC free article] [PubMed] [Google Scholar]
- 21.Miller AB, Wall C, Baines CJ, Sun P, To T, Narod SA. Twenty five year follow-up for breast cancer incidence and mortality of the Canadian National Breast Screening Study: randomised screening trial. Bmj. 2014;348:g366. doi: 10.1136/bmj.g366. [DOI] [PMC free article] [PubMed] [Google Scholar]
- 22.Lupo JM, Chen AP, Zierhut ML, Bok RA, Cunningham CH, Kurhanewicz J, Vigneron DB, Nelson SJ. Analysis of hyperpolarized dynamic 13C lactate imaging in a transgenic mouse model of prostate cancer. Magn Reson Imaging. 2010;28:153–162. doi: 10.1016/j.mri.2009.07.007. [DOI] [PMC free article] [PubMed] [Google Scholar]
- 23.Pickup S, Lee SC, Mancuso A, Glickson JD. Lactate imaging with Hadamard-encoded slice-selective multiple quantum coherence chemical-shift imaging. Magn Reson Med. 2008;60:299–305. doi: 10.1002/mrm.21659. [DOI] [PMC free article] [PubMed] [Google Scholar]