

Summary
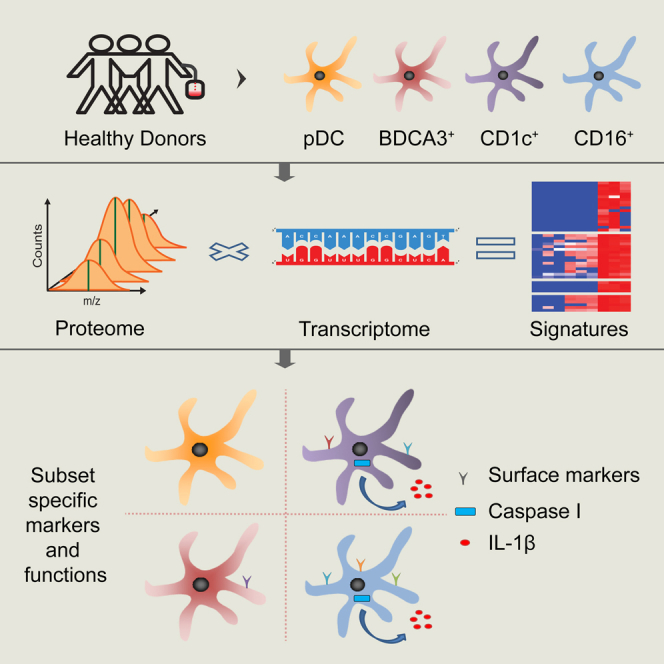
Dendritic cells (DCs) play a key role in orchestrating adaptive immune responses. In human blood, three distinct subsets exist: plasmacytoid DCs (pDCs) and BDCA3+ and CD1c+ myeloid DCs. In addition, a DC-like CD16+ monocyte has been reported. Although RNA-expression profiles have been previously compared, protein expression data may provide a different picture. Here, we exploited label-free quantitative mass spectrometry to compare and identify differences in primary human DC subset proteins. Moreover, we integrated these proteomic data with existing mRNA data to derive robust cell-specific expression signatures with more than 400 differentially expressed proteins between subsets, forming a solid basis for investigation of subset-specific functions. We illustrated this by extracting subset identification markers and by demonstrating that pDCs lack caspase-1 and only express low levels of other inflammasome-related proteins. In accordance, pDCs were incapable of interleukin (IL)-1β secretion in response to ATP.
Graphical Abstract
Highlights
-
•
We present a comprehensive quantitative proteome comparison of primary human DC subsets
-
•
Proteome comparison reveals many expression differences between DC subsets
-
•
We provide a resource to derive markers and examine subset functional specialization
-
•
pDCs lack caspase-1 and have a decreased inflammasome response
Worah et al. present a comprehensive quantitative proteomic comparison of four human blood-derived DC-like subsets. Through integration of proteomic and transcriptomic data, the authors derive expression signatures for each subset that provide a resource for study of subset functional specialization.
Introduction
Dendritic cells (DCs) play a critical role in the initiation of antigen-specific adaptive immune responses to foreign antigens and the maintenance of tolerance to self-antigens (reviewed by Balan et al., 2014, Reynolds and Haniffa, 2015, Vu Manh et al., 2015). DCs harbor the unique capacity to process and present antigens complexed to either major histocompatibility complex (MHC) class I or MHC class II and thereby can activate naive T cells. It is because of this ability that DCs have become of interest as tools or targets for cancer immunotherapy to initiate or boost tumor immunity.
Several DC subsets can be distinguished that differ in their ability to sense and respond to pathogens and in the type of immune response they initiate. Two main types of naturally occurring blood DCs have been characterized: plasmacytoid DCs (pDCs) and myeloid DCs (mDCs) (reviewed by Vu Manh et al., 2015). pDCs play a key role in antiviral immunity, through their ability to produce large amounts of type I interferons (IFNs). mDCs represent the “traditional” antigen-presenting DCs that can be further subdivided based on the expression of BDCA3 (CD141) and CD1c (BDCA1). Each can be defined through the expression of different pattern recognition receptors (PRRs; e.g., Toll-like receptors [TLRs] and C-type lectin receptors [CLRs]) and the secretion of a distinct set of cytokines upon stimulation (reviewed by Balan et al., 2014, Reynolds and Haniffa, 2015, Vu Manh et al., 2015). Whereas CD1c+ mDCs express most TLRs, except TLR9, BDCA3+ mDCs express mainly TLR3. Furthermore, BDCA3+ mDCs express the CLR CLEC9a, which facilitates the uptake of dying cells and subsequent cross-presentation of derived antigens to T cells (Ahrens et al., 2012, Jongbloed et al., 2010, Poulin et al., 2010). Finally, although not considered a genuine DC, a CD16+ subset of monocytes, coined “non-classical monocytes,” can be found in blood with DC-like properties (Ziegler-Heitbrock et al., 2010). So far, these DCs subsets have been mostly characterized and isolated based on cell-specific (surface) markers and functionally compared for abilities such as antigen presentation, cytokine secretion, and migration (Balan et al., 2014, Reynolds and Haniffa, 2015, Vu Manh et al., 2015). These functional assays, however, can be biased as they provide information on only a few a priori determined functional responses to a limited set of activation stimuli and antigens. Although highly valuable in investigating the abilities of each subset under specific circumstances, these assays may leave more untraditional unique characteristics of each subset undetected. To overcome this, unbiased analyses of mRNA expression of human and mouse DC subsets have been performed and proven to be highly informative (Lindstedt et al., 2005, Manh et al., 2013, Miller et al., 2012, Robbins et al., 2008). Comparative transcriptome analysis delivered the most compelling evidence for the current thought that the human BDCA3+ mDC is the counterpart of the murine CD8a+ DC, despite the lack of conservation of identification markers (Robbins et al., 2008). In addition, the Robbins et al. (2008) study demonstrated that the CD16+ DC-like cell, based on its full transcriptional program, resembles a monocyte more than a DC. Although these studies have provided valuable insight into the relation between DC subsets in mice and humans, RNA expression does not always reflect protein expression. Since not all RNA is translated, RNA and proteins may have dissimilar half-lives and kinetics, and protein levels may also be regulated by post-transcriptional modifications. Furthermore transcriptomics does not take into account pre-existing protein levels, alterations in translation efficiency, or protein stability. Therefore, transcriptome expression data may have limited predictive power on which proteins really define each DC subset and may have left important phenotypic and functional differences unnoticed. To confirm and supplement the existing transcriptome analysis, we have performed a comprehensive mass-spectrometry (MS)-based quantitative proteome comparison of rare blood DC subsets. Furthermore, we integrated protein and RNA data to derive expression signatures that give a more reliable and comprehensive account of expression differences than can be achieved from using either technique alone. The expression signatures represent an easily accessible resource to derive hypotheses on subset-specific functions. To illustrate this, we validated five of the identified differentially expressed surface markers and showed that caspase-1 is completely lacking in pDCs, which is accompanied by restricted expression of other inflammasome components and affects the function of these cells.
Results
Quantitative Proteomics of Primary Human DC Subsets
For proteome characterization, four DC-(like) subsets (i.e., pDCs, CD1c+ mDCs, BDCA3+ mDCs, and CD16+ monocytes) were isolated from apheresis products obtained from healthy volunteers by magnetic-bead-based cell separation. The purity of the isolated cells and presence of cross-contamination were assessed by flow cytometry (Figure S1). For pDCs, CD1c+ mDCs, and CD16+ monocytes, high purity (≥95%) was obtained for all subsets without major cross-contamination or presence of B or T cells in two out of three donors. For a third donor, medium-high purity was obtained (78%–92%). For BDCA3+ mDC samples, most cells were BDCA3+CD11c+ (87%–95%). We observed however, a variable number of CD11c+ cells expressing intermediate levels of BDCA3 (BDCA3int) in the isolate together with cells positive for CD1c+, indicating cross-contamination of this sample with CD11c+CD1c+BDCA3int cells. Therefore, we consider these samples to be BDCA3+ mDC enriched rather than pure. Nevertheless, we reasoned that this sample is still of use to derive BDCA3+ mDC-specific protein expression, which may be achieved by relating the BDCA3+ mDC-enriched samples to the (BDCA3+-depleted) CD1c+ mDC samples. All 12 (three donors times four subsets) samples were, first, each separated using SDS-PAGE, fractionated into 20 fractions, and subjected to in-gel trypsin digestion (yielding 240 fractions in total). The fractions were measured in triplicate, using highly sensitive liquid chromatography-tandem MS (LC-MS/MS) for maximal protein coverage. After peptide identification and sequence alignment, proteins were quantified using the label-free quantification (LFQ) algorithm in MaxQuant (Cox et al., 2014). The Pearson correlation was very high (r = 0.97 ± 0.02) between technical replicates and high (r = 0.93 ± 0.02) between biological replicates (e.g., the same subsets from different donors), indicating good reproducibility across measurements and donors (Table S1). In total, we identified 42,723 non-redundant peptide sequences corresponding to 4,196 protein groups (Table S2; Table S3). Requiring a protein to be expressed in at least two donors for each subset, we identified 2,351, 2,197, 2,009, and 1,883 proteins in pDCs, BDCA3+ mDCs, CD1c+ mDCs, and CD16+ cells, respectively, and 2,823 proteins overall (Figures S2A–S2D; Tables S2 and S3). Next, using the CORUM database of protein complexes, we inspected the identification of components of protein complexes essential for cell homeostasis (e.g., mitochondrial complexes and proteasomes), to assess the completeness of the proteome in each cell type (Luber et al., 2010). We recovered most components, indicating that our proteome covered the majority of DC proteins (Figure S2E). Coverage was best in pDCs and BDCA3+ mDCs, yielding 70%–100% of essential protein complexes, and was least in CD16+ cells (40%–100%; Figure S2E).
We then evaluated the assignment of key identification markers for each subset. No markers specific for other major leukocyte populations (e.g., T, B, or NK cells) were identified, suggesting a lack of substantial contamination with other leukocytes. In contrast, we readily identified the unique expression of at least one previously reported subset-specific protein for each subset, including TLR7, TLR9, CLEC4C, NRP1, and IL3RA for pDCs; IDO and HLA-DO for BDCA3+ mDCs; and CD16 (FCGR3A) for CD16+ monocytes (Table 1). Importantly, CD1c was uniquely detected in CD1c+ mDCs but not in BDCA3+ mDCs. For BDCA3+ DCs, we did not immediately identify more traditional markers such as BDCA3 (CD141, THBD), CLEC9a, TLR3, NECL2, and XCR1 using the default peptide identification threshold (false discovery rate [FDR] = 0.01). Possibly, this was due to a low expression, high hydrophobicity, or heavy glycosylation of these molecules. Nevertheless, we found a unique expression of IDO and HLA-DO in BDCA3+ mDCs; they were previously reported to be highly expressed in especially this subset (Crozat et al., 2010, Hornell et al., 2006). Upon more close inspection of peptides, however, TLR3 was found in one BDCA3+ mDC sample, and CLEC9A and BDCA3 (CD141/THBD) were found in two samples. Because these peptides were detected with low confidence (FDR = 1), we generated MS/MS spectra and manually verified this result (data not shown). Together, the expression patterns of established marker proteins demonstrate the ability of our approach to discern the distinct identity of each subset.
Table 1.
Subset Identification Markers Uniquely Identified
| Peptides |
|||
|---|---|---|---|
| D1 | D2 | D3 | |
| pDCs | |||
| TLR9 | 5 | 10 | 11 |
| IL3RA (CD123) | 2 | 3 | 7 |
| CLEC4C (BDCA2) | 0 | 2 | 4 |
| TLR7 | 0 | 4 | 7 |
| NRP1 (BDCA4) | 1 | 0 | 1 |
| CD1c+ | |||
| CD1C | 2 | 2 | 2 |
| BDCA3+ | |||
| IDO1 | 8 | 5 | 10 |
| TLR3 | 3 | 0 | 0 |
| THBDa(BDCA3) | 1 | 0 | 2 |
| CLEC9Aa | 0 | 1 | 0 |
| CD16+ | |||
| FCGR3A (CD16) | 3 | 3 | 3 |
Shown here are the numbers of peptides identified and quantified for each marker protein for each subset. Shown markers were uniquely identified in the indicated subset.
Peptides were detected by releasing the FDR threshold of 0.01, and spectra were manually validated.
We also obtained quantitative information using the LFQ algorithm in MaxQuant (Cox et al., 2014). First, we used this information to compare protein expression in the three main populations of blood DC-like cells (i.e., pDCs, CD1c+ mDCs, and CD16+ monocytes), excluding the BDCA3+ mDC samples. We calculated average expression differences between any two subsets and visualized these in volcano plots (Figure 1A; see Table S4 for complete statistical analysis). It should be noted that here and in the remainder of the manuscript, only proteins expressed in at least two donors in one of the cell types being compared are included. Pairwise comparisons further highlighted subset identity, showing specific expression of CD11c (ITGAX/ITGB2) in myeloid cells and overexpression in the pDCs of several proteins with a reported pDC-specific expression and function (e.g., PACSIN1, SLC15A4, IRF7, TCF4, BCL11A, BLNK, and CD2AP) (Blasius et al., 2010, Cisse et al., 2008, Crozat et al., 2010, Esashi et al., 2012, Marafioti et al., 2008, Robbins et al., 2008, Röck et al., 2007, Wu et al., 2013).
Figure 1.

Comparison of Protein Expression between Three Main Blood DC-like Subsets and Integration with RNA Data
(A) Volcano plots depicting protein expression differences (x axis: log2 fold change) and the significance level (y axis: −log10 t test p value). Colored dots represent proteins with a fold change of >2 and p < 0.05; proteins in gray did not meet these criteria. Proteins specific to one of the two subsets compared were assigned a fold change of infinity. See also Table S4.
(B) Unsupervised hierarchical clustering of DC subsets using all proteins (1 − Pearson correlation).
(C) Clustering of subsets based on 1,218 DEPs (based on three-group one-way ANOVA, p < 0.05, or specific expression).
(D) Pearson correlation between protein and RNA (microarray) expression levels.
(E) Hierarchical clustering of merged transcriptome and proteome data (DEPs only).
See also Figures S1 and S2 and Tables S1, S2, S3, S4, S5, and S6.
Next, we determined the relation between cell types by hierarchical clustering (Figure 1B). Based on all proteins, subsets clustered together mostly on cell type rather than on donor. Furthermore, CD16+ monocytes and CD1c+ mDCs that share a myeloid origin were closer to each other than to pDCs. Hierarchical clustering of samples based on 1,218 differentially expressed proteins (DEPs) between the three subsets showed a separation similar to that seen when using all proteins and indicated six main groups of DEPs that showed higher or lower expression in one of the three subsets (Figure 1C). Next, we assessed how our protein data related to mRNA data. We merged our protein data with a previously published and publicly available microarray dataset of the same subsets (Lindstedt et al., 2005). For one of the donors that was used for MS analysis, we also acquired sufficient material to perform RNA sequencing on the same sample (Table S5). We first assessed the overall correlation between microarray-derived RNA data and proteome data for each cell type and found this to be low, similar to our previous observations (Figure 1D; r = 0.28–0.31) (Buschow et al., 2010). The correlation between RNA-sequencing data and proteome data for the matched donor was slightly better (0.37–0.45). Cross-correlation of this RNA-sequencing dataset to the protein data of the two other donors, however, produced a similar correlation, indicating that the different RNA analysis method was mostly responsible for the improved correlation (Table S6). To make a more in-depth comparison of the RNA data to our proteome dataset possible, we transformed both microarray-derived RNA and protein expression data to relative expression levels for each dataset separately (Z scores, mean to 0, variance to 1). From the merged dataset, we yielded 742 DEPs for which also RNA data were available. Again, we used the merged RNA and protein data for these 742 DEPs as input for hierarchical clustering (Figure 1E; Table S6). The combined protein and RNA samples grouped the distinct subsets from the two datasets together, indicating that, despite moderate correlation between absolute expression levels, there was a good correlation between RNA and protein expression patterns (Figure 1E). Importantly, the clustering was determined neither by biological variation between donors nor by technical variation between omics technologies.
Generation of Protein-Based Expression Signatures and Networks
Protein and RNA data were not consistent in all cases, and proteome analysis put forward DEPs for which differences at the RNA level were only minor or for which no probes had been present on the microarray chips. Next, we set out to visualize were exactly proteome analysis pointed to not previously appreciated differences between DC subsets and the cases in which RNA and protein were in agreement. For the six groups of DEPs associated with the three subsets (Figure 1C), we generated protein expression signatures based on four different evidence levels: (I) subset-specific protein expression/absence, supported by RNA data; (II) differential protein expression between subsets, supported by RNA data; (III) subset-specific protein expression/absence, not supported by RNA data; and (IV) differential protein expression between subset, not supported by RNA data (Figure 2; Supplemental Experimental Procedures). Proteins included in signatures based on level I and level II evidence behaved consistently in RNA and protein datasets. Thus, these proteins are, thus, likely mostly regulated at the transcriptional level. Importantly, for these proteins, proteomics data confirmed RNA-identified differences between subsets. Many established markers were present in these two groups: e.g., IL3RA, CLEC4C, TLR9, CD1c, and FCGR3B (CD16). Supported by two lines of evidence, other proteins in these groups now represent high-potential subset identification markers and include CD163 for CD1c+ mDCs and SIGLEC10 for CD16+ monocytes (Figure 2; Table S7). In contrast, proteins included in signatures based on level III and level IV evidence reflect less consistency between protein and RNA expression patterns or a lack of transcriptional information/ChIP (chromatin immunoprecipitation) annotation. Proteins in these evidence groups represent the added value of the proteome analysis (Figure 2). Finally, proteins that were put forward as differentially expressed by RNA data (differentially expressed genes; DEGs), and that were also present in our protein dataset but were not confirmed as differentially expressed by proteomics, are listed in Table S8.
Figure 2.

Cell-Specific Gene Signatures Derived from Proteomics and Transcriptomics
(A–F) Protein-based gene signatures for higher or lower expression in the three main subsets derived from merged proteome and transcriptome data based on four evidence levels: (I) specific protein expression/absence with RNA support; (II) differential protein expression with RNA support; (III) specific protein expression without RNA support; and (IV) differential protein expression without RNA support. Proteins marked by asterisks were specifically identified by MS in two donors only but were included because of RNA support (e.g., “rescued”). The heatmap colors represent relative protein expression (LFQ) in each DC subset and donor. See also Table S7.
Together, we confirmed differential or unique expression of 253 proteins between the three subsets previously observed by RNA expression (pDCs, 109 higher/65 lower; CD1c+ mDCs, 17 higher/1 lower; CD16+ monocytes, 34 higher/27 lower) that could also be derived from the transcriptome data (levels I and II; Figure 3; Table S7, including lower confidence DEPs). In addition, 143 proteins were found to be differently/uniquely expressed between subsets based on proteomics data only (levels III and IV), which hold yet-unappreciated differences between DC subsets (pDCs, 75 higher/14 lower; CD1c+ mDCs, 10 higher/8 lower; CD16+ monocytes, 10 higher/26 lower).
Figure 3.

Signature PPI Networks Highlight Functional Differences between Subsets
(A–E) Signatures were used as input for STRING PPI analysis (confidence level, 0.4) to visualize possible connections between proteins. (See Table S9.) Proteins indicated in blue were included based on protein and RNA data, and red proteins were pointed out by protein data only (see also Experimental Procedures and Table S7). Important biological functions of sections of each network are indicated (based on FA analysis). See also Table S9.
To obtain insight into the overall function of signature proteins, we performed a protein-protein interaction (PPI) analysis and a functional annotation (FA) analysis (Figure 3; Table S9). PPI analysis demonstrated good connectivity between proteins high in pDCs (0.73 connection per protein), proteins low in pDCs (1 connection per protein), those high in CD1c+ mDCs (0.85 connection per protein), and those low in CD16+ monocytes (0.64 connection per protein) (Figure 3; Table S9). Much less connectivity was found between proteins high in CD16+ monocytes (0.25 connection per protein) and those low in CD1c+ mDCs (no connections were identified).
In the CD1c+ mDC high signature, the MCM family and accessory proteins that regulate the cell cycle were found by proteome analysis only and were highly connected, suggesting a unique role for this complex in CD1c+ mDCs (Figure 3; Table S9). This complex was completely absent from CD16+ monocytes. Proteome analysis, but not RNA analysis, also pointed out that CD1c+ mDCs more highly expressed both the alpha-chain and the beta-chain of HLA-DQ, which may, thus, be of specific importance in this DC subset. The largest gene signatures were obtained for pDCs and mostly mapped to expected pDC functions, including TLR and IFN signaling (e.g., TLR9, IRF7, IRF8, andSMAD3), but also to endoplasmic reticulum (ER), Golgi, and vesicular transport, indicating high protein biosynthesis in this cell type (e.g., SEC24A, SEC31A, SEC11C, PDIA5, PDIA4, ERGIC3, and LMAN1) (Figure 3; Table S9). Intriguingly, IFN and TLR signaling pathway constituents were highly expressed in pDCs by both RNA and protein analyses, while proteins involved in protein biosynthesis and vesicular transport were, in many cases, highly expressed at the protein level only (Figure 3). The proteins absent from pDCs (e.g., shared by CD1c+ mDCs and CD16+ monocytes) were also highly connected and related to cell adhesion and protrusion formation (e.g., ZYX, MSN, PAK1, VASP, and FSCN1; Table S9), in line with the rounder non-adhesive phenotype of pDCs. Furthermore, pDCs hardly expressed or even lacked TLR2, which detects bacterial lipoproteins, several proteins connected to bactericidal endo/phagosomes (e.g., HMOX1, NCF2, and RAB27a) and CASP1 (caspase-1), a crucial enzyme in the inflammasome-induced cleavage of interleukin (IL)-1β in macrophages and DCs (Figure 3; Table S9).
BDCA3+ versus CD1c+ mDCs
Next, we investigated the difference between the two myeloid DC subsets. Despite the presence of CD1c+ mDCs in the BDCA3+ mDC samples, mDC samples were largely devoid of other blood cells (Figure S1). Importantly, CD1c+ mDC samples were devoid of BDCA3+ mDCs. A direct comparison between the two sets of samples could, therefore, still reveal important expression differences between mDC subsets (Figure 4; Table S4). As expected, the number of DEPs between BDCA3+ mDCs and CD1c+ mDCs was much less than between other subsets, reflecting the presence of CD1c+ cells in both samples and/or their more common origin. Similar to what we found before, protein only moderately correlated to RNA expression (r = 0.31 for microarray or r = 0.38 for RNA sequencing; Figure 4B; Table S6). Despite the contamination with CD1c+ mDCs, the BDCA3+ mDC protein samples clustered with the microarray RNA samples of BDCA3+ mDCs, indicating that the cross-contamination did not mask BDCA3+ mDC subset identity (Figure 4C). Finally, we derived DEPs between BDCA3+ mDCs and CD1c+ mDCs, using integration of protein and RNA data (Figures 4D and 4E). DEPs included IDO1, FUCA1, CD93, HLA-DOB, and TAP2 (high in BDCA3 mDCs) and also SIRPA, SIGLEC9, and CASP1 (high in CD1c+ mDCs). Several more DEGs by microarray showed a similar trend at the protein level but did not meet our stringent criteria (e.g., IRF8, CAMK2D, and TAP1; Table S8). Others were not found differentially expressed by proteomics or even showed an opposite trend.
Figure 4.

Pairwise Comparison of BDCA3+ mDCs and CD1c+ mDCs
(A) Volcano plot depicting protein expression differences (x axis: log2 fold change) and the significance level (y axis: −log10 t test p value) as in Figure 1.
(B) Pearson correlation between protein and RNA (microarray) expression levels.
(C) Hierarchical clustering of merged Z-score transcriptome and proteome data of DEPs.
(D and E) Heatmaps of the relative protein expression (LFQ) of proteins identified to be specifically (levels I and III) or differentially (level II or IV; by t test) expressed in either mDC subset, based on protein and RNA evidence (levels I and II) or protein evidence only (levels III and IV).
See also Figures S1 and S2 and Tables S1, S2, S3, S4, S5, and S6.
Validation of DEPs
To demonstrate the resource value of our integrated proteome and RNA analysis, we selected five cell-surface receptors for validation. We chose cell-surface receptors because these may reflect the ability of each subset to recognize dangerous agents, and could aid subset identification by flow cytometry. Using the latter technique, we confirmed differential expression of all five receptors: SIRPα and Siglec-9 were found on CD16+ monocytes and CD1c+ mDCs only; CD93 was especially high on BDCA3+ mDCs; Siglec-10 was unique to CD16+ monocytes; and, finally, CD163 was high on CD1c+ mDCs (Figure 5).
Figure 5.

Confirmation of Differentially Expressed Surface Markers
(A) Representative histogram of the expression of indicated surface markers by specific antibodies (lines) or isotype controls (gray area) on the four subsets.
(B) Bar diagrams summarizing the fluorescence level measured by flow cytometry (FC) in four independent healthy donors (isotype control antibody signal subtracted; mean ± SEM). All markers were found differentially expressed by one-way ANOVA (p < 0.05) and between pairs of subsets with indicated significance by post hoc Tukey’s multiple comparison test. ∗p < 0.05; ∗∗p < 0.01; ∗∗∗ < 0.001.
(C) Bar diagrams of mean LFQ values, as obtained by MS analysis (three donors; mean ± SEM).
Absence of Caspase-1 in pDCs Reflects Low Inflammasome Activity
Previous transcriptome analysis already indicated that pDCs express lower levels of transcripts for proteins involved in antibacterial innate immune responses (Crozat et al., 2009). It was not clear whether this also translated to protein expression and functionality. Our proteome data now confirm that pDCs express lower levels of or lack TLR2, NAIP, HMOX, RAB27A, NCF2, and CASP1 (Figure 2; Table S7). Caspase-1, a crucial player in inflammasome function, was abundantly present in CD1c+ mDCs and CD16+ cells but was lacking in pDCs (Figure 6A). In the BDCA3+ mDC-enriched sample, caspase-1 was present but at much lower levels than in CD1c+ mDCs. Importantly, protein quantification was based on 6, 11, or even 13 peptides for BDCA3+ mDCS, CD1c+ mDCs, or CD16+ monocytes, respectively, while in pDCs, only a single peptide was mapped to caspase-1 that was not adequate for quantification, suggesting the absence or very low expression of this protein (Table S3). To further substantiate these MS data, we analyzed protein expression by western blot (WB). Caspase-1 was readily detected in CD1c+ mDCs and CD16+ monocytes but was present only at very low levels in pure BDCA3+ mDCs and not at all detected in pDCs (Figures 6B and S4). It should be noted that we did detect low levels of caspase-1 in pDCs isolated by magnetic beads but that protein expression was completely absent when cells were sorted to high purity (>99%) by flow cytometry (Figures 6 and S4). We next wondered whether pDCs would upregulate caspase-1 when activated. To test this, we incubated cells with the TLR7/8 ligand R848. Cell activation by TLR stimulation upregulated caspase-1 in CD1c+ mDCs but did not in pDCs (Figures 6C and S4). CD16+ monocytes also did not further increase caspase-1 expression upon TLR stimulation. Upregulation of caspase-1 in BDCA3+ DCs could not be tested, because we did not manage to isolate a sufficient number of cells to test both resting and stimulated conditions by WB.
Figure 6.

Absence of Caspase and Inflammasome Activity in pDCs
(A) Diagrams of LFQ values for caspase-1, as obtained by MS analysis (three donors; mean).
(B and C) Western blot analysis of DC subsets isolated by flow sorting from two independent donors lysed (B) directly after isolation or (C) after overnight stimulation with R848. Shown are the signals for caspase-1 and actin probed sequentially on one membrane.
(D) Heatmap of log2 intensity values by microarray of probes mapping to inflammasome components (three donors).
(E) Flow cytometry evaluation of surface expression of CD83 on immature or R848/ATP-stimulated (4 hr, 45 min) subsets. Results of a representative donor are shown.
(F and G) Secretion of indicated cytokines by pDCs and CD1c mDC after stimulation for 4 hr (F) or overnight (G) with R848, followed by 45 min with ATP, by ELISA.
Mean values ± SEM from at least four donors. Significance was evaluated by a two-tailed Mann-Whitney test. ∗p < 0.05; ∗∗p < 0.01; ∗∗∗p < 0.001; ns, non-significant. See also Figures S3 and S4.
Next, we were interested in the expression of other components of the inflammasome pathway. Only very few other proteins of this pathway were identified by MS: NAIP was also detected in all subsets except for pDCs, while the inflammasome-component NLRC4 was identified in CD16+ monocytes only (Figure 2; Table S7). Exploration of the publicly available RNA expression data, however, indicated that low expression in pDCs was not restricted to caspase-1 but also included most other inflammasome components, as stated previously (Crozat et al., 2009). CD16+ monocytes, in contrast, expressed high levels of inflammasome constituents, CD1c+ mDCs expressed more moderate levels, and BDCA3+ mDCs expressed low levels (Figure 6D). Together, these data strongly suggest an overall low presence of inflammasome-related proteins in pDCs. Consequently, pDCs may not be equipped to recognize inflammasome-activating stimuli or to synthesize and secrete IL-1β in response. All components of the pathway downstream of ATP recognition were low in pDCs compared to the other subsets (P2XR7, PANX, NLRP3, CARD8, PYCARD, and CASP1; Figure 6D), indicating that pDCs may not be equipped to respond to this danger-associated molecule. ATP can trigger the cleavage and secretion of IL-1β, provided that necrosis factor κB (NF-κB) signaling is present at the same time to induce pro-IL-1β expression. As a proof of principle, we tested the ability of subsets to secrete IL-1β in response to ATP, preceded by 4-hr or overnight R848 stimulation to trigger NF-κB signaling via TLR7/8. Upregulation of activation marker CD83 and/or production of tumor necrosis factor α (TNF-α) was observed in all DC subsets, demonstrating functional NF-κB signaling (Figures 6E–6G). IL-1β secretion was restricted to especially CD1c+ mDCs and CD16+ mDCs. Thus, these data confirm that pDCs, indeed, lack IL-1β secretion in response to ATP. Of note, IL-18, which also requires caspase-1 for secretion, was readily secreted by ATP/R848-stimulated CD1c+ mDCs but not by pDCs (Figure S4). BDCA3+ mDCs were clearly activated by R848, as judged by the increased expression of CD83, yet hardly produced any cytokines (including IL-1β) under these circumstances (Figures 6E–6G).
These experiments together demonstrate that the inflammasome/caspase-1 pathway is present and functional in CD1c+ mDCs and CD16+ monocytes but not in pDCs. Concordantly, pDCs do not secrete IL1β in response to ATP.
Discussion
This study describes an elaborate proteome analysis of human-blood-derived DC subsets and provides DC subset-specific protein signatures. This dataset holds unique information on the differences between DC subsets and reveals which differences, previously identified using mRNA, are really present at the protein level. Previously, Luber and colleagues analyzed the proteome of murine DC subsets (Luber et al., 2010), but large-scale proteomics of human DCs was thus far restricted to in-vitro-generated monocyte-derived DCs (moDCs) and CD1c+ mDCs (Buschow et al., 2010, Schlatzer et al., 2012). The latter study reported 725 proteins expressed in resting and TLR-stimulated CD1c+ mDCs together, of which the majority (75%) was also identified, in the present analysis, in resting CD1c+ mDCs, along with a further 1,500 other proteins. The present dataset thus represents, to the best of our knowledge, the most complete quantitative proteome analysis of human DC subsets and provides a unique side-by-side comparison of these cells from the same donors.
We report on nearly 400 differentially expressed proteins between the three main blood DC-like subsets. In addition, despite the presence of CD1c+ mDCs in the BDCA3+ mDC sample, we identify over 60 proteins differentially expressed between mDC subsets, of which we subsequently validated four by flow cytometry. The protein-based signatures we derived provide insight into possible functional differences between subsets. Although we cannot discuss in detail all the functional implications of the expression differences we have identified, several warrant further discussion. First, we demonstrate the abundant expression of the MCM family of proteins in CD1c+mDCs, but not in CD16+ monocytes or in pDCs. This protein family is essential for cell division. Thus, our data support previous findings that, in contrast to pDCs, a fraction of the blood mDC population may still be able to expand, possibly reflecting an incomplete differentiation state (Segura et al., 2012). Our data suggest that, like pDCs, CD16+ cells may completely lack the potential to expand. The remaining capacity of mDCs to divide is interesting from a clinical perspective, as it implies that mDCs after isolation may have the potential to be further expanded. This concept may be of interest for the development of immunotherapies for cancer or chronic inflammatory diseases, where obtaining sufficient cell numbers is still a major hurdle.
Second, HLA (human leukocyte antigen) molecule expression demonstrated some marked differences between subsets, suggesting subset-specific antigen presentation. CD1c+ mDCs not only highly express antigen-presenting CD1c but also more highly expressed HLA-DQ, as compared to pDCs and CD16+ monocytes (but not HLA-DR). In agreement with a previous report, BDCA3+ cells uniquely expressed HLA-DO (Hornell et al., 2006). For these HLA types, either a clear (HLA-DO) or a unique (HLA-DQ versus HLA-DR) biological function remains to be defined. Thus, the consequence of this subset-specific expression remains elusive.
Third, many ER- and Golgi-located proteins were expressed at higher levels, specifically in pDCs. Previously, it has been shown that, in mice, pDCs and, to a lesser extent, CD8α+ DCs (the supposed murine equivalent of BDCA3+ DCs), display a constitutive activation of the unfolded protein response (UPR), as was indicated by the alternative splicing of XBP1 (Iwakoshi et al., 2007). The increase in UPR was required for ER expansion to facilitate rapid IFN-α biosynthesis and is reminiscent of plasma cell differentiation (Iwakoshi et al., 2007). The high levels of ER and glycoprotein biosynthesis and transport proteins that we describe in pDCs support the paradigm that immature pDCs are already prepared for rapid IFN-α synthesis. Proteins related to intracellular protein transport machinery are also overtly expressed in immature pDCs, and these may provide important clues to unravel the largely unknown IFN-α secretory route.
From the identified DEPs, we confirmed five cell-surface receptors by flow cytometry: SIRPα and Siglec-9, which bind to CD47 and sialic acids, respectively, were found to be highly expressed on both CD16+ monocytes and CD1c+ mDCs. These receptors share a capacity to limit DC function and inflammation and are exploited by bacteria and malignant cells to evade immune responses (Läubli et al., 2014, Ohta et al., 2010, Barclay and Van den Berg, 2014). Lack of these receptors may render cells insensitive to this evasion. CD1c+ mDCs uniquely expressed CD163, a scavenger receptor and PRR for bacteria (Kristiansen et al., 2001, Fabriek et al., 2009). Siglec-10, which we found selectively expressed on CD16+ monocytes, is a putative adhesion receptor and PRR that has been reported to be expressed on CD16+ but not CD16− monocytes, as well as on moDCs (Ancuta et al., 2009, Kivi et al., 2009, Li et al., 2001, Stephenson et al., 2014). Finally, BDCA3+ mDCs highly expressed CD93, which was reported to mediate phagocytosis and clearance of apoptotic cells and, as such, may act as an accessory to CLEC9A (Nepomuceno and Tenner, 1998, Norsworthy et al., 2004).
Our proteome data provided strong evidence for a lack of caspase-1 in pDCs. We validated this by WB and show data to suggest that pDCs have a diminished presence of inflammasome pathway constituents. Concordantly, pDCs did not respond to inflammasome activator ATP, while CD1c+ mDCs and CD16+ monocytes did. Our data contradict those of several previous studies reporting on IL1-β secretion by pDCs (Hurst et al., 2009, Yu et al., 2010). These studies show pDCs to secrete picograms of IL1β per milliliter of culture supernatant in response to TLR stimulation alone (without inflammasome activation). However, this level of IL1β is extremely low compared to production by CD16+ monocytes, which, we found, can secrete over a 100-fold more (nanograms of) IL1β per milliliter upon TLR and inflammasome stimulation. Furthermore, it is conceivable that traces (e.g., ±1%) of high IL1β-producing cells may be present in these pDC preparations isolated by magnetic beads, and such cells can contribute to the low amount of IL1β found to be secreted.
Interestingly, our proteome data also indicated that, although expression of caspase-1 was readily detected in the BDCA3+-enriched samples by proteomics, it was lower than in CD1+ mDCs and CD16+ DCs, a result we also verified using highly pure cells. Indeed, BDCA3+ mDCs responded less to inflammasome activation in the presence of TLR7/8 ligand. This stimulus matured BDCA3+ mDCs but did not induce cytokine secretion. However, low IL1-β production by BDCA3+ mDCs relative to CD1c+ mDCs, in response to the potent BDCA3+ mDC-activating stimulus poly(I:C), has also been reported (Jongbloed et al., 2010).
Several recent publications have demonstrated that the pDC hallmarks type I IFN and IRF7 may directly inhibit IL-1β and inflammasome activity (Guarda et al., 2011, Salem et al., 2011). In pDCs, TLR7 activation by hepatitis C virus induced type I IFN secretion but induced neither IL-1β nor IL-18. In contrast, TLR7 activation in monocytes induced IL-1β and IL-18, rather than type I IFN (Chattergoon et al., 2014, Dreux et al., 2012). Thus, the differentiation program involving IRF7 that allows pDCs to secrete large amounts of Type I IFN may downregulate inflammasome pathway constituents, including caspase-1. Although this causal relation still awaits further experimental confirmation, this could switch the pDC response to TLR stimulation/NF-kB activation away from IL-1β and toward type I IFNs. A switch between type I IFNs and IL-1β could serve to prevent excessive damaging inflammation during antiviral responses.
Taken together, the proteome dataset that we describe provides a rich resource to solidly establish the phenotypic and functional capacities of human DC subsets and to decipher the contribution of each subset to the initiation of immune responses.
Experimental Procedures
Cells
DCs were isolated from apheresis products obtained from healthy volunteers after written informed consent was obtained and according to institutional guidelines and overseen by the local institutional review board (Commissie mensgebonden onderzoek [CMO]). Peripheral blood mononuclear cells (PBMCs) were purified via Ficoll density gradient centrifugation (Lucron Bioproducts), followed by magnetic-bead (Miltenyi Biotec) or flow-cytometric isolation, and were directly lysed for MS or WB analysis or were used in in vitro experiments (see the following text and Supplemental Experimental Procedures for details).
LC-MS/MS
In brief: Tryptic peptides were analyzed using LC (Easy-nLC; Thermo Fisher Scientific) coupled to a 7-T linear ion trap Fourier-transform ion cyclotron resonance mass spectrometer model (LTQ FT Ultra, Thermo Fisher Scientific). See Supplemental Experimental Procedures for details.
MS Data Processing
Proteins were identified and quantified from raw mass spectrometric files using MaxQuant software, version 1.3.0.5 (Cox and Mann, 2008). A database search was performed in the Andromeda search engine (Cox et al., 2011) against the Human Uniprot database (86,749 entries, June 2012). The protein abundance was determined by MaxLFQ, as described by Cox et al. (2014). The MS proteomics data have been deposited to the ProteomeXchange Consortium via the PRIDE partner repository with the identifier PRIDE: PXD004678 (Vizcaíno et al., 2016). (http://proteomecentral.proteomexchange.org). See Supplemental Experimental Procedures for details.
Statistical Analysis of Protein and RNA Data
See the Supplemental Experimental Procedures for details. Statistical analysis was performed in the R programming environment. Data were visualized using GENE-E software (http://www.broadinstitute.org/cancer/software/GENE-E) and BioLayout Express3D (version 3.3) (Theocharidis et al., 2009). For PPI analysis, we used the STRING PPI web tool (version 10; http://string-db.org/), and FA analysis was done using the DAVID web tool (https://david.ncifcrf.gov/).
Western Blotting and ELISA
These were performed according to standard procedures. See Supplemental Experimental Procedures for details and antibodies used.
In Vitro DC Activation
Isolated DC-like subsets were resuspended in X-VIVO 15 (Cambrex) containing 2% pooled human serum (Sanquin). pDCs were supplemented with 10 ng/ml recombinant human IL-3 (rhIL-3; Cellgenix). Both cell types were stimulated for 4 hr or overnight with 4 μg/ml R848, followed by 45-min stimulation with 5 mM ATP (Sigma). Culture supernatant was taken for ELISA.
Author Contributions
Conceptualization, S.I.B.; Methodology, S.I.B., E.L., and M.D.; Investigation, K.W., T.S.M.M., G.S., J.T., T.D.-d.B., and A.E.S.; Formal Analysis, K.W., T.P.V.M., and S.K.; Writing – Original Draft, K.W. and S.I.B.; Writing – Review & Editing, M.D., E.L., A.B.v.S., and C.G.F; Visualization, K.W. and T.S.M.M.; Funding Acquisition, C.G.F.; Resources, I.J.M.d.V., J.G., and H.J.W.; Supervision, S.I.B., E.L., C.G.F, M.D., and M.A.H.
Acknowledgments
The authors thank John-Paul Jukes for critical reading of the manuscript. This work was supported by a grant from the Dutch Cancer Society (KUN2009-4402), a Radboudumc RIMLS PhD grant, and grants from the Netherlands Organisation for Scientific Research (951.03.002 and 822.02.017). J.T. received grant NWO-Veni 863.13.024. A.B.v.S. received grant NWO-Vidi 864.11.006. I.J.M.d.V. received grant NWO-Vici 918.14.655. C.G.F. received the NWO Spinoza grant and ERC Adv grant PATHFINDER (269019).
Published: September 13, 2016
Footnotes
Supplemental Information includes Supplemental Experimental Procedures, four figures, and nine tables and can be found with this article online at http://dx.doi.org/10.1016/j.celrep.2016.08.023.
Contributor Information
Carl G. Figdor, Email: carl.figdor@radboudumc.nl.
Sonja I. Buschow, Email: s.buschow@erasmusmc.nl.
Accession Numbers
The accession number for the MS proteomics data reported in this paper is PRIDE: PXD004678.
Supplemental Information
References
- Ahrens S., Zelenay S., Sancho D., Hanč P., Kjær S., Feest C., Fletcher G., Durkin C., Postigo A., Skehel M. F-actin is an evolutionarily conserved damage-associated molecular pattern recognized by DNGR-1, a receptor for dead cells. Immunity. 2012;36:635–645. doi: 10.1016/j.immuni.2012.03.008. [DOI] [PubMed] [Google Scholar]
- Ancuta P., Liu K.Y., Misra V., Wacleche V.S., Gosselin A., Zhou X., Gabuzda D. Transcriptional profiling reveals developmental relationship and distinct biological functions of CD16+ and CD16- monocyte subsets. BMC Genomics. 2009;10:403. doi: 10.1186/1471-2164-10-403. [DOI] [PMC free article] [PubMed] [Google Scholar]
- Balan S., Ollion V., Colletti N., Chelbi R., Montanana-Sanchis F., Liu H., Vu Manh T.P., Sanchez C., Savoret J., Perrot I. Human XCR1+ dendritic cells derived in vitro from CD34+ progenitors closely resemble blood dendritic cells, including their adjuvant responsiveness, contrary to monocyte-derived dendritic cells. J. Immunol. 2014;193:1622–1635. doi: 10.4049/jimmunol.1401243. [DOI] [PMC free article] [PubMed] [Google Scholar]
- Barclay A.N., Van den Berg T.K. The interaction between signal regulatory protein alpha (SIRPalpha) and CD47: structure, function, and therapeutic target. Annu Rev of Immunol. 2014;32:25–50. doi: 10.1146/annurev-immunol-032713-120142. [DOI] [PubMed] [Google Scholar]
- Blasius A.L., Arnold C.N., Georgel P., Rutschmann S., Xia Y., Lin P., Ross C., Li X., Smart N.G., Beutler B. Slc15a4, AP-3, and Hermansky-Pudlak syndrome proteins are required for Toll-like receptor signaling in plasmacytoid dendritic cells. Proc. Natl. Acad. Sci. USA. 2010;107:19973–19978. doi: 10.1073/pnas.1014051107. [DOI] [PMC free article] [PubMed] [Google Scholar]
- Buschow S.I., Lasonder E., van Deutekom H.W., Oud M.M., Beltrame L., Huynen M.A., de Vries I.J., Figdor C.G., Cavalieri D. Dominant processes during human dendritic cell maturation revealed by integration of proteome and transcriptome at the pathway level. J. Proteome Res. 2010;9:1727–1737. doi: 10.1021/pr9008546. [DOI] [PubMed] [Google Scholar]
- Chattergoon M.A., Latanich R., Quinn J., Winter M.E., Buckheit R.W., 3rd, Blankson J.N., Pardoll D., Cox A.L. HIV and HCV activate the inflammasome in monocytes and macrophages via endosomal Toll-like receptors without induction of type 1 interferon. PLoS Pathog. 2014;10:e1004082. doi: 10.1371/journal.ppat.1004082. [DOI] [PMC free article] [PubMed] [Google Scholar]
- Cisse B., Caton M.L., Lehner M., Maeda T., Scheu S., Locksley R., Holmberg D., Zweier C., den Hollander N.S., Kant S.G. Transcription factor E2-2 is an essential and specific regulator of plasmacytoid dendritic cell development. Cell. 2008;135:37–48. doi: 10.1016/j.cell.2008.09.016. [DOI] [PMC free article] [PubMed] [Google Scholar]
- Cox J., Mann M. MaxQuant enables high peptide identification rates, individualized p.p.b.-range mass accuracies and proteome-wide protein quantification. Nat. Biotechnol. 2008;26:1367–1372. doi: 10.1038/nbt.1511. [DOI] [PubMed] [Google Scholar]
- Cox J., Neuhauser N., Michalski A., Scheltema R.A., Olsen J.V., Mann M. Andromeda: a peptide search engine integrated into the MaxQuant environment. J. Proteome Res. 2011;10:1794–1805. doi: 10.1021/pr101065j. [DOI] [PubMed] [Google Scholar]
- Cox J., Hein M.Y., Luber C.A., Paron I., Nagaraj N., Mann M. Accurate proteome-wide label-free quantification by delayed normalization and maximal peptide ratio extraction, termed MaxLFQ. Mol. Cell. Proteomics. 2014;13:2513–2526. doi: 10.1074/mcp.M113.031591. [DOI] [PMC free article] [PubMed] [Google Scholar]
- Crozat K., Vivier E., Dalod M. Crosstalk between components of the innate immune system: promoting anti-microbial defenses and avoiding immunopathologies. Immunol. Rev. 2009;227:129–149. doi: 10.1111/j.1600-065X.2008.00736.x. [DOI] [PubMed] [Google Scholar]
- Crozat K., Guiton R., Guilliams M., Henri S., Baranek T., Schwartz-Cornil I., Malissen B., Dalod M. Comparative genomics as a tool to reveal functional equivalences between human and mouse dendritic cell subsets. Immunol. Rev. 2010;234:177–198. doi: 10.1111/j.0105-2896.2009.00868.x. [DOI] [PubMed] [Google Scholar]
- Dreux M., Garaigorta U., Boyd B., Décembre E., Chung J., Whitten-Bauer C., Wieland S., Chisari F.V. Short-range exosomal transfer of viral RNA from infected cells to plasmacytoid dendritic cells triggers innate immunity. Cell Host Microbe. 2012;12:558–570. doi: 10.1016/j.chom.2012.08.010. [DOI] [PMC free article] [PubMed] [Google Scholar]
- Esashi E., Bao M., Wang Y.H., Cao W., Liu Y.J. PACSIN1 regulates the TLR7/9-mediated type I interferon response in plasmacytoid dendritic cells. Eur. J. Immunol. 2012;42:573–579. doi: 10.1002/eji.201142045. [DOI] [PMC free article] [PubMed] [Google Scholar]
- Fabriek B.O., van Bruggen R., Deng D.M., Ligtenberg A.J., Nazmi K., Schornagel K., Vloet R.P., Dijkstra C.D., van den Berg T.K. The macrophage scavenger receptor CD163 functions as an innate immune sensor for bacteria. Blood. 2009;113:887–892. doi: 10.1182/blood-2008-07-167064. [DOI] [PubMed] [Google Scholar]
- Guarda G., Braun M., Staehli F., Tardivel A., Mattmann C., Förster I., Farlik M., Decker T., Du Pasquier R.A., Romero P., Tschopp J. Type I interferon inhibits interleukin-1 production and inflammasome activation. Immunity. 2011;34:213–223. doi: 10.1016/j.immuni.2011.02.006. [DOI] [PubMed] [Google Scholar]
- Hornell T.M., Burster T., Jahnsen F.L., Pashine A., Ochoa M.T., Harding J.J., Macaubas C., Lee A.W., Modlin R.L., Mellins E.D. Human dendritic cell expression of HLA-DO is subset specific and regulated by maturation. J. Immunol. 2006;176:3536–3547. doi: 10.4049/jimmunol.176.6.3536. [DOI] [PubMed] [Google Scholar]
- Hurst J., Prinz N., Lorenz M., Bauer S., Chapman J., Lackner K.J., von Landenberg P. TLR7 and TLR8 ligands and antiphospholipid antibodies show synergistic effects on the induction of IL-1beta and caspase-1 in monocytes and dendritic cells. Immunobiology. 2009;214:683–691. doi: 10.1016/j.imbio.2008.12.003. [DOI] [PubMed] [Google Scholar]
- Iwakoshi N.N., Pypaert M., Glimcher L.H. The transcription factor XBP-1 is essential for the development and survival of dendritic cells. J. Exp. Med. 2007;204:2267–2275. doi: 10.1084/jem.20070525. [DOI] [PMC free article] [PubMed] [Google Scholar]
- Jongbloed S.L., Kassianos A.J., McDonald K.J., Clark G.J., Ju X., Angel C.E., Chen C.J., Dunbar P.R., Wadley R.B., Jeet V. Human CD141+ (BDCA-3)+ dendritic cells (DCs) represent a unique myeloid DC subset that cross-presents necrotic cell antigens. J. Exp. Med. 2010;207:1247–1260. doi: 10.1084/jem.20092140. [DOI] [PMC free article] [PubMed] [Google Scholar]
- Kivi E., Elima K., Aalto K., Nymalm Y., Auvinen K., Koivunen E., Otto D.M., Crocker P.R., Salminen T.A., Salmi M., Jalkanen S. Human Siglec-10 can bind to vascular adhesion protein-1 and serves as its substrate. Blood. 2009;114:5385–5392. doi: 10.1182/blood-2009-04-219253. [DOI] [PMC free article] [PubMed] [Google Scholar]
- Kristiansen M., Graversen J.H., Jacobsen C., Sonne O., Hoffman H.J., Law S.K., Moestrup S.K. Identification of the haemoglobin scavenger receptor. Nature. 2001;409:198–201. doi: 10.1038/35051594. [DOI] [PubMed] [Google Scholar]
- Läubli H., Pearce O.M., Schwarz F., Siddiqui S.S., Deng L., Stanczak M.A., Deng L., Verhagen A., Secrest P., Lusk C. Engagement of myelomonocytic Siglecs by tumor-associated ligands modulates the innate immune response to cancer. Proc Natl Acad Sci USA. 2014;111:14211–14216. doi: 10.1073/pnas.1409580111. [DOI] [PMC free article] [PubMed] [Google Scholar]
- Li N., Zhang W., Wan T., Zhang J., Chen T., Yu Y., Wang J., Cao X. Cloning and characterization of Siglec-10, a novel sialic acid binding member of the Ig superfamily, from human dendritic cells. J. Biol. Chem. 2001;276:28106–28112. doi: 10.1074/jbc.M100467200. [DOI] [PubMed] [Google Scholar]
- Lindstedt M., Lundberg K., Borrebaeck C.A. Gene family clustering identifies functionally associated subsets of human in vivo blood and tonsillar dendritic cells. J. Immunol. 2005;175:4839–4846. doi: 10.4049/jimmunol.175.8.4839. [DOI] [PubMed] [Google Scholar]
- Luber C.A., Cox J., Lauterbach H., Fancke B., Selbach M., Tschopp J., Akira S., Wiegand M., Hochrein H., O’Keeffe M., Mann M. Quantitative proteomics reveals subset-specific viral recognition in dendritic cells. Immunity. 2010;32:279–289. doi: 10.1016/j.immuni.2010.01.013. [DOI] [PubMed] [Google Scholar]
- Manh T.P., Alexandre Y., Baranek T., Crozat K., Dalod M. Plasmacytoid, conventional, and monocyte-derived dendritic cells undergo a profound and convergent genetic reprogramming during their maturation. Eur. J. Immunol. 2013;43:1706–1715. doi: 10.1002/eji.201243106. [DOI] [PMC free article] [PubMed] [Google Scholar]
- Marafioti T., Paterson J.C., Ballabio E., Reichard K.K., Tedoldi S., Hollowood K., Dictor M., Hansmann M.L., Pileri S.A., Dyer M.J. Novel markers of normal and neoplastic human plasmacytoid dendritic cells. Blood. 2008;111:3778–3792. doi: 10.1182/blood-2007-10-117531. [DOI] [PubMed] [Google Scholar]
- Miller J.C., Brown B.D., Shay T., Gautier E.L., Jojic V., Cohain A., Pandey G., Leboeuf M., Elpek K.G., Helft J., Immunological Genome Consortium Deciphering the transcriptional network of the dendritic cell lineage. Nat. Immunol. 2012;13:888–899. doi: 10.1038/ni.2370. [DOI] [PMC free article] [PubMed] [Google Scholar]
- Nepomuceno R.R., Tenner A.J. C1qRP, the C1q receptor that enhances phagocytosis, is detected specifically in human cells of myeloid lineage, endothelial cells, and platelets. J. Immunol. 1998;160:1929–1935. [PubMed] [Google Scholar]
- Norsworthy P.J., Fossati-Jimack L., Cortes-Hernandez J., Taylor P.R., Bygrave A.E., Thompson R.D., Nourshargh S., Walport M.J., Botto M. Murine CD93 (C1qRp) contributes to the removal of apoptotic cells in vivo but is not required for C1q-mediated enhancement of phagocytosis. J. Immunol. 2004;172:3406–3414. doi: 10.4049/jimmunol.172.6.3406. [DOI] [PubMed] [Google Scholar]
- Ohta M., Ishida A., Toda M., Akita K., Inoue M., Yamashita K., Watanabe M., Murata T., Usui T., Nakada H. Immunomodulation of monocyte-derived dendritic cells through ligation of tumor-produced mucins to Siglec-9. Biochem Biophysl Res Commun. 2010;402:663–669. doi: 10.1016/j.bbrc.2010.10.079. [DOI] [PubMed] [Google Scholar]
- Poulin L.F., Salio M., Griessinger E., Anjos-Afonso F., Craciun L., Chen J.L., Keller A.M., Joffre O., Zelenay S., Nye E. Characterization of human DNGR-1+ BDCA3+ leukocytes as putative equivalents of mouse CD8alpha+ dendritic cells. J. Exp. Med. 2010;207:1261–1271. doi: 10.1084/jem.20092618. [DOI] [PMC free article] [PubMed] [Google Scholar]
- Reynolds G., Haniffa M. Human and mouse mononuclear phagocyte networks: a tale of two species? Front. Immunol. 2015;6:330. doi: 10.3389/fimmu.2015.00330. [DOI] [PMC free article] [PubMed] [Google Scholar]
- Robbins S.H., Walzer T., Dembélé D., Thibault C., Defays A., Bessou G., Xu H., Vivier E., Sellars M., Pierre P. Novel insights into the relationships between dendritic cell subsets in human and mouse revealed by genome-wide expression profiling. Genome Biol. 2008;9:R17. doi: 10.1186/gb-2008-9-1-r17. [DOI] [PMC free article] [PubMed] [Google Scholar]
- Röck J., Schneider E., Grün J.R., Grützkau A., Küppers R., Schmitz J., Winkels G. CD303 (BDCA-2) signals in plasmacytoid dendritic cells via a BCR-like signalosome involving Syk, Slp65 and PLCgamma2. Eur. J. Immunol. 2007;37:3564–3575. doi: 10.1002/eji.200737711. [DOI] [PubMed] [Google Scholar]
- Salem M., Mony J.T., Løbner M., Khorooshi R., Owens T. Interferon regulatory factor-7 modulates experimental autoimmune encephalomyelitis in mice. J. Neuroinflammation. 2011;8:181. doi: 10.1186/1742-2094-8-181. [DOI] [PMC free article] [PubMed] [Google Scholar]
- Schlatzer D.M., Sugalski J., Dazard J.E., Chance M.R., Anthony D.D. A quantitative proteomic approach for detecting protein profiles of activated human myeloid dendritic cells. J. Immunol. Methods. 2012;375:39–45. doi: 10.1016/j.jim.2011.09.004. [DOI] [PMC free article] [PubMed] [Google Scholar]
- Segura E., Valladeau-Guilemond J., Donnadieu M.H., Sastre-Garau X., Soumelis V., Amigorena S. Characterization of resident and migratory dendritic cells in human lymph nodes. J. Exp. Med. 2012;209:653–660. doi: 10.1084/jem.20111457. [DOI] [PMC free article] [PubMed] [Google Scholar]
- Stephenson H.N., Mills D.C., Jones H., Milioris E., Copland A., Dorrell N., Wren B.W., Crocker P.R., Escors D., Bajaj-Elliott M. Pseudaminic acid on Campylobacter jejuni flagella modulates dendritic cell IL-10 expression via Siglec-10 receptor: a novel flagellin-host interaction. J. Infect. Dis. 2014;210:1487–1498. doi: 10.1093/infdis/jiu287. [DOI] [PMC free article] [PubMed] [Google Scholar]
- Theocharidis A., van Dongen S., Enright A.J., Freeman T.C. Network visualization and analysis of gene expression data using BioLayout Express(3D) Nat. Protoc. 2009;4:1535–1550. doi: 10.1038/nprot.2009.177. [DOI] [PubMed] [Google Scholar]
- Vizcaíno J.A., Csordas A., del-Toro N., Dianes J.A., Griss J., Lavidas I., Mayer G., Perez-Riverol Y., Reisinger F., Ternent T. 2016 update of the PRIDE database and its related tools. Nucleic Acids Res. 2016;44:D447–D456. doi: 10.1093/nar/gkv1145. [DOI] [PMC free article] [PubMed] [Google Scholar]
- Vu Manh T.P., Bertho N., Hosmalin A., Schwartz-Cornil I., Dalod M. Investigating evolutionary conservation of dendritic cell subset identity and functions. Front. Immunol. 2015;6:260. doi: 10.3389/fimmu.2015.00260. [DOI] [PMC free article] [PubMed] [Google Scholar]
- Wu X., Satpathy A.T., Kc W., Liu P., Murphy T.L., Murphy K.M. Bcl11a controls Flt3 expression in early hematopoietic progenitors and is required for pDC development in vivo. PLoS ONE. 2013;8:e64800. doi: 10.1371/journal.pone.0064800. [DOI] [PMC free article] [PubMed] [Google Scholar]
- Yu C.F., Peng W.M., Oldenburg J., Hoch J., Bieber T., Limmer A., Hartmann G., Barchet W., Eis-Hübinger A.M., Novak N. Human plasmacytoid dendritic cells support Th17 cell effector function in response to TLR7 ligation. J. Immunol. 2010;184:1159–1167. doi: 10.4049/jimmunol.0901706. [DOI] [PubMed] [Google Scholar]
- Ziegler-Heitbrock L., Ancuta P., Crowe S., Dalod M., Grau V., Hart D.N., Leenen P.J., Liu Y.J., MacPherson G., Randolph G.J. Nomenclature of monocytes and dendritic cells in blood. Blood. 2010;116:e74–e80. doi: 10.1182/blood-2010-02-258558. [DOI] [PubMed] [Google Scholar]
Associated Data
This section collects any data citations, data availability statements, or supplementary materials included in this article.