

Abstract
Recent work has demonstrated that human whole-brain functional connectivity patterns measured with fMRI contain information about cognitive abilities, including sustained attention. To derive behavioral predictions from connectivity patterns, our group developed a connectome-based predictive modeling (CPM) approach (Finn et al., 2015; Rosenberg et al., 2016). Previously using CPM, we defined a high-attention network, comprising connections positively correlated with performance on a sustained attention task, and a low-attention network, comprising connections negatively correlated with performance. Validating the networks as generalizable biomarkers of attention, models based on network strength at rest predicted attention-deficit/hyperactivity disorder (ADHD) symptoms in an independent group of individuals (Rosenberg et al., 2016). To investigate whether these networks play a causal role in attention, here we examined their strength in healthy adults given methylphenidate (Ritalin), a common ADHD treatment, compared with unmedicated controls. As predicted, individuals given methylphenidate showed patterns of connectivity associated with better sustained attention: higher high-attention and lower low-attention network strength than controls. There was significant overlap between the high-attention network and a network with greater strength in the methylphenidate group, and between the low-attention network and a network with greater strength in the control group. Network strength also predicted behavior on a stop-signal task, such that participants with higher go response rates showed higher high-attention and lower low-attention network strength. These results suggest that methylphenidate acts by modulating functional brain networks related to sustained attention, and that changing whole-brain connectivity patterns may help improve attention.
SIGNIFICANCE STATEMENT Recent work identified a promising neuromarker of sustained attention based on whole-brain functional connectivity networks. To investigate the causal role of these networks in attention, we examined their response to a dose of methylphenidate, a common and effective treatment for attention-deficit/hyperactivity disorder, in healthy adults. As predicted, individuals on methylphenidate showed connectivity signatures of better sustained attention: higher high-attention and lower low-attention network strength than controls. These results suggest that methylphenidate acts by modulating strength in functional brain networks related to attention, and that changing whole-brain connectivity patterns may improve attention.
Keywords: fMRI, functional connectivity, methylphenidate, neuromarker, predictive marker, sustained attention
Introduction
FMRI studies of human brain functional connectivity have traditionally described common features of network organization in the healthy population or have contrasted two groups, such as patients and controls. There is growing interest, however, in identifying neuromarkers of traits, behavior, clinical symptoms, and response to treatment to generate predictions about individual subjects (Whelan et al., 2014; Gabrieli et al., 2015). Encouraging work has identified connectivity-based biomarkers of sustained attention (Kessler et al., 2016; Rosenberg et al., 2016), distractibility (Poole et al., 2016), fluid intelligence (Smith et al., 2013; Finn et al., 2015), and response to math tutoring (Supekar et al., 2013). Investigating neuromarkers' generalizability and response to intervention will help clarify their functional roles and increase their clinical applicability.
We recently used a new technique, connectome-based predictive modeling (CPM; Finn et al., 2015; Rosenberg et al., 2016), to identify neuromarkers of sustained attention (Rosenberg et al., 2016). Sustained attention, the ability to maintain vigilance and focus over time, is an important aspect of attention frequently compromised in healthy and clinical populations (Robertson et al., 1997; Marchetta et al., 2008). CPM identified two functional networks related to sustained-attention task performance: a high-attention network of connections positively correlated with performance across individuals and a low-attention network of connections negatively correlated with performance. Models based on strength in these networks predicted novel individuals' performance from task-based and resting-state connectivity, and generalized to predict attention-deficit/hyperactivity disorder (ADHD) symptom severity in an independent group of children and adolescents from resting-state connectivity alone. Although there is strong evidence that these networks are reliable neuromarkers of sustained attention, their roles in attention and flexibility in response to treatment is not yet known.
One way to assess whether the high-attention and low-attention networks play a causal role in sustained attention is to perturb them and observe effects on behavior. However, because of the networks' distributed anatomy, which involves hundreds of edges and >100 overlapping nodes, selectively modulating their strength would be challenging. Another approach is to modify attentional abilities and examine effects on functional connectivity.
To investigate whether connectivity signatures of better sustained attention accompany interventions that improve attention, we compared attention network strength in healthy adults given a single dose of methylphenidate with network strength in unmedicated controls. Methylphenidate, a psychostimulant known by such trade names Ritalin and Concerta, is a common and effective pharmacological ADHD treatment (Goldman et al., 1998). Methylphenidate works by blocking norepinephrine and dopamine transporters, which increases extracellular catecholamine levels (Volkow et al., 2001; Berridge et al., 2006; Spencer et al., 2015). The drug improves memory and inhibitory control even in healthy populations (Ilieva et al., 2015). Therefore, we predict that individuals given methylphenidate will have higher high-attention and lower low-attention network strength than controls.
Previous work has found widespread effects of methylphenidate on functional connectivity. One study of children with ADHD found that methylphenidate normalized frontostriatal, frontocerebellar, and cerebellar–striatal connectivity during vigilance task performance (Rubia et al., 2011). Another, using resting-state data from individuals with cocaine-use disorder, showed that methylphenidate strengthened corticocortical and corticolimbic connections, and weakened connections between the dorsal striatum and other subcortical regions (Konova et al., 2013). Classifying medication state from healthy adults' resting-state data, Sripada and colleagues found that methylphenidate reduced connectivity within visual and somatomotor networks and between default mode and dorsal attention, ventral attention, and visual networks (Sripada et al., 2013). An earlier, seed-based analysis of data presented here showed methylphenidate-related differences in thalamus and dorsal striatum connectivity (Farr et al., 2014b). Thus, approaches that consider whole-brain connectivity may be particularly well suited for studying methylphenidate's distributed effects.
Here we present preliminary evidence that the high-attention and low-attention networks play a causal role in attention by demonstrating that methylphenidate affects their connectivity in predictable ways. That is, individuals given methylphenidate showed higher high-attention and lower low-attention network strength than unmedicated controls. This suggests that the sustained attention networks are malleable and may be good candidates for attention interventions.
Materials and Methods
Participants.
We used a dataset described in detail in previous work (Farr et al., 2014a,b). Briefly, 24 healthy participants were given a single 45 mg dose of methylphenidate ∼40 min before an fMRI scan session began. Although participants in this group had been told that they would either receive methylphenidate or a placebo, all received methylphenidate. These participants were debriefed after the scan session and none were sure that they had been given methylphenidate. Heart rate, blood pressure, and anxiety were measured as described in Farr et al., 2014b; changes in these from baseline measurements did not significantly correlate with any fMRI connectivity measures (Farr et al., 2014b, their Table S1). Ninety-two healthy participants were scanned as part of a control cohort. Control participants did not receive any drug and were not given any instructions about methylphenidate or placebo. Of this group, we used data from 70 individuals from whom both task and resting-state fMRI data had been collected.
After applying motion-exclusion criteria to task and resting-state runs, we ended up with two final groups: a rest cohort of participants with usable resting-state data, and a task cohort of participants with usable task data (see below, Motion controls, for a detailed explanation of how these groups were selected). The rest cohort included 16 individuals on methylphenidate and 56 controls, and the task cohort included 19 individuals on methylphenidate and 64 controls. Twelve participants on methylphenidate and 55 unmedicated controls appear in both cohorts. Age and gender breakdown did not differ between groups in the rest or the task cohort (Table 1).
Table 1.
Age and gender in participants with resting-state and task data
| Group | Rest cohort |
Task cohort |
||||
|---|---|---|---|---|---|---|
| Number |
Mean age in years (SD) | Number |
Mean age in years (SD) | |||
| Males | Females | Males | Females | |||
| Methylphenidate group | 9 | 7 | 24.7 (3.9) | 6 | 13 | 23.9 (4.1) |
| Control group | 21 | 35 | 24.9 (3.6) | 25 | 39 | 25.3 (3.7) |
| Between-group comparisona | χ2 (1, N = 72) = 1.8, p = 0.18 | t(70) = 0.23, p = 0.82 | χ2 (1, N = 83) = 0.35, p = 0.55 | t(81) = 1.39, p = 0.17 | ||
aχ2 Tests for independence were used to examine the relationship between gender and group membership.
Behavioral task.
Participants performed a stop-signal task during fMRI scanning (Farr et al., 2014a). Trials began with the appearance of a dot in the center of a screen. After a random interval between 1 and 5 s, the dot changed to a circle, the go signal. Participants were instructed to press a button as quickly as possible when the go signal appeared. After 1 s or a button press, the circle disappeared. Anticipatory responses also terminated the trial. Trials were separated by 2 s intervals.
On ∼25% of trials, an “X,” the stop signal, replaced the go signal shortly after it appeared. Participants were instructed to withhold response on stop trials. The stop-signal delay (SSD), the time between go and stop-signal onsets, was staircased within subject so that each participant was able to withhold response on approximately half of stop trials. The SSD began at 200 ms, and increased by 67 ms (making it more difficult to inhibit responding) after successful stop trials and decreased by 67 ms (making it easier to inhibit responding) after incorrect presses on stop trials. For each participant, stop-signal reaction time (SSRT) was computed by subtracting the critical SSD (the SSD required to successfully withhold response on 50% of stop trials) from the median reaction time (RT) on go trials.
Imaging parameters and preprocessing.
Scan sessions began with an anatomical scan. Participants next completed four 9:50 min stop-signal task runs and one 9:50 min resting-state run. During the resting-state run, participants were instructed to remain awake but keep their eyes closed.
FMRI data were collected at the Yale Magnetic Resonance Research Center on a 3T Siemens Trio TIM system. Functional runs included 295 whole-brain volumes acquired using an echo-planar imaging sequence with the following parameters: repetition time (TR) = 2000 ms; echo time (TE) = 25 ms; flip angle, 85°; field of view, 220 × 220 mm; acquisition matrix, 64 × 64; 32 axial slices parallel to the anterior commissure–posterior commissure (AC–PC) line; slice thickness, 4 mm (no gap). Parameters of the high-resolution T1-weighted gradient echo scan were as follows: TR = 2530 ms; TE = 3.66 ms; flip angle, 7°; field of view, 256 × 256 mm; acquisition matrix, 256 × 256; 176 slices parallel to the AC–PC line; slice thickness, 1 mm.
Data were analyzed using BioImage Suite (Joshi et al., 2011; RRID:SCR_002986) and custom Matlab scripts (Mathworks; RRID:SCR_001622). Images were motion corrected using SPM8 (RRID:SCR_007037). Linear and quadratic drift, mean signal from CSF, global signal, and a 24-parameter motion model including six motion parameters, six temporal derivatives, and their squares, were also regressed from the data. Data were temporally smoothed with a zero mean unit variance Gaussian filter. Spatial smoothing was not performed because work has demonstrated that smoothing volumetric data mixes signals from distinct cortical areas (Jo et al., 2007; Glasser et al., 2013). However, averaging the time courses of all the voxels in each node of our functional atlas (as described in Materials and Methods, Network construction) selectively smooths the data within each node.
Motion controls.
Runs with excessive head motion, defined a priori as >2 mm translation, >3° rotation, or >0.15 mm mean frame-to-frame displacement during a single run, were excluded from analysis. Six participants were excluded from all further analyses because of excessive motion in resting-state and task runs. Following visual inspection of the pitch, roll, and yaw time courses, four resting-state runs with obvious movements near the start or end were cropped to remove volumes associated with excessive motion. The first 49 volumes were removed from the beginning of two runs, the last 105 volumes were removed from the end of one run, and the last 95 were removed from the end of another. These newly cropped runs did not exceed >2 mm translation, >3° rotation, or >0.15 mm mean frame-to-frame displacement. The resting-state run was excluded from an additional 12 participants and all task runs were excluded from two participants due to excessive motion. In addition, one task run was excluded from 11 participants, two were excluded from four participants, and three were excluded from one participant because of motion.
Following exclusion for motion, 88 participants (65 controls) with ≥1 run of data remained. Of these, 76 (56 controls) had a resting-state run and 86 (64 controls) had ≥1 task run. To check whether the groups were matched for motion, we performed unpaired, two-tailed t tests comparing maximum head displacement, maximum head rotation, and mean frame-to-frame head motion during rest and task in the methylphenidate and control groups. In the individuals with rest data, there were no between-group differences in maximum displacement or rotation during rest (t(74) values <1.51, p values >0.13). However, there was significantly greater frame-to-frame motion in the methylphenidate group (t(74) = 2.81, p = 0.006). In the individuals with task data, there were no between-group differences in maximum displacement or rotation during task performance (|t(84)| values <0.32, p values >0.75). However, mean frame-to-frame displacement was higher in the methylphenidate group (t(84) = 1.97, p = 0.052).
To eliminate groupwise differences in mean frame-to-frame displacement, we excluded participants in the methylphenidate group with the highest mean frame-to-frame displacement one by one until groups were matched on all measures of motion. This resulted in the exclusion of resting-state data from four participants and task data from three other participants. In the final 72-participant rest cohort (the group of participants with resting-state data, which included 56 controls), there were no differences in maximum displacement, maximum rotation, or mean frame-to-frame displacement during rest between the methylphenidate and control groups (t(70) values <1.33, p values >0.18). There were also no between-group differences in motion during task in the final 83-participant task cohort (the group of participants with task data, which included 64 controls; t(81) values <1.22, p values >0.22). Importantly, data were excluded for motion before connectivity data were analyzed.
We did not regress mean motion statistics from each edge because this approach is limited to removing linear effects from the data (Power et al., 2014). Previous work has shown that it does not eliminate motion artifacts; instead, matching groups for motion is preferred (Hampson et al., 2012).
Network construction.
Whole-brain functional connectivity was assessed as described previously (Finn et al., 2015; Rosenberg et al., 2016). Briefly, network nodes were defined using the Shen 268-node functional brain atlas that included the cortex, subcortex, and cerebellum (Shen et al., 2013). The atlas was warped from MNI space into single-subject space via concatenation of a linear and nonlinear registration between the functional images, anatomical scans, and the MNI brain. The two transformations were calculated independently, combined into a single transform, and inverted. Transformations were estimated using intensity-based registration algorithms in BioImage Suite (Joshi et al., 2011).
For each participant in the task cohort, task matrices were calculated using data concatenated across usable task runs; for participants in the rest cohort, rest matrices were calculated using data from the single resting-state run. The first three frames of every run were excluded from analysis. For every node, a mean time course was calculated by averaging the time courses of all of its constituent voxels. Pairwise correlations were computed between all pairs of nodes, and Pearson correlation coefficients were Fisher z-transformed to yield symmetric 268 × 268 connectivity matrices.
High-attention and low-attention network strength.
Previous CPM work identified two large-scale brain networks that predict attention across individuals and datasets: a high-attention network (757 connections, or edges), whose strength predicts better attention (more successful performance on a sustained-attention task and less severe ADHD symptoms), and a low-attention network (630 edges), whose strength predicts worse attention (poorer attention task performance and more severe ADHD symptoms; Rosenberg et al., 2016). Both networks span the cortex, subcortex, and cerebellum.
Because methylphenidate improves attention in both healthy and impaired populations, we hypothesized that individuals given the drug would have higher high-attention network strength and lower low-attention network strength than control subjects. In other words, participants on methylphenidate should have connectivity profiles that look similar to those of people with strong sustained attentional abilities.
To test this prediction, for each participant, we calculated high-attention network strength as the dot product between the high-attention network mask (a 268 × 268 matrix with ones in cells where an edge was present and zeros elsewhere) and his or her task and/or rest matrix. Strength in the low-attention network was calculated the same way using the low-attention network mask. Unpaired, two-tailed t tests with no assumption of equal variance were used to compare high-attention and low-attention network strength in the methylphenidate and control groups during task and rest.
It is worth reiterating that the network-strength summary statistic (Finn et al., 2015; Rosenberg et al., 2016) is calculated by summing z-transformed correlation coefficients. Because these correlation coefficients can be either positive or negative, raw network strength is not especially informative. A network with a near-zero network strength value could include many edges with values close to zero, or could include many strongly positive and strongly negative edges. Rather, an individual's network strength is informative when considered relative to others. Additionally, a network with many weakly connected edges will have a higher network strength value than one with many strongly anticorrelated edges. It is therefore important to avoid making assumptions about the edge distribution of a network based on its network strength value.
To evaluate whether observed differences between the methylphenidate and control groups were unique to the sustained attention networks or attributable to overall effects on connectivity, we compared the groupwise difference in attention network strength with the difference in the strength of size-matched random networks. To this end, we generated 1000 random networks with 757 edges (the size of the high-attention network) and 1000 random networks with 630 edges (the size of the low-attention network). Random networks were selected from the full set of 35,778 edges with the constraint that they not include edges that appeared in either attention network. For every participant in the rest cohort, we calculated strength in every random network during rest, and for every participant in the task cohort, we calculated strength in every random network during task performance. As before, strength was calculated by summing the z-transformed r values in each network. Unpaired, two-tailed t tests with no assumption of equal variance were used to compare strength in these networks in the methylphenidate and control groups. By comparing the t statistics obtained from these tests with the t statistics obtained for the attention network comparisons described above, we were able to determine how many random networks differed between groups to an equal or greater degree than the attention networks.
Methylphenidate networks.
We used the Network Based Statistic (NBS) Toolbox (RRID:SCR_002454; sites.google.com/site/bctnet/comparison/nbs) to identify brain networks that differed between the methylphenidate and control groups during rest and task. The NBS controls for the huge number of multiple comparisons involved in testing for differences at every edge in a connectivity matrix by comparing the size of identified networks with the size of random networks (Zalesky et al., 2010).
First, unpaired, one-tailed t tests were performed at every edge in the rest (and task) matrices (35,778 total) to identify edges that were greater (i.e., had higher r-values) in either the methylphenidate or control group at a chosen significance threshold. Next, the largest fully connected component of edges was selected from this set. Group labels were then permuted 5000 times and a t test was performed at every edge to obtain 5000 sets of edges that differed between the random groups. For each randomization, the size of the largest connected component of edges was recorded. The p value associated with the identified methylphenidate network was computed as (1 + the number of random networks with fully connected components equal to or larger than the identified network)/(1 + the number of permutations). Networks were considered significant if their associated p value was <0.004 (0.05 Bonferroni's corrected for 12 comparisons).
This procedure was repeated four times using each of three significance thresholds at the edge-selection step (p < 0.001, p < 0.01, and p < 0.05) to identify Methylphenidate > Control and Control > Methylphenidate networks in the rest and task cohorts. We refer to the Methylphenidate > Control networks as methylphenidate networks and the Control > Methylphenidate networks as unmedicated networks.
Network overlap.
Because methylphenidate is an effective treatment for attention dysfunction, we hypothesized that there would be significant overlap between the methylphenidate and high-attention networks, and significant overlap between the unmedicated and low-attention networks. To investigate the relationship between the networks, we counted the number of edges in the methylphenidate and unmedicated networks that appeared in the high-attention and low-attention networks. The significance of network overlap was determined with the hypergeometric cumulative density function, which returns the probability of drawing up to x of K possible items in n drawings without replacement from an M-item population. This was implemented in Matlab as follows: p = 1 − hygecdf(x, M, K, n), where x equals the number of overlapping edges, K equals the number of edges in the attention network of interest (high, 757; low, 630), n equals the number of edges in the methylphenidate network of interest, and M equals the total number of edges in the matrix (35,778).
Effects of methylphenidate on behavior.
Previous work using this dataset found that participants in the methylphenidate group responded more frequently to go trials than did participants in the control group (Farr et al., 2014a). We evaluated whether stop-signal task behavior differed between the methylphenidate and control groups in our sample with unpaired, two-tailed t tests with no assumption of equal variance. We tested four behavioral measures: go response rate (the percentage of the time an individual correctly responded to go trials), median go trial RT, critical SSD (the estimated delay between a go and stop signal required for an individual to successfully withhold response to half of all stop trials), and SSRT (median go trial RT − critical SSD).
Behavioral prediction.
The sustained attention CPM predicts attentional performance, operationalized as sensitivity (d′) on the gradual-onset continuous performance task (Esterman et al., 2013; Rosenberg et al., 2013), a challenging test of sustained attention, from high-attention and low-attention network strength (Rosenberg et al., 2016). Although the sustained attention CPM was designed to predict sustained attentional abilities, it may also generalize to predict performance on other attention tasks. Here we tested whether the sustained attention CPM predicts performance on the stop-signal task, which measures inhibitory control and impulsivity.
The sustained attention CPM includes the high-attention and low-attention networks and a linear model with three terms: a coefficient for high-attention network strength, a coefficient for low-attention network strength, and a constant. For every participant in the task cohort, we input high-attention and low-attention network strength during task to the sustained attention CPM to generate a predicted d′. We performed an identical analysis in the rest cohort to generate d′ predictions from resting-state matrices. The model's output, predicted d′, is a measure of how we would expect that person to perform if they were given the same taxing attention task that subjects in the model's training set performed. In essence, it is a predicted measure of a person's overall ability to sustain attention. Predictive power was assessed with Pearson correlations between predicted d′ values and four behavioral variables of interest (go response rate, median go trial RT, SSD, and SSRT).
Results
High-attention and low-attention network strength
As predicted, strength in the high-attention network was significantly higher in the methylphenidate group than in the control group during rest (t(24.57) = 4.35, p = 0.002) and task performance (t(54.28) = 3.45, p = 0.001; Fig. 1). Also as expected, strength in the low-attention network was lower in the methylphenidate group than in the control group during rest (t(27.66) = −3.92, p = 0.005) and task performance (t(50.39) = −2.29, p = 0.027). Because the methylphenidate group showed higher high-attention but lower low-attention network strength, methylphenidate's effect cannot be explained by an overall effect on functional connectivity. In addition, because the high-attention and low-attention networks are anatomically intertwined, it is highly unlikely that differences are explained by motion (see Materials and Methods, Motion controls and, below, Network strength motion control, for analyses ruling out motion confounds).
Figure 1.

Strength in the high-attention network (orange) and low-attention network (turquoise) in the methylphenidate and control groups. Network strength was calculated in the rest cohort during rest and the task cohort during task performance, and was normalized within each graph for visualization. Dots represent individual participants, horizontal lines denote group means, and error bars represent standard error of the mean. *p < 0.05 corrected for four comparisons; †p = 0.027 uncorrected.
The difference in high-attention network strength between the methylphenidate and control groups was greater than the groupwise difference in the strength of 99.8% of random networks during rest (equivalent to a p value of 3/1001, or 0.003) and 98.7% of random networks during task (p = 0.014). The difference in low-attention network strength between the methylphenidate and control groups was greater than the groupwise difference in the strength of 99.8% of random networks during rest (p = 0.003) and 90.9% of random networks during task (p = 0.09). Thus, the effects of methylphenidate are highly specific to the previously identified attention networks.
Network strength motion control
Although the methylphenidate and control groups are statistically matched for motion, even slight differences in head movement could affect the attention network results. To ensure that motion does not account for our findings, we calculated high-attention and low-attention network strength in newly defined “high-motion” and “low-motion” groups.
First, in the rest cohort, we called the 16 participants with the highest mean frame-to-frame head movement during rest the “high-motion rest group,” and the remaining 56 participants the “low-motion rest group.” These group sizes match the size of the methylphenidate and control groups in the rest cohort. Note, however, that the high-motion group only had relatively high motion, since strict motion-exclusion criteria had already been applied. High-motion and low-motion task groups were also defined using frame-to-frame head motion during task performance (Table 2).
Table 2.
High-motion and low-motion groups were defined independently in the rest and task cohortsa
| Rest cohort (n = 72) |
Task cohort(n = 83) |
|||||
|---|---|---|---|---|---|---|
| Total | Methylphenidate | Control | Total | Methylphenidate | Control | |
| High-motion group (n) | 16 | 7 | 9 | 19 | 4 | 15 |
| Low-motion group (n) | 56 | 9 | 47 | 64 | 15 | 49 |
| High-attention network strength | t(36.52) = 0.09, p = 0.93 | t(6.67) = 0.05, p = 0.96 | ||||
| Low-attention network strength | t(35.92) = 0.43, p = 0.67 | t(24.08) = 0.65, p = 0.52 | ||||
aThe “High-attention network strength” and “Low-attention network strength” rows show the results of t test comparing strength in the high-motion and low-motion groups.
If the high-attention and low-attention networks are simply a group of edges differentially affected by motion, comparing network strength in the high-motion and low-motion groups should yield differences—even exaggerated ones. However, this explanation is unlikely because we did not observe significant differences in the strength of the high-attention or low-attention networks between the high-motion and low-motion groups during rest or task performance (Table 2).
Methylphenidate network anatomy
We identified networks that significantly differed between the methylphenidate and control groups during task performance and rest (Figs. 2, 3). Depending on the primary significance threshold applied in the NBS procedure, networks ranged in size from hundreds to thousands of edges (Table 3), and spanned the cortex, subcortex, and cerebellum. Although network anatomy was complex, several trends emerged.
Figure 2.

The first three rows of circle plots show the functional networks that significantly differ between the methylphenidate and control groups. The Methylphenidate > Control networks (the methylphenidate networks) are shown in red and the Control > Methylphenidate networks (the unmedicated networks) are shown in blue. Networks were defined separately using task and rest matrices with a range of thresholds at the edge-selection step. Edges in both the high-attention and methylphenidate networks and in both the low-attention and unmedicated networks are shown in bold. The high-attention and low-attention networks, defined to predict performance on an attention task in an independent group of participants, are visualized in the fourth row of circle plots. Nodes are grouped by macroscale region, including the prefrontal cortex, motor cortex, insula, parietal cortex, temporal cortex, occipital cortex, limbic lobe (including the cingulate cortex, amygdala, and hippocampus), cerebellum, subcortex (thalamus and striatum), and brainstem. The right half of the circle represents the right hemisphere of the brain.
Figure 3.
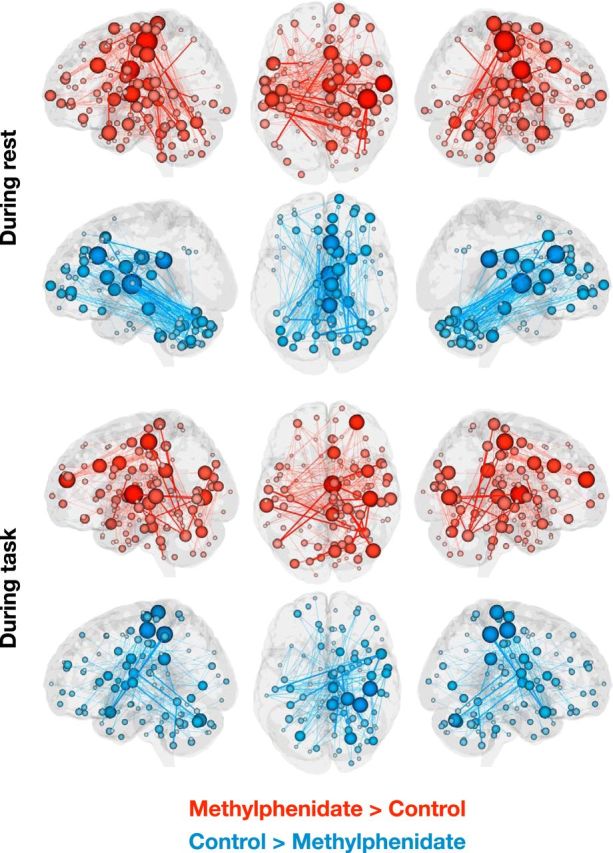
Functional networks that differ between the methylphenidate and control groups at an edge-selection threshold of p = 0.001 (these networks are also shown in Fig. 2, third row of circle plots). Lines represent edges that differ between groups; lines in bold represent edges that also appear in the high-attention or low-attention network. Spheres, representing nodes, are sized according to the number of edges in which they participate. The right hemisphere of the axial view represents the right hemisphere of the brain.
Table 3.
Size and significance of networks that differed between the methylphenidate and control groups during rest and task performance. P values were determined using the NBS with 5000 permutations
| Significance threshold at edge selection | Methylphenidate > control |
Control > methylphenidate |
||
|---|---|---|---|---|
| Rest cohort | Task cohort | Rest cohort | Task cohort | |
| p = 0.05 | 4218 edges; p = 1/5001 | 4083 edges; p = 1/5001 | 3942 edges; p = 1/5001 | 3836 edges; p = 1/5001 |
| p = 0.01 | 1614 edges; p = 1/5001 | 1585 edges; p = 1/5001 | 1495 edges; p = 1/5001 | 1355 edges; p = 1/5001 |
| p = 0.001 | 473 edges; p = 1/5001 | 411 edges; p = 1/5001 | 333 edges; p = 1/5001 | 288 edges; p = 2/5001 |
The Methylphenidate > Control, or methylphenidate, networks included connections between the cerebellum and motor, parietal, temporal, and occipital cortices; connections between the temporal lobe and limbic, subcortical, and brainstem regions; and connections between motor cortex and the brainstem and subcortex (Figs. 2, 4). Connections in the Control > Methylphenidate, or unmedicated, networks fell between prefrontal, cerebellar, subcortical, and brainstem regions. The unmedicated networks also included and temporal-parietal connections. The similarity of these patterns to the high-attention and low-attention networks (Rosenberg et al., 2016) is striking given that they were defined using different approaches (between-group t tests with NBS correction vs regressions between edge strength and d′ on an attention task) in independent datasets collected under different experimental designs, at different times, with different scan parameters. This remarkable consistency provides further evidence that large-scale brain networks can serve as generalizable biomarkers of attention.
Figure 4.

Differences in the number of edges between each pair of regions. The value in each cell was calculated by subtracting the number of edges in the unmedicated network from the number of edges in the methylphenidate network. Networks defined at an edge-selection threshold of p = 0.05 (Fig. 2, top row of circle plots) were used for this visualization.
Mirroring a pattern observed in the sustained attention networks, the cerebellum played an important role in the methylphenidate and unmedicated networks during task and rest. Again, the number of connections between the cerebellum and motor, parietal, temporal, and occipital regions was consistently greater in the methylphenidate networks (Fig. 4), whereas the number of within-cerebellar connections and connections between the cerebellum and subcortical, brainstem, prefrontal, and limbic regions was consistently greater in the unmedicated networks. The frequent participation of the cerebellum in both networks is noteworthy given recent emphasis on the cerebellum's role in functional connectivity networks related to cognition (Habas et al., 2009; Buckner et al., 2011).
Connectivity differences between the methylphenidate and control groups were generally similar across resting-state and task-based connectivity, which makes sense given previous work showing that an individual's unique connectivity pattern is remarkably consistent across cognitive states (Finn et al., 2015). Difference matrices, calculated by subtracting the number of edges between each pair of macroscale regions in the unmedicated network from the number in the methylphenidate network, were highly correlated across the states (r = 0.80; Fig. 4). Limbic and occipital lobes were notable exceptions. Occipitomotor connections and connections between limbic regions and prefrontal, insular, and subcortical regions were more likely to appear in the unmedicated network during rest but in the methylphenidate network during task performance. On the other hand, connections between limbic regions and motor, parietal, and occipital cortices, and connections between occipital cortex and insular, temporal, and brainstem regions were more likely to appear in the methylphenidate network during rest but in the unmedicated network during task. That said, differences between effects of methylphenidate on task-based and resting-state connectivity are difficult to interpret because the task and rest cohorts contain overlapping but different groups of participants, and there are ≤4 times more task-based than resting-state data for each participant. Future work should further consider the interaction between effects of methylphenidate and cognitive state.
Network overlap
As hypothesized, there was significant overlap between the methylphenidate and high-attention networks and between the unmedicated and low-attention networks (Fig. 2, connections in bold). There was no significant overlap between the methylphenidate and low-attention networks, or between the unmedicated and high-attention networks. This pattern of results held during task and at rest, and at every significance threshold applied at the edge-selection step during the methylphenidate network definition (Fig. 5 and Table 4).
Figure 5.

Number of edges in methylphenidate and unmedicated networks that also appear in independently defined attention networks. Because methylphenidate improves attention, we expect overlap between the high-attention and methylphenidate networks and overlap between the low-attention and unmedicated networks. This pattern of results is robust to the particular edge-selection threshold (p < 0.001, p < 0.01, p < 0.05) applied during network definition. P values associated with amount of overlap can be found in Table 4.
Table 4.
P values associated with the degree of overlap between the attention and the methylphenidate-related networksa
| High attention |
Low attention |
|||||||||||
|---|---|---|---|---|---|---|---|---|---|---|---|---|
| Rest cohort | Task cohort | Rest cohort | Task cohort | |||||||||
| Significance threshold at edge selection | 0.001 | 0.01 | 0.05 | 0.001 | 0.01 | 0.05 | 0.001 | 0.01 | 0.05 | 0.001 | 0.01 | 0.05 |
| Methylphenidate > control network | 1.1e−8b | <1e−20b | <1e−20b | 4.3e−12b | 4.7e−15b | <1e−20b | >0.99 | >0.99 | >0.99 | >0.99 | >0.99 | >0.99 |
| Control > methylphenidate network | >0.99 | >0.99 | >0.99 | 0.73 | >0.99 | >0.99 | 7.7e−9b | <1e−20b | <1e−20b | 5.4e−3b | 1.7e−4b | 1.6e−5b |
aOverlap was calculated from methylphenidate-related networks defined at each of three significance thresholds.
bSignificant overlap was expected; survived Bonferroni's correction for 24 comparisons.
Of the edges that appeared in both the high-attention and methylphenidate networks, the majority involved the cerebellum (42% of overlapping edges at rest and 50% of overlapping edges during stop-signal task performance), temporal lobe (49% at rest and 40% during task), or occipital lobe (29% at rest and 37% during task). Note that percentages can sum to >100% because each edge involves two nodes that may be in different macroscale brain regions. Of the edges that overlapped between the low-attention and unmedicated networks, a similar pattern emerged. Edges were most likely to involve the cerebellum (57% of overlapping edges at rest and 50% of overlapping edges during task) or temporal lobe (24% at rest and 40% during task). The occipital lobe was heavily represented in the overlapping edges during task performance (37%), but not rest (5%). The involvement of cerebellar, temporal, and occipital connections in both the methylphenidate and control networks reinforces the importance of considering node pairs rather than nodes in isolation when predicting attention.
Effects of methylphenidate on behavior
Similar to previous work analyzing a superset of these data (we used fewer participants due to stricter motion-exclusion criteria; Farr et al., 2014a), there were no differences in behavioral performance in the rest and task cohorts that survived Bonferroni's correction for multiple comparisons. Although this difference did not survive correction for multiple comparisons, the methylphenidate group of our task cohort responded more frequently to go trials than did the control group (99.2 vs 97.9%, t(47.54) = 2.51, p = 0.016). In the rest cohort, the go response rate was 99.2% in the methylphenidate group and 98.2% in the control group (t(29.64) = 1.91, p = 0.07). More pronounced effects of methylphenidate on performance might have been observed in a sample of patients with ADHD as opposed to healthy adults (Farr et al., 2014a).
Behavioral prediction
Predictions of the sustained attention CPM, which was trained in an independent dataset, were significantly correlated with the go response rate in the task and rest cohorts (predictions from resting-state connectivity: r = 0.34, p = 0.004; predictions from task-based connectivity: r = 0.59, p = 4.8e−9; both survive Bonferroni's correction for eight comparisons; Fig. 6; recall that the rest cohort includes participants with a usable resting-state matrix and the task cohort includes participants with a usable task matrix, so the groups largely but not completely overlap). That is, when the model predicted that a person had a strong ability to sustain attention based on a connectivity pattern observed during task performance or rest alone, he or she made more-frequent correct responses to go trials on the stop-signal task. These correlations were not solely driven by the higher go response rate and higher high-attention network strength in the methylphenidate group, as predictions were correlated with the go response rate in the control group alone (rest: r = 0.31, p = 0.02; task: r = 0.63, p = 2.5e−8). Sustained attention CPM predictions were not significantly correlated with median go RT, SSD, or SSRT (p values >0.13).
Figure 6.

The sustained attention CPM significantly predicted the frequency with which participants correctly responded to go trials in the stop-signal task from connectivity matrices calculated during rest and task performance. Predictions from resting-state matrices were generated in the rest cohort (n = 72) and predictions from task matrices were generated in the task cohort (n = 83).
This pattern of results is interesting because, of the four behavioral variables tested, the go response rate may be most closely related to sustained attention. In the sustained attention CPM's training set, sustained attention was measured with d′, hit rate relative to false-alarm rate, on a continuous performance task. The most comparable measures to hit and false-alarm rates in the stop-signal task are the go response rate and the failure-to-stop rate. However, because the SSD was staircased so that each participant achieved a stop rate of ∼50%, d′ is not an informative measure of performance in this task. The go response rate is, therefore, the most closely related to d′ and may be the most straightforward measure of sustained attention. It is also the only measure to show trend-level improvement in the methylphenidate group relative to the control group. It is notable that strength in the high-attention and low-attention networks, significantly modulated by methylphenidate, predicted the behavioral measure most improved by the drug.
Discussion
Individual differences in the ability to sustain attention have been linked to large-scale functional connectivity networks (Castellanos et al., 2009; Kessler et al., 2016; Rosenberg et al., 2016). However, the precise role that these networks play in attention and their relationship to changes in attentional abilities are not yet known. Here we investigated the effects of a pharmacological ADHD treatment, methylphenidate, on whole-brain functional connectivity as a way to clarify the role these networks play in the ability to maintain focus over time.
Suggesting that sustained-attention network strength is malleable—and that changes in network strength are related to improvements in attention—we found that healthy adults given methylphenidate showed connectivity profiles more consistent with strong attentional abilities than did control subjects. That is, individuals on methylphenidate had higher high-attention and lower low-attention network strength than unmedicated individuals. Although within-subject comparisons between on-methylphenidate and off-methylphenidate conditions would be the strongest test of this hypothesis, the current results provide compelling evidence that modulations of attention network strength underlie the attention-related benefits of methylphenidate.
Previous research has shown that methylphenidate is effective in improving attention in both healthy and impaired populations (Goldman et al., 1998; Smith et al., 2000; Schachter et al., 2001; Faraone et al., 2004; Wood et al., 2014; Ilieva et al., 2015). In the current sample, there was a trend toward more-frequent correct responding on go trials of the stop-signal task in the methylphenidate group than in the control group. The lack of between-group differences on other measures of stop-signal performance could be due to a ceiling effect given that participants were healthy young adults (Farr et al., 2014a). However, given the extensive literature on attention-related benefits of methylphenidate, we can be confident that participants in the methylphenidate group did receive a benefit of the drug. Follow-up experiments with tasks that place heavier burdens on sustained attention might be more sensitive to the benefits of methylphenidate in healthy populations.
Remarkably, the sustained attention CPM, which was trained in an independent dataset to predict attentional performance from high-attention and low-attention network strength (Rosenberg et al., 2016), predicted the go response rate in the current sample from both task-based and resting-state connectivity. Confirming that success was not driven exclusively by between-group differences, predictions of the sustained attention CPM were significant in the control group alone. This result provides further evidence that the sustained attention CPM generalizes out of sample, making it a robust neuromarker of sustained attention. It also demonstrates that methylphenidate affects connectivity networks related to the behavior it improves, suggesting a mechanism of action. Future work using CPM could explore whether methylphenidate also affects networks related to other behavioral measures associated with attentional performance, such as response speed and inhibitory control.
The significant overlap between the high-attention and methylphenidate networks, and between the low-attention and unmedicated networks, further supports the conclusion that methylphenidate acts by modulating brain networks related to attention. Beyond just the specific overlapping edges, the two sets of networks show extraordinarily similar edge patterns, which is especially remarkable considering that attention networks were defined using CPM to predict performance on a sustained-attention task whereas the methylphenidate and unmedicated networks were defined using groupwise t tests with NBS correction in independent datasets. Both “more successful” attention networks (the high-attention and methylphenidate networks) include relatively more prefrontal–occipital, temporal–subcortical, and temporal–brainstem connections, and connections between the cerebellum and the motor, parietal, temporal, and occipital cortices. Both “less successful” networks (the low-attention and unmedicated networks) include relatively more connections between the prefrontal cortex and the subcortex and cerebellum; within-prefrontal, intracerebellar, and temporal–parietal connections; and connections between the cerebellum and the brainstem and subcortex. The networks' distributed anatomy provides further evidence that large-scale networks support the ability to sustain attention (Langner and Eickhoff, 2013; Rosenberg et al., 2015, 2016) and reinforces the value of whole-brain, data-driven approaches in functional-connectivity analyses. The substantial, but not complete, overlap between the attention-related and methylphenidate-related networks also holds promise for future work that aims to define maximally generalizable network models of sustained attention or to identify a particular subset of edges that respond to pharmacological or behavioral intervention.
In addition to providing further support for the sustained attention CPM, the current results complement work on the functional connectivity changes associated with methylphenidate in several ways. We replicated effects observed previously (Farr et al., 2014b), finding that connections between subcortical and motor regions were more frequent in the methylphenidate networks, whereas connections between subcortical and prefrontal regions were more frequent in the unmedicated networks. Our results also agree with findings that methylphenidate strengthens cerebellar–motor connections (Konova et al., 2013), and weakens cerebellar–limbic (Konova et al., 2013) and intraoccipital connections (Sripada et al., 2013). We did not find other effects that have been observed previously, such as increased frontostriatal, frontocerebellar, and cerebellar–striatal connectivity with methylphenidate (Rubia et al., 2011), but differences in the study sample (healthy adults vs children diagnosed with ADHD) could account for these discrepancies. Together with previous work, our findings provide evidence that methylphenidate has widespread effects on brain connectivity that may underlie its performance benefits.
Despite the promising generalizability of the sustained attention CPM, our conclusions are limited by our dataset's between-subjects design and lack of placebo control. These would have been ideal to include, but we were practically constrained by the original study design. For several reasons, we do not believe that this limitation affects our conclusions. First, a vast number of studies have shown that methylphenidate enhances sustained attention above and beyond placebo controls (for a recent review, see Linssen et al., 2014), making it likely that our findings can be attributed to methylphenidate. Accordingly, our design followed other influential methylphenidate fMRI studies that used between-subjects designs with matched control groups but without placebo to maximize experimental power (Liddle et al., 2011; Tomasi et al., 2011). Second, a survey of the literature reveals that expecting to receive methylphenidate but actually receiving placebo does not improve cognitive performance in healthy college students (Looby and Earleywine, 2011), and that placebos for ADHD medications do not produce significant effects in the behavior or cognition of elementary school-age children with ADHD (Waschbusch et al., 2009). Instead, placebo effects appear to influence the adults evaluating children with ADHD, highlighting the utility of objective assessment tools, such as our sustained attention CPM here.
Thus, we propose that methylphenidate modulates the strength of networks that predict sustained-attentional performance. Our result suggests a causal relationship between attention network strength and attention function, and motivates exciting new avenues of research. For example, it is possible that increasing high-attention and decreasing low-attention network strength with other interventions, such as real-time neurofeedback (Stoeckel et al., 2014), could improve attentional abilities. More generally, the current findings underscore the power of CPM for generating neuromarkers of traits and behavior, and highlight the importance of probing the functional roles and cross-dataset generalizability of these network-based biomarkers.
Footnotes
This work was supported by the Yale Faculty of Arts and Sciences MRI Program funded by the Office of the Provost and the Department of Psychology; National Science Foundation Graduate Research Fellowships to M.D.R. and E.S.F.; and National Institutes of Health (NIH) Grants EB009666 to R.T.C. and T32 DA022975 to D.S. Data collection was supported by NIH Grants K25DA040032 (to S.Z.), DA023248, DA026990, and AA021449. We thank Xenophon Papademetris for help with data processing.
The authors declare no competing financial interests.
References
- Berridge CW, Devilbiss DM, Andrzejewski ME, Arnsten AF, Kelley AE, Schmeichel B, Hamilton C, Spencer RC. Methylphenidate preferentially increases catecholamine neurotransmission within the prefrontal cortex at low doses that enhance cognitive function. Biol Psychiatry. 2006;60:1111–1120. doi: 10.1016/j.biopsych.2006.04.022. [DOI] [PubMed] [Google Scholar]
- Buckner RL, Krienen FM, Castellanos A, Diaz JC, Yeo BT. The organization of the human cerebellum estimated by intrinsic functional connectivity. J Neurophysiol. 2011;106:2322–2345. doi: 10.1152/jn.00339.2011. [DOI] [PMC free article] [PubMed] [Google Scholar]
- Castellanos FX, Kelly C, Milham MP. The restless brain: attention-deficit hyperactivity disorder, resting-state functional connectivity, and intrasubject variability. Can J Psychiatry. 2009;54:665–672. doi: 10.1177/070674370905401003. [DOI] [PMC free article] [PubMed] [Google Scholar]
- Esterman M, Noonan SK, Rosenberg M, Degutis J. In the zone or zoning out? Tracking behavioral and neural fluctuations during sustained attention. Cereb Cortex. 2013;23:2712–2723. doi: 10.1093/cercor/bhs261. [DOI] [PubMed] [Google Scholar]
- Faraone SV, Spencer T, Aleardi M, Pagano C, Biederman J. Meta-analysis of the efficacy of methylphenidate for treating adult attention-deficit/hyperactivity disorder. J Clin Psychopharmacol. 2004;24:24–29. doi: 10.1097/01.jcp.0000108984.11879.95. [DOI] [PubMed] [Google Scholar]
- Farr OM, Hu S, Matuskey D, Zhang S, Abdelghany O, Li C-SR. The effects of methylphenidate on cerebral activations to salient stimuli in healthy adults. Exp Clin Psychopharmacol. 2014a;22:154–165. doi: 10.1037/a0034465. [DOI] [PMC free article] [PubMed] [Google Scholar]
- Farr OM, Zhang S, Hu S, Matuskey D, Abdelghany O, Malison RT, Li CS. The effects of methylphenidate on resting-state striatal, thalamic and global functional connectivity in healthy adults. Int J Neuropsychopharmacol. 2014b;17:1177–1191. doi: 10.1017/S1461145714000674. [DOI] [PMC free article] [PubMed] [Google Scholar]
- Finn ES, Shen X, Scheinost D, Rosenberg MD, Huang J, Chun MM, Papademetris X, Constable RT. Functional connectome fingerprinting: identifying individuals using patterns of brain connectivity. Nat Neurosci. 2015;18:1664–1671. doi: 10.1038/nn.4135. [DOI] [PMC free article] [PubMed] [Google Scholar]
- Gabrieli JD, Ghosh SS, Whitfield-Gabrieli S. Prediction as a humanitarian and pragmatic contribution from human cognitive neuroscience. Neuron. 2015;85:11–26. doi: 10.1016/j.neuron.2014.10.047. [DOI] [PMC free article] [PubMed] [Google Scholar]
- Glasser MF, Sotiropoulos SN, Wilson JA, Coalson TS, Fischl B, Andersson JL, Xu J, Jbabdi S, Webster M, Polimeni JR, Van Essen DC, Jenkinson M, Jenkinson M. The minimal preprocessing pipelines for the Human Connectome Project. Neuroimage. 2013;80:105–124. doi: 10.1016/j.neuroimage.2013.04.127. [DOI] [PMC free article] [PubMed] [Google Scholar]
- Goldman LS, Genel M, Bezman RJ, Slanetz PJ. Diagnosis and treatment of attention-deficit/hyperactivity disorder in children and adolescents. Council on Scientific Affairs, American Medical Association. JAMA. 1998;279:1100–1107. doi: 10.1001/jama.279.14.1100. [DOI] [PubMed] [Google Scholar]
- Habas C, Kamdar N, Nguyen D, Prater K, Beckmann CF, Menon V, Greicius MD. Distinct cerebellar contributions to intrinsic connectivity networks. J Neurosci. 2009;29:8586–8594. doi: 10.1523/JNEUROSCI.1868-09.2009. [DOI] [PMC free article] [PubMed] [Google Scholar]
- Hampson M, Tokoglu F, Shen X, Scheinost D, Papademetris X, Constable RT. Intrinsic brain connectivity related to age in young and middle aged adults. PLoS One. 2012;7:e44067. doi: 10.1371/journal.pone.0044067. [DOI] [PMC free article] [PubMed] [Google Scholar]
- Ilieva IP, Hook CJ, Farah MJ. Prescription stimulants' effects on healthy inhibitory control, working memory, and episodic memory: a meta-analysis. J Cogn Neurosci. 2015;27:1069–1089. doi: 10.1162/jocn_a_00776. [DOI] [PubMed] [Google Scholar]
- Jo HJ, Lee JM, Kim JH, Shin YW, Kim IY, Kwon JS, Kim SI. Spatial accuracy of fMRI activation influenced by volume- and surface-based spatial smoothing techniques. Neuroimage. 2007;34:550–564. doi: 10.1016/j.neuroimage.2006.09.047. [DOI] [PubMed] [Google Scholar]
- Joshi A, Scheinost D, Okuda H, Belhachemi D, Murphy I, Staib LH, Papademetris X. Unified framework for development, deployment and robust testing of neuroimaging algorithms. Neuroinformatics. 2011;9:69–84. doi: 10.1007/s12021-010-9092-8. [DOI] [PMC free article] [PubMed] [Google Scholar]
- Kessler D, Angstadt M, Sripada C. Growth charting of brain connectivity networks and the identification of attention impairment in youth. JAMA Psychiatry. 2016;73:481–489. doi: 10.1001/jamapsychiatry.2016.0088. [DOI] [PMC free article] [PubMed] [Google Scholar]
- Konova AB, Moeller SJ, Tomasi D, Volkow ND, Goldstein RZ. Effects of methylphenidate on resting-state functional connectivity of the mesocorticolimbic dopamine pathways in cocaine addiction. JAMA Psychiatry. 2013;70:857–868. doi: 10.1001/jamapsychiatry.2013.1129. [DOI] [PMC free article] [PubMed] [Google Scholar]
- Langner R, Eickhoff SB. Sustaining attention to simple tasks: a meta-analytic review of the neural mechanisms of vigilant attention. Psychol Bull. 2013;139:870–900. doi: 10.1037/a0030694. [DOI] [PMC free article] [PubMed] [Google Scholar]
- Liddle EB, Hollis C, Batty MJ, Groom MJ, Totman JJ, Liotti M, Scerif G, Liddle PF. Task-related default mode network modulation and inhibitory control in ADHD: effects of motivation and methylphenidate. J Child Psychol Psychiatry. 2011;52:761–771. doi: 10.1111/j.1469-7610.2010.02333.x. [DOI] [PMC free article] [PubMed] [Google Scholar]
- Linssen AM, Sambeth A, Vuurman EF, Riedel WJ. Cognitive effects of methylphenidate in healthy volunteers: a review of single dose studies. Int J Neuropsychopharmacol. 2014;17:961–977. doi: 10.1017/S1461145713001594. [DOI] [PubMed] [Google Scholar]
- Looby A, Earleywine M. Expectation to receive methylphenidate enhances subjective arousal but not cognitive performance. Exp Clin Psychopharmacol. 2011;19:433–444. doi: 10.1037/a0025252. [DOI] [PMC free article] [PubMed] [Google Scholar]
- Marchetta ND, Hurks PP, De Sonneville LM, Krabbendam L, Jolles J. Sustained and focused attention deficits in adult ADHD. J Atten Disord. 2008;11:664–676. doi: 10.1177/1087054707305108. [DOI] [PubMed] [Google Scholar]
- Poole VN, Robinson ME, Singleton O, DeGutis J, Milberg WP, McGlinchey RE, Salat DH, Esterman M. Intrinsic functional connectivity predicts individual differences in distractibility. Neuropsychologia. 2016;86:176–182. doi: 10.1016/j.neuropsychologia.2016.04.023. [DOI] [PubMed] [Google Scholar]
- Power JD, Mitra A, Laumann TO, Snyder AZ, Schlaggar BL, Petersen SE. Methods to detect, characterize, and remove motion artifact in resting state fMRI. Neuroimage. 2014;84:320–341. doi: 10.1016/j.neuroimage.2013.08.048. [DOI] [PMC free article] [PubMed] [Google Scholar]
- Robertson IH, Manly T, Andrade J, Baddeley BT, Yiend J. “Oops!”: Performance correlates of everyday attentional failures in traumatic brain injured and normal subjects. Neuropsychologia. 1997;35:747–758. doi: 10.1016/S0028-3932(97)00015-8. [DOI] [PubMed] [Google Scholar]
- Rosenberg M, Noonan S, DeGutis J, Esterman M. Sustaining visual attention in the face of distraction: a novel gradual-onset continuous performance task. Atten Percept Psychophys. 2013;75:426–439. doi: 10.3758/s13414-012-0413-x. [DOI] [PubMed] [Google Scholar]
- Rosenberg MD, Finn ES, Constable RT, Chun MM. Predicting moment-to-moment attentional state. Neuroimage. 2015;114:249–256. doi: 10.1016/j.neuroimage.2015.03.032. [DOI] [PubMed] [Google Scholar]
- Rosenberg MD, Finn ES, Scheinost D, Papademetris X, Shen X, Constable RT, Chun MM. A neuromarker of sustained attention from whole-brain functional connectivity. Nat Neurosci. 2016;19:165–171. doi: 10.1038/nn.4179. [DOI] [PMC free article] [PubMed] [Google Scholar]
- Rubia K, Halari R, Cubillo A, Smith AB, Mohammad AM, Brammer M, Taylor E. Methylphenidate normalizes frontostriatal underactivation during interference inhibition in medication-naïve boys with attention-deficit hyperactivity disorder. Neuropsychopharmacology. 2011;36:1575–1586. doi: 10.1038/npp.2011.30. [DOI] [PMC free article] [PubMed] [Google Scholar]
- Schachter HM, Pham B, King J, Langford S, Moher D. How efficacious and safe is short-acting methylphenidate for the treatment of attention-deficit disorder in children and adolescents? A meta-analysis. CMAJ. 2001;165:1475–1488. [PMC free article] [PubMed] [Google Scholar]
- Shen X, Tokoglu F, Papademetris X, Constable RT. Groupwise whole-brain parcellation from resting-state fMRI data for network node identification. Neuroimage. 2013;82:403–415. doi: 10.1016/j.neuroimage.2013.05.081. [DOI] [PMC free article] [PubMed] [Google Scholar]
- Smith BH, Waschbusch DA, Willoughby MT, Evans S. The efficacy, safety, and practicality of treatments for adolescents with attention-deficit/hyperactivity disorder (ADHD) Clin Child Fam Psychol Rev. 2000;3:243–267. doi: 10.1023/a:1026477121224. [DOI] [PubMed] [Google Scholar]
- Smith SM, Vidaurre D, Beckmann CF, Glasser MF, Jenkinson M, Miller KL, Nichols TE, Robinson EC, Salimi-Khorshidi G, Woolrich MW, Barch DM, Uðurbil K, Van Essen DC. Functional connectomics from resting-state fMRI. Trends Cogn Sci. 2013;17:666–682. doi: 10.1016/j.tics.2013.09.016. [DOI] [PMC free article] [PubMed] [Google Scholar]
- Spencer RC, Devilbiss DM, Berridge CW. The cognition-enhancing effects of psychostimulants involve direct action in the prefrontal cortex. Biol Psychiatry. 2015;77:940–950. doi: 10.1016/j.biopsych.2014.09.013. [DOI] [PMC free article] [PubMed] [Google Scholar]
- Sripada CS, Kessler D, Welsh R, Angstadt M, Liberzon I, Phan KL, Scott C. Distributed effects of methylphenidate on the network structure of the resting brain: a connectomic pattern classification analysis. Neuroimage. 2013;81:213–221. doi: 10.1016/j.neuroimage.2013.05.016. [DOI] [PMC free article] [PubMed] [Google Scholar]
- Stoeckel LE, Garrison KA, Ghosh S, Wighton P, Hanlon CA, Gilman JM, Greer S, Turk-Browne NB, deBettencourt MT, Scheinost D, Craddock C, Thompson T, Calderon V, Bauer CC, George M, Breiter HC, Whitfield-Gabrieli S, Gabrieli JD, LaConte SM, Hirshberg L, et al. Optimizing real time fMRI neurofeedback for therapeutic discovery and development. Neuroimage Clin. 2014;5:245–255. doi: 10.1016/j.nicl.2014.07.002. [DOI] [PMC free article] [PubMed] [Google Scholar]
- Supekar K, Swigart AG, Tenison C, Jolles DD, Rosenberg-Lee M, Fuchs L, Menon V. Neural predictors of individual differences in response to math tutoring in primary-grade school children. Proc Natl Acad Sci U S A. 2013;110:8230–8235. doi: 10.1073/pnas.1222154110. [DOI] [PMC free article] [PubMed] [Google Scholar]
- Tomasi D, Volkow ND, Wang GJ, Wang R, Telang F, Caparelli EC, Wong C, Jayne M, Fowler JS. Methylphenidate enhances brain activation and deactivation responses to visual attention and working memory tasks in healthy controls. Neuroimage. 2011;54:3101–3110. doi: 10.1016/j.neuroimage.2010.10.060. [DOI] [PMC free article] [PubMed] [Google Scholar]
- Volkow ND, Wang G, Fowler JS, Logan J, Gerasimov M, Maynard L, Ding Y, Gatley SJ, Gifford A, Franceschi D. Therapeutic doses of oral methylphenidate significantly increase extracellular dopamine in the human brain. J Neurosci. 2001;21:RC121. doi: 10.1523/JNEUROSCI.21-02-j0001.2001. [DOI] [PMC free article] [PubMed] [Google Scholar]
- Waschbusch DA, Pelham WE, Jr, Waxmonsky J, Johnston C. Are there placebo effects in the medication treatment of children with attention-deficit hyperactivity disorder? J Dev Behav Pediatr. 2009;30:158–168. doi: 10.1097/DBP.0b013e31819f1c15. [DOI] [PubMed] [Google Scholar]
- Whelan R, Watts R, Orr CA, Althoff RR, Artiges E, Banaschewski T, Barker GJ, Bokde AL, Büchel C, Carvalho FM, Conrod PJ, Flor H, Fauth-Bühler M, Frouin V, Gallinat J, Gan G, Gowland P, Heinz A, Ittermann B, Lawrence C, et al. Neuropsychosocial profiles of current and future adolescent alcohol misusers. Nature. 2014;512:185–189. doi: 10.1038/nature13402. [DOI] [PMC free article] [PubMed] [Google Scholar]
- Wood S, Sage JR, Shuman T, Anagnostaras SG. Psychostimulants and cognition: a continuum of behavioral and cognitive activation. Pharmacol Rev. 2014;66:193–221. doi: 10.1124/pr.112.007054. [DOI] [PMC free article] [PubMed] [Google Scholar]
- Zalesky A, Fornito A, Bullmore ET. Network-based statistic: identifying differences in brain networks. Neuroimage. 2010;53:1197–1207. doi: 10.1016/j.neuroimage.2010.06.041. [DOI] [PubMed] [Google Scholar]