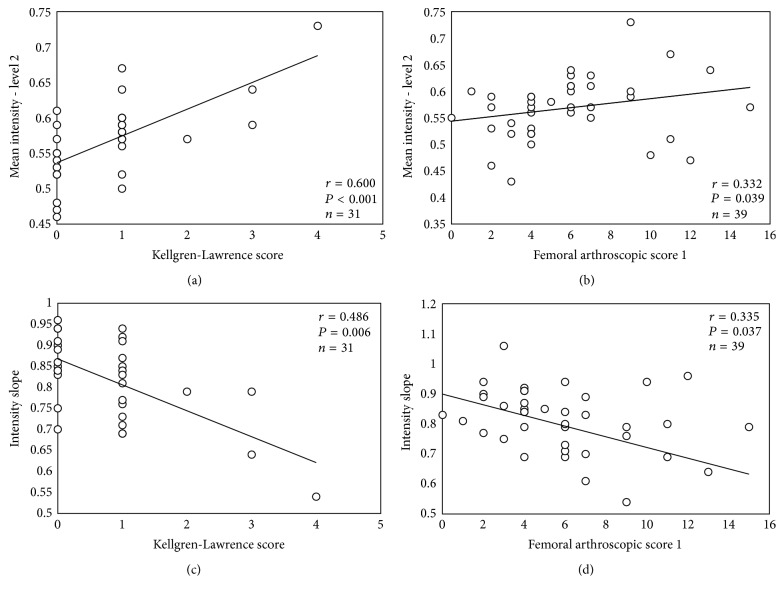
In the article titled “In vivo quantitative ultrasound image analysis of femoral subchondral bone in knee osteoarthritis” [1], there was an error in the data set (scatter plot) of provided Figure 2(d). The correlation, however, was correct and consequently it does not change our conclusions. Here we provide Figure 2(d) with the corrected data set. Additionally, in Figure 2(a) the mathematical expression of P value was corrected from “P = 0.000” to more appropriate “P < 0.001.”
Figure 2.
(a) Relationship between normalized mean intensity values of femoral bone level 2 and Kellgren-Lawrence (K-L) grading or femoral arthroscopic score 1 (FAS1) (b). Relationship between femoral subchondral bone intensity slope and K-L grading (c) or FAS1 (d). The slope was calculated from the first 2 levels. Please note that the trendline in each plot is only for illustration purposes.
References
- 1.Podlipská J., Koski J. M., Pulkkinen P., Saarakkala S. In vivo quantitative ultrasound image analysis of femoral subchondral bone in knee osteoarthritis. The Scientific World Journal. 2013;2013:8. doi: 10.1155/2013/182562.182562 [DOI] [PMC free article] [PubMed] [Google Scholar]


