

Abstract
Background
Birth weight, a marker of the intrauterine environment, has been extensively studied in epidemiological research in relation to subsequent health and disease. Although numerous meta-analyses have been published examining the association between birth weight and subsequent health-related outcomes, the epidemiological credibility of these associations has not been thoroughly assessed. The objective of this study is to map the diverse health outcomes associated with birth weight and evaluate the credibility and presence of biases in the reported associations.
Methods
An umbrella review was performed to identify systematic reviews and meta-analyses of observational studies investigating the association between birth weight and subsequent health outcomes and traits. For each association, we estimated the summary effect size by random-effects and fixed-effects models, the 95 % confidence interval, and the 95 % prediction interval. We also assessed the between-study heterogeneity, evidence for small-study effects and excess significance bias. We further applied standardized methodological criteria to evaluate the epidemiological credibility of the statistically significant associations.
Results
Thirty-nine articles including 78 associations between birth weight and diverse outcomes met the eligibility criteria. A wide range of health outcomes has been studied, ranging from anthropometry and metabolic diseases, cardiovascular diseases and cardiovascular risk factors, various cancers, respiratory diseases and allergies, musculoskeletal traits and perinatal outcomes. Forty-seven of 78 associations presented a nominally significant summary effect and 21 associations remained statistically significant at P < 1 × 10⁻⁶. Thirty associations presented large or very large between-study heterogeneity. Evidence for small-study effects and excess significance bias was present in 13 and 16 associations, respectively. One association with low birth weight (increased risk for all-cause mortality), two dose-response associations with birth weight (higher bone mineral concentration in hip and lower risk for mortality from cardiovascular diseases per 1 kg increase in birth weight) and one association with small-for-gestational age infants with normal birth weight (increased risk for childhood stunting) presented convincing evidence. Eleven additional associations had highly suggestive evidence.
Conclusions
The range of outcomes convincingly associated with birth weight might be narrower than originally described under the “fetal origin hypothesis” of disease. There is weak evidence that birth weight constitutes an effective public health intervention marker.
Electronic supplementary material
The online version of this article (doi:10.1186/s12916-016-0692-5) contains supplementary material, which is available to authorized users.
Keywords: Bias, Birth weight, Epidemiological credibility, Meta-analysis
Background
In early 1990’s, the “fetal origin hypothesis” of adult diseases was suggested to describe the observed associations between low birth weight (BW) and cardiovascular diseases in adult life [1–5]. Barker, who first observed these associations, hypothesized that fetal under-nutrition may lead to disproportionate fetal growth and program later coronary heart disease risk [6].
Since then, the importance of the early life and intrauterine environment in relation to later disease has been widely acknowledged and studied [1, 6–10]. BW is considered a marker of the intrauterine environment and has been extensively studied in epidemiological research, both in terms of its predictors but mainly in relation to subsequent disease. The examined phenotypes expanded beyond cardiovascular conditions into a wide range of outcomes and traits, including respiratory disease [8, 11], cancer [12, 13] and psychiatric outcomes [14]. At the same time, acknowledging its importance, WHO included low BW (<2500 g) as one of its 2025 targets, namely a 30 % reduction in the number of infants born with a BW below 2500 g by 2025 [15]. During the last two decades, interest in the potential health risks associated with high BW (>4000 g) has also emerged, and associations between high BW and the risk of adverse health outcomes have been studied in an increasing number of scientific papers.
Interpreting associations between BW and the occurrence of health problems later in life is, however, challenging and linked to a series of methodological limitations [16]. Despite the attention that BW has received in public health policy and epidemiological research, a comprehensive assessment of the proposed associations between BW and future disease is lacking. In the current study, we applied the methodology of umbrella reviews to map all the outcomes that have been associated with low and high BW and we applied a standardized approach to assess the credibility of the findings in order to identify which associations are supported by robust evidence.
Methods
Literature search and eligibility criteria
We performed an umbrella review, which is a comprehensive and systematic collection and evaluation of multiple systematic reviews and meta-analyses performed on a specific research topic [17]. We followed a standardized procedure that has already been applied in the appraisal of observational associations in other research fields [18–21]. We systematically searched PubMed from inception to December 24, 2015, to identify systematic reviews and meta-analyses of observational studies examining associations of BW with medical conditions, traits and biomarkers. We used the following search algorithm: (“birth weight” OR “birth size” OR “small for gestational age” OR “large for gestational age” OR “fetal growth restriction” OR “intra-uterine growth restriction”) AND (systematic review* OR systematic literature review* OR meta-analys*). We excluded meta-analyses examining genetic or environmental determinants of BW. We further excluded the meta-analyses of individual participant data that did not report the study-specific estimates and pooled analyses that only summarized evidence across a non-systematically selected number of cohort studies or that did not present the study-specific effect estimates of component studies [22–27]. We did not apply any limitation based on language of publication.
Data extraction
Two independent researchers extracted the data (LB, CK), and in the case of discrepancies, the final decision was that of a third researcher (IT). From each eligible article, we recorded the first author, journal, year of publication, examined outcomes and number of studies included. We also extracted the study-specific effect sizes (risk ratio, odds ratio, hazard ratio, mean difference and regression coefficient) along with the corresponding 95 % confidence intervals and the number of cases and controls in each study for each association. Whenever the sample sizes were not available through the meta-analysis, we retrieved the original reports to record them. Further, when multiple comparisons were available for a particular phenotype (e.g. < 2500 g vs. ≥ 2500 g and < 2500 g vs. 2500–4000 g) we always preferred to extract information on < 2500 g versus ≥ 2500 g and > 4000 g versus ≤ 4000 g in the case of low BW and high BW, respectively. However, when this comparison was not available, we extracted the comparison reported by the meta-analysis. For the excluded meta-analyses assessing an overlapping association, we recorded the level of comparison and the summary effect estimate along with the 95 % confidence interval. Additionally, we scrutinized the full-text of the eligible papers to examine whether their authors discussed the potential effect of gestational age in the association of BW with subsequent health outcomes.
Statistical analysis
For each meta-analysis, we estimated the summary effect size and its 95 % confidence interval with both fixed-effects and random-effects models [28, 29]. We also estimated the 95 % prediction interval, which further accounts for between-study heterogeneity and evaluates the uncertainty for the effect that would be expected in a new study addressing that same association [30, 31].
In the case of meta-analyses with continuous outcomes, the standardized mean difference was transformed to an odds ratio with an established formula [32]. Between-study heterogeneity was assessed by the I2 metric [33]. I2 ranges between 0 % and 100 % and is the ratio of between-study variance over the sum of the within-study and between-study variances [34]. Values exceeding 50 % or 75 % are usually judged to represent large or very large heterogeneity, respectively.
We assessed whether there was evidence for small-study effects (i.e. whether smaller studies tend to give substantially larger estimates of effect size compared with larger studies) with the regression asymmetry test proposed by Egger et al. [35, 36]. A P value less than 0.10 with a more conservative effect in the largest study than in random-effects meta-analysis was judged to be evidence for small-study effects.
We applied the excess statistical significance test, which assesses whether the observed number of studies with nominally significant results is larger than their expected number [37]. This test assesses whether the number of positive studies among those in a meta-analysis is too large based on the power that these studies have to detect plausible effects at an α of 0.05. The expected number of studies with significant results is calculated in each meta-analysis by the sum of the statistical power estimates for each component study. The power of each component study was estimated using the effect size of the largest study (smallest SE) in a meta-analysis and the power calculation was based on an algorithm using a non-central t distribution [38, 39]. Excess statistical significance for single meta-analyses was claimed at P < 0.10 [37]. For four associations, the power calculations and the excess statistical significance test were not performed, because the sample sizes of the component studies could not be retrieved neither from meta-analysis papers nor from the original reports.
Finally, we identified the associations that had the strongest validity and were not suggestive of bias. Specifically, we considered as convincing the associations that met the following criteria: significance under the random-effects model at P < 1 × 10⁻⁶, more than 1000 cases, not large between-study heterogeneity (I2 < 50 %), 95 % prediction interval excluding the null value, and no evidence of small-study effects and excess significance bias. Additionally, the associations with a statistically significant effect at P < 1 × 10⁻⁶, more than 1000 cases, and a statistically significant effect in the largest study were characterized as having highly suggestive evidence. We considered as suggestive the associations that have more than 1000 cases and a statistically significant effect under the random-effects model at P < 1 × 10⁻³. The rest of statistically significant associations at P < 0.05 under random-effects model were graded as weak associations.
The statistical analyses were performed with STATA version 12.0 and the power calculations were performed using STATA version 12.0 and G*Power version 3.1.
Results
Overall, the literature search identified 1520 articles, of which 39 articles, published between 2005 and 2015, were deemed eligible (Fig. 1). Sixty-three papers were screened by full-text. Of these, 10 examined the same or related phenotypes in the same population (defined as overlapping meta-analysis), six were individual participant data meta-analyses that did not report the study-specific effect estimates, and 12 were systematic reviews without a quantitative synthesis. The 39 eligible papers included 78 different meta-analyses (Table 1): 28 assessing low BW, four assessing small-for-gestational age infants, 18 assessing high BW, and 28 assessing a dose–response association between BW and subsequent health outcomes. A wide range of health outcomes has been studied ranging from anthropometry and metabolic disease, cardiovascular disease and cardiovascular risk factors, various cancers, respiratory diseases and allergies, musculoskeletal traits, and perinatal outcomes. Both neonatal and childhood conditions as well as adult diseases have been extensively examined (Table 1). Only two eligible papers had access to raw data of primary studies and performed an individual-level data meta-analysis [8, 40].
Fig. 1.
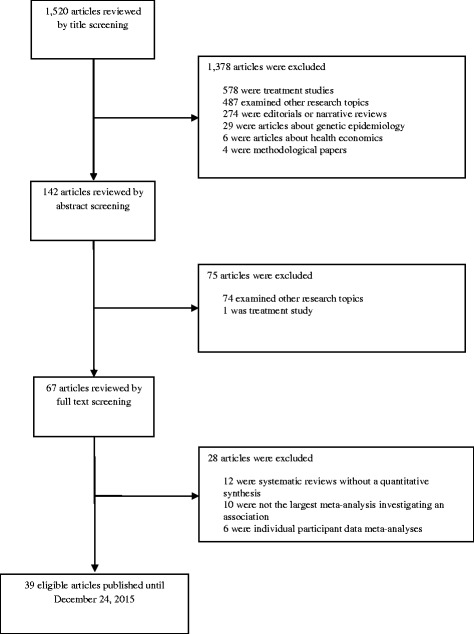
Flow chart of literature search
Table 1.
Quantitative synthesis, bias assessment and credibility assessment of 74 associations between different comparisons of birth weight and health outcomes or traits
| Reference | Outcome | Level of comparison | N cases/ N controls | N datasets | Effect size metric | Random-effects meta-analysis (95 % CI) | P value (random) | I2 | 95 % prediction intervals | P value for Egger test | P value for Excess significance test |
|---|---|---|---|---|---|---|---|---|---|---|---|
| Araujo de Franca, 2014 [59] | Waist circumference | Per 1 kg increase | 4898d | 6 | Regression coefficient | −0.10 (−0.73 to 0.53) | 0.760 | 73.2 | −2.04 to 1.84 | 0.725 | 0.943 |
| Araujo de Franca, 2014 [59] | Waist-to-hip ratio | Per 1 kg increase | 5008d | 10 | Regression coefficient | −0.59 (−0.84 to −0.34) | 4.0 × 10⁻⁶ | 0 | −0.89 to −0.30 | 0.545 | 0.052 |
| Baird, 2011 [48] | BMC in hip | Per 1 kg increase | 1795d | 6 | Regression coefficient | 1.42 (0.90 to 1.94) | 8.3 × 10⁻⁸ | 5.9 | 0.56 to 2.28 | 0.584 | 0.838 |
| Baird, 2011 [48] | BMC in lumbar spine | Per 1 kg increase | 3181d | 7 | Regression coefficient | 1.72 (0.76 to 2.67) | 4.2 × 10⁻⁴ | 33.5 | −0.53 to 3.97 | 0.069a | 1.6 × 10⁻⁴ |
| Baird, 2011 [48] | BMD in hip | Per 1 kg increase | 3188d | 7 | Regression coefficient | 0.01 (0.00 to 0.02) | 0.235 | 0 | −0.01 to 0.01 | 0.708 | 0.271 |
| Baird, 2011 [48] | BMD in lumbar spine | Per 1 kg increase | 3506d | 8 | Regression coefficient | 0.00 (−0.01 to 0.01) | 0.779 | 14.9 | −0.02 to 0.02 | 0.831 | 0.341 |
| Berhan, 2014 [46] | Perinatal mortality in developing countries | <2500 g vs. ≥ 2500 g | 21,184/285,970 | 14 | OR | 9.59 (6.11 to 15.04) | 7.5 × 10⁻²³ | 98.9 | 1.43 to 64.18 | 0.954 | 0.707 |
| Caughey, 2009 [13] | Acute lymphoblastic leukaemia | <2500 g vs. ≥ 2500 g | 4805/765,827 | 10 | RR | 0.97 (0.81 to 1.16) | 0.736 | 0 | 0.78 to 1.20 | 0.289 | NP |
| Caughey, 2009 [13] | Acute lymphoblastic leukaemia | >4000 g vs. ≤ 4000 g | 11,082/2,228,906 | 23 | RR | 1.29 (1.17 to 1.42) | 1.9 × 10⁻⁷ | 36.3 | 0.97 to 1.72 | 0.055a | 9.4 × 10⁻⁷ |
| Caughey, 2009 [13] | Acute lymphoblastic leukaemia | Per 1 kg increase | 7404/858,650 | 16 | RR | 1.19 (1.10 to 1.28) | 1.7 × 10⁻⁵ | 54.7 | 0.93 to 1.52 | 0.990 | 2.2 × 10⁻⁴ |
| Caughey, 2009 [13] | All types of leukaemia | <2500 g vs. ≥ 2500 g | 5766/766,202 | 11 | RR | 1.04 (0.86 to 1.26) | 0.683 | 10 | 0.76 to 1.43 | 0.357 | NP |
| Caughey, 2009 [13] | All types of leukaemia | >4000 g vs. ≤ 4000 g | NA/NA | 14 | RR | 1.42 (1.26 to 1.60) | 1.2 × 10⁻⁸ | 28.5 | 1.07 to 1.88 | 0.001a | NA |
| Caughey, 2009 [13] | All types of leukaemia | Per 1 kg increase | 11,313/861,710 | 21 | RR | 1.19 (1.12 to 1.27) | 5.1 × 10⁻⁸ | 45.3 | 0.97 to 1.45 | 0.590 | 0.001 |
| Caughey, 2009 [13] | Acute myeloid leukaemia | <2500 g vs. ≥ 2500 g | 756/851,204 | 9 | RR | 1.46 (0.87 to 2.43) | 0.151 | 43.7 | 0.39 to 5.43 | 0.606 | NP |
| Caughey, 2009 [13] | Acute myeloid leukaemia | >4000 g vs. ≤ 4000 g | 756/851,204 | 9 | RR | 1.25 (1.09 to 1.43) | 1.3 × 10⁻³ | 43.9 | 0.88 to 1.77 | 0.216 | 3.1 × 10⁻⁴ |
| Chen, 2012 [60] | Bone tumour | >4000 g vs. NBW | 4044/272,354 | 8 | OR | 1.21 (0.97 to 1.50) | 0.091 | 37.8 | 0.71 to 2.03 | 0.093a | 0.396 |
| Christian, 2013 [40] | Childhood stunting | SGA vs. AGA (BW ≥ 2500 g) | 5413/16,663 | 10 | OR | 1.92 (1.75 to 2.12) | 1.1 × 10−41 | 0 | 1.72 to 2.15 | 0.968 | NP |
| Christian, 2013 [40] | Childhood stunting | SGA vs. AGA (BW < 2500 g) | 843/1171 | 10 | OR | 3.00 (2.36 to 3.81) | 2.3 × 10⁻¹⁹ | 56.6 | 1.53 to 5.85 | 0.555 | NP |
| Cook, 2010 [58] | Testicular cancer | <2500 g vs. NBW | 6906/612,741 | 17 | OR | 1.34 (1.08 to 1.67) | 7.9 × 10⁻³ | 50.9 | 0.69 to 2.62 | 0.135 | 0.049 |
| Davey-Smith, 2007 [61] | Maternal cardiovascular mortality | Per 1 SD increase | 2976/974,667 | 6 | HR | 0.75 (0.67 to 0.84) | 3.1 × 10⁻⁷ | 79.8 | 0.53 to 1.06 | 0.657 | 0.119 |
| Davey-Smith, 2007 [61] | Paternal cardiovascular mortality | Per 1 SD increase | 9375/774,325 | 3 | HR | 0.93 (0.91 to 0.95) | 2.0 × 10⁻⁹ | 0 | 0.80 to 1.09 | 0.317 | 0.516 |
| der Voort, 2014 [8] | Pre-school wheezing | <2500 g vs. NBW | 40,603/103,271 | 26 | OR | 1.10 (1.00 to 1.21) | 0.051 | 16 | 0.89 to 1.36 | 0.829 | NP |
| der Voort, 2014 [8] | School-age asthma | <2500 g vs. NBW | 11,729/121,198 | 16 | OR | 1.13 (1.01 to 1.27) | 0.032 | 0 | 1.00 to 1.28 | 0.639 | NP |
| Dodds, 2012 [62] | Muscle strength | Per 1 kg increase | 20,461d | 14 | Regression coefficient | 0.86 (0.58 to 1.15) | 1.9 × 10⁻⁹ | 56.4 | −0.01 to 1.74 | 0.965 | NP |
| Harder, 2007 [7] | Type 2 diabetes mellitus | <2500 g vs. ≥ 2500 g | 5815/100,759 | 10 | OR | 1.32 (1.06 to 1.64) | 0.013 | 60.8 | 0.71 to 2.43 | 0.196 | NP |
| Harder, 2007 [7] | Type 2 diabetes mellitus | >4000 g vs. ≤ 4000 g | 6005/108,400 | 9 | OR | 1.27 (1.01 to 1.59) | 0.044 | 68.2 | 0.62 to 2.58 | 0.817 | NP |
| Harder, 2008 [63] | Astrocytoma | <2500 g vs. ≥ 2500 g | 1574/160,146 | 6 | OR | 0.85 (0.58 to 1.25) | 0.410 | 31.1 | 0.35 to 2.09 | 0.931 | NP |
| Harder, 2008 [63] | Astrocytoma | >4000 g vs. ≤ 4000 g | 1812/1,649,625 | 8 | OR | 1.38 (1.07 to 1.79) | 0.014 | 57.5 | 0.66 to 2.88 | 0.632 | 0.160 |
| Harder, 2008 [63] | Medulloblastoma | <2500 g vs. ≥ 2500 g | 747/158,163 | 5 | OR | 1.65 (0.42 to 6.50) | 0.475 | 88.2 | 0.01 to 223 | 0.828a | 0.503 |
| Harder, 2008 [63] | Medulloblastoma | >4000 g vs. ≤ 4000 g | 853/1,647,552 | 7 | OR | 1.28 (1.02 to 1.59) | 0.033 | 5.6 | 0.90 to 1.80 | 0.818 | NP |
| Harder, 2009 [64] | Type 1 diabetes mellitus | <2500 g vs. ≥ 2500 g | 5236/1,385,809 | 8 | OR | 0.82 (0.55 to 1.24) | 0.344 | 91.4 | 0.20 to 3.31 | 0.067 | NP |
| Harder, 2009 [64] | Type 1 diabetes mellitus | >4000 g vs. ≤ 4000 g | 6406/2,388,046 | 10 | OR | 1.17 (1.09 to 1.26) | 1.2 × 10⁻⁵ | 0 | 1.08 to 1.28 | 0.883 | NP |
| Harder, 2010 [65] | Neuroblastoma | <2500 g vs. ≥ 2500 g | 2907/2,156,535 | 10 | OR | 1.24 (0.99 to 1.55) | 0.058 | 30.2 | 0.74 to 2.07 | 0.731 | NP |
| Harder, 2010 [65] | Neuroblastoma | >4000 g vs. ≤ 4000 g | 2856/2,156,654 | 10 | OR | 1.19 (1.04 to 1.36) | 0.013 | 0 | 1.01 to 1.39 | 0.517 | NP |
| Jackson 2013 [66] | Pneumonia in childhood | <2500 g vs. ≥ 2500 g | 1281/1464 | 4 | OR | 3.18 (1.02 to 9.91) | 0.046 | 95.6 | 0.01 to 714 | 0.366 | NP |
| Kormos, 2013 [67] | Intelligence in adolescence | <2500 g vs. NBW | NA/NA | 15 | ORc | 0.35 (0.27 to 0.45) | 1.7 × 10⁻¹⁶ | 75.4 | 0.14 to 0.84 | 0.001a | 7.8 × 10⁻⁴ |
| Lawlor 2005 [68] | FEV1 | Per 1 kg increase | 5438d | 7 | Regression coefficient | 0.06 (0.03 to 0.08) | 1.4 × 10⁻⁵ | 36.5 | −0.01 to 0.12 | 0.242 | NP |
| Lawlor 2006 [69] | Total cholesterol in men | Per 1 kg increase | 33,650d | 34 | Regression coefficient | −0.04 (−0.07 to −0.01) | 0.018 | 49.8 | −0.15 to 0.07 | 0.377 | NP |
| Lawlor 2006 [69] | Total cholesterol in women | Per 1 kg increase | 23,129d | 34 | Regression coefficient | −0.01 (−0.04 to 0.02) | 0.510 | 27.7 | −0.09 to 0.07 | 0.686 | NP |
| Loret de Mola, 2014 [55] | Depression in adulthood | SGA vs. AGA | 397/2844 | 5 | OR | 1.14 (0.64 to 2.03) | 0.656 | 49.3 | 0.20 to 6.36 | 0.791 | NP |
| Mebrahtu, 2015 [11] | Wheezing disorders in childhood | <2500 g vs. ≥ 2500 g | 145,421/665,431 | 20 | OR | 1.61 (1.39 to 1.85) | 1.1 × 10⁻¹⁰ | 82.3 | 0.92 to 2.80 | 0.021a | NP |
| Mebrahtu, 2015 [11] | Wheezing disorders in childhood | >4000 g vs. NBW | 44,988/736,940 | 10 | OR | 1.02 (1.00 to 1.05) | 0.100 | 0 | 0.99 to 1.05 | 0.985 | NP |
| Michos, 2007 [70] | Testicular cancer | >4000 g vs. NBW | 5684/123,120 | 10 | OR | 1.14 (0.99 to 1.31) | 0.075 | 42.8 | 0.80 to 1.62 | 0.791 | 0.006 |
| Milne, 2013 [56] | Acute lymphoblastic leukaemia | SGA vs. AGA | 6835/11,689 | 12 | OR | 1.24 (1.13 to 1.36) | 4.9 × 10⁻⁶ | 0 | 1.12 to 1.37 | 0.101 | NP |
| Mu, 2012 [71] | Diastolic blood pressure | <2500 g vs. ≥ 2500 g | 29,192d | 15 | ORc | 4.45 (1.32 to 14.99) | 0.016 | 99.3 | 0.02 to 902 | 0.085a | 0.001 |
| Mu, 2012 [71] | Systolic blood pressure | <2500 g vs. ≥ 2500 g | 32,351d | 19 | ORc | 7.45 (2.19 to 25.33) | 1.3 × 10⁻³ | 99.4 | 0.02 to 2296 | 0.148 | 0.615 |
| Mu, 2014 [41]b | Asthma in adulthood | <2500 g vs. ≥ 2500 g | 2111/37,409 | 4 | OR | 1.25 (1.12 to 1.40) | 7.7 × 10⁻⁵ | 0 | 0.98 to 1.60 | 0.884 | NP |
| Øglund, 2015 [72] | Physical activity | Per 1 kg increase | 10,667d | 8 | Regression coefficient | −3.08 (−10.20 to 4.04) | 0.397 | 9 | −14.81 to 8.66 | 0.881 | NP |
| Papadopoulou, 2012 [73] | Hodgkin lymphoma in childhood | <2500 g vs. NBW | 669/64,058 | 3 | OR | 0.94 (0.54 to 1.65) | 0.829 | 0 | 0.03 to 35.25 | 0.344 | NP |
| Papadopoulou, 2012 [73] | Non-Hodgkin lymphoma in childhood | <2500 g vs. NBW | 1571/68,265 | 5 | OR | 1.07 (0.71 to 1.63) | 0.740 | 55.4 | 0.29 to 3.95 | 0.599 | NP |
| Papadopoulou, 2012 [73] | Non-Hodgkin lymphoma in childhood | >4000 g vs. NBW | 1615/297,469 | 6 | OR | 1.17 (0.76 to 1.81) | 0.473 | 66.7 | 0.32 to 4.28 | 0.085a | 0.207 |
| Panduru, 2013 [74] | Atopic dermatitis | <2500 g vs. NBW | 6315/100,663 | 10 | OR | 0.66 (0.48 to 0.90) | 9.1 × 10⁻³ | 85.6 | 0.23 to 1.87 | 0.558 | 0.412 |
| Panduru, 2013 [74] | Atopic dermatitis | >4000 g vs. NBW | 6224/62,672 | 6 | OR | 1.13 (0.97 to 1.31) | 0.108 | 62.9 | 0.74 to 1.73 | 0.426 | NP |
| Risnes, 2011 [42]b | All-cause mortality | <3000 g vs. NBW | 32,926/276,648 | 8 | HR | 1.12 (1.07 to 1.16) | 6.9 × 10⁻⁸ | 21.7 | 1.03 to 1.21 | 0.642 | NP |
| Risnes, 2011 [42]b | All-cause mortality | >4000 g vs. NBW | 32,926/276,648 | 8 | HR | 1.02 (0.98 to 1.05) | 0.302 | 0 | 0.98 to 1.06 | 0.317 | NP |
| Risnes, 2011 [42]b | All-cause mortality | Per 1 kg increase | 36,834/361,874 | 18 | HR | 0.94 (0.92 to 0.97) | 2.6 × 10⁻⁶ | 18.6 | 0.89 to 0.99 | 0.838 | 0.038 |
| Risnes, 2011 [42]b | Mortality from cardiovascular diseases | Per 1 kg increase | 11,366/314,715 | 16 | HR | 0.88 (0.85 to 0.91) | 1.6 × 10⁻¹³ | 0 | 0.84 to 0.91 | 0.717 | 0.177 |
| Risnes, 2011 [42]b | Mortality from cancer | Per 1 kg increase | 9233/269,944 | 10 | HR | 1.09 (1.04 to 1.14) | 3.4 × 10⁻⁴ | 20.8 | 0.99 to 1.19 | 0.276 | 0.037 |
| Schellong, 2012 [43]b | Overweight/obese in adulthood | <2500 g vs. ≥ 2500 g | 73,420/330,648 | 30 | OR | 0.67 (0.59 to 0.76) | 1.1 × 10⁻⁹ | 82 | 0.38 to 1.18 | 0.079a | NP |
| Schellong, 2012 [43]b | Overweight/obese in adulthood | >4000 g vs. ≤ 4000 g | 96,296/396,381 | 45 | OR | 1.68 (1.58 to 1.79) | 3.6 × 10−57 | 74.9 | 1.24 to 2.28 | 0.133 | NP |
| Silveira 2008 [75] | Metabolic syndrome | <2500 g vs. NBW | NA/NA | 11 | OR | 2.54 (1.57 to 4.09) | 1.4 × 10⁻⁴ | 39.2 | 0.75 to 8.60 | 0.204 | NA |
| Shi, 2015 [76] | RSV-related acute lower respiratory infection in childhood | <2500 g vs. NBW | 3383/155,872 | 5 | OR | 1.91 (1.45 to 2.53) | 5.9 × 10⁻⁶ | 59.1 | 0.81 to 4.54 | 0.881 | NP |
| van Montfoort, 2005 [77] | Cortisol levels | Per 1 kg increase | 2301d | 11 | Regression coefficient | −20.49 (−35.97 to −5.00) | 9.5 × 10⁻³ | 46.3 | −61.37 to 20.4 | 0.524 | NP |
| Wang, 2014 [9] | Coronary heart disease | <2500 g vs. ≥ 2500 g | 13,089/360,209 | 16 | OR | 1.22 (1.13 to 1.31) | 4.7 × 10⁻⁷ | 7 | 1.08 to 1.37 | 0.039a | 0.751 |
| Wang, 2014 [9] | Coronary heart disease | >4000 g vs. ≤ 4000 g | 18,243/313,235 | 14 | OR | 0.89 (0.81 to 0.98) | 0.019 | 47.4 | 0.68 to 1.16 | 0.226 | NP |
| Wang, 2014 [9] | Coronary heart disease | Per 1 kg increase | NA/NA | 23 | OR | 0.82 (0.78 to 0.86) | 2.4 × 10⁻¹⁵ | 41.1 | 0.70 to 0.96 | 0.014a | NA |
| Whincup, 2008 [78] | Type 2 diabetes mellitus | Per 1 kg increase | 6090/145,994 | 31 | OR | 0.80 (0.72 to 0.88) | 1.8 × 10⁻⁵ | 66.5 | 0.52 to 1.21 | 0.286 | 0.355 |
| White, 2009 [79] | Chronic kidney disease | <2500 g vs. NBW | NA/NA | 21 | OR | 1.73 (1.44 to 2.08) | 8.3 × 10⁻⁹ | 66.3 | 0.88 to 3.38 | 0.015a | NA |
| Wojcik, 2013 [14]b | Depression in adulthood | <2500 g vs. ≥ 2500 g | 9013/50,428 | 18 | OR | 1.15 (1.00 to 1.32) | 0.057 | 34.3 | 0.79 to 1.67 | 0.171 | NP |
| Xu, 2009 [80] | Breast cancer | Per 1 kg increase | 16,299/3,604,802 | 16 | OR | 1.08 (1.03 to 1.13) | 2.8 × 10⁻³ | 22.5 | 0.97 to 1.20 | 0.452 | 4.1 × 10⁻⁴ |
| Yang, 2014 [12] | Colorectal cancer | Per 1 kg increase | 5985/723,087 | 5 | RR | 1.05 (0.93 to 1.19) | 0.461 | 57.1 | 0.72 to 1.52 | 0.457 | 0.149 |
| Yang, 2014 [12] | Endometrial cancer | Per 1 kg increase | 3780/671,410 | 5 | RR | 0.91 (0.81 to 1.03) | 0.128 | 40.2 | 0.65 to 1.27 | 0.867 | 0.758 |
| Yang, 2014 [12] | Lung cancer | Per 1 kg increase | 5207/696,742 | 4 | RR | 1.09 (1.02 to 1.16) | 0.016 | 12.3 | 0.90 to 1.31 | 0.172 | 0.436 |
| Yang, 2014 [12] | Melanoma | Per 1 kg increase | 4000/3,821,122 | 6 | RR | 1.14 (1.05 to 1.24) | 1.9 × 10⁻³ | 0 | 1.01 to 1.29 | 0.912 | NP |
| Yang, 2014 [12] | Non-Hodgkin lymphoma | Per 1 kg increase | 2056/626,082 | 3 | RR | 1.12 (1.01 to 1.24) | 0.033 | 0 | 0.58 to 2.15 | 0.487 | NP |
| Yang, 2014 [12] | Ovarian cancer | Per 1 kg increase | 2880/805,887 | 5 | RR | 0.96 (0.88 to 1.04) | 0.295 | 0 | 0.83 to 1.10 | 0.609 | NP |
| Zhang, 2013 [81] | Diastolic blood pressure | >4000 g vs. NBW | 150,980d | 23 | MD | 0.19 (−0.23 to 0.62) | 0.367 | 72.5 | −1.39 to 1.79 | 0.792 | NP |
| Zhang, 2013 [81] | Systolic blood pressure | >4000 g vs. NBW | 151,935d | 24 | MD | −0.25 (−0.92 to 0.42) | 0.466 | 79.3 | −2.97 to 2.47 | 0.477 | NP |
aBoth criteria for presence of small-study effects fulfilled (P value for Egger’s test < 0.10 and largest study with a smaller [more conservative] effect size than random-effects summary effect size)
bThe highlighted papers performed a comparison between studies adjusting for and not adjusting for gestational age
cRandom-effects summary effect size estimated from standardized mean difference transformed to odds ratio
dIn meta-analyses with a continuous outcome, the total sample size is reported
AGA adequate-for-gestational age, BMC bone mineral concentration, BMD bone mineral density, CI confidence interval, FEV 1 forced expiratory volume in the first second, HR hazard ratio, OR odds ratio, RR risk ratio, MD mean difference, NA not available, NBW normal birth weight, NP not pertinent (because the number of expected significant studies was larger than the number of observed significant studies), RSV respiratory syncytial virus, SD standard error, SGA small-for-gestational age
Overall, we identified more than one published meta-analysis for 25 outcomes, i.e. meta-analysis examining the same exposure (birth weight) and the same outcome. Overlapping meta-analyses provided concordant results, with the exception of two pairs, which had a summary effect in opposite direction (diastolic blood pressure and overweight) compared to the meta-analysis included in our umbrella review (largest most recently published meta-analysis). Six other meta-analyses differed in the summary effect significance compared to the most recent one (Additional file 1: Table S1).
Associations with low BW
Across 28 meta-analyses examining low BW as a dichotomous trait, the median number of cases was 5766 (interquartile range (IQR), 1574–11,729), while the median number of datasets was 11 (IQR, 8–16). Overall, 21 out of 28 associations had more than 1000 cases, 17 of 28 meta-analyses presented a nominally significant effect (P < 0.05) and 10 of them had a significant effect at P < 0.001. Only seven meta-analyses, examining the association of low BW with perinatal mortality in developing countries, wheezing disorders in childhood, being overweight or obese in adulthood, coronary heart disease, intelligence in adolescence, all-cause mortality, and chronic kidney disease, were statistically significant at P < 1 × 10⁻⁶ under the random-effects model (Table 1). The largest study had a standard error of less than 0.10 in 17 meta-analyses and a more conservative effect compared to random-effects model in 15 meta-analyses. Four meta-analyses (perinatal mortality in developing countries, coronary heart disease, school-age asthma, all-cause mortality) had a 95 % prediction interval excluding the null value. Five associations had large heterogeneity estimates (I2 ≥ 50 % and I2 ≤ 75 %), and 10 associations had very large heterogeneity estimates (I2 > 75 %). On bias assessment, seven associations had evidence for small-study effects (chronic kidney disease, coronary heart disease, diastolic blood pressure, intelligence in adolescence, medulloblastoma, wheezing disorders in childhood, and being overweight or obese in adulthood), and four associations (chronic kidney disease, diastolic blood pressure, intelligence in adolescence, and testicular cancer) had hints for excess significance bias (Table 1, Additional file 2: Table S2).
Associations with high BW
Across 18 meta-analyses examining high BW as a dichotomous trait, the median number of cases was 6115 (IQR, 3153–10,642), 16 meta-analyses were supported by more than 1000 cases, and the median number of datasets was 10 (IQR, 8–14). Ten associations presented a significant effect at P < 0.05, but only three associations (acute lymphoblastic leukaemia, all types of leukaemia, and being overweight or obese in adulthood) remained statistically significant after the application of a more conservative significance threshold (P < 1 × 10⁻⁶). The largest study had a standard error of less than 0.10 in four meta-analyses and a more conservative effect compared to random-effects model in 12 meta-analyses. Only four meta-analyses (all types of leukaemia, neuroblastoma, type 1 diabetes mellitus, and being overweight or obese in adulthood) had a 95 % prediction interval excluding the null value (Table 1). The heterogeneity estimate was large (I2 ≥ 50 % and I2 ≤ 75 %) in seven meta-analyses and only one meta-analysis presented very large heterogeneity (I2 > 75 %). Two associations presented hints for both small-study effects and excess significance bias (acute lymphoblastic leukaemia and all types of leukaemia), another two associations had only small-study effects (bone tumour and non-Hodgkin lymphoma in childhood), and two additional associations had hints for excess significance bias (acute myeloid leukaemia and testicular cancer).
Dose–response associations with BW
Across 28 meta-analyses, the median number of cases was 6747 (IQR, 3945–11,326) and the median number of datasets was 8 (IQR, 6–16). Overall, 17 associations were significant at P < 0.05, but only six associations survived in the application of a more stringent P value (P < 1 × 10⁻⁶). The largest study had a standard error of less than 0.10 in 21 meta-analyses and a more conservative effect compared to the random-effects model in 20 meta-analyses. Only six associations (all-cause mortality, bone mineral concentration in hip, coronary heart disease, melanoma, mortality from cardiovascular diseases, and waist-to-hip ratio) presented 95 % prediction interval excluding the null value (Table 1). Five associations presented large heterogeneity, and one association had very large heterogeneity. Hints for small-study effects and excess statistical significance were present in two (bone mineral concentration in lumbar spine, coronary heart disease) and eight meta-analyses (all-cause mortality, acute lymphoblastic leukaemia, all types of leukaemia, bone mineral concentration in lumbar spine, breast cancer, coronary heart disease, mortality from cancer, and waist-to-hip ratio), respectively (Table 1, Additional file 2: Table S2).
BW relative to gestational age
Three papers performed four meta-analyses examining associations between small-for-gestational-age infants (defined as BW below the 10th percentile for the gestational age) and the risk for acute lymphoblastic leukaemia, childhood stunting and depression. No meta-analyses on large-for-gestational age infants were identified. Under the random-effects model, three associations had a statistically significant effect at P < 1 × 10⁻⁶ and 95 % prediction interval excluding the null value (acute lymphoblastic leukaemia and childhood stunting in infants with low and normal BW; Table 1). Only one association had large between-study heterogeneity, whereas none of the examined associations presented evidence for small-study effects or excess significance bias.
Despite the importance of gestational age on BW, only four out of the 36 papers (pertained to seven meta-analyses) examining low BW, high BW or dose–response relationships with BW, presented subgroup analyses, including only studies that provided gestational age-adjusted estimates (Table 1) [14, 41–43]. None of these analyses observed a statistically significant difference in the summary effect between the studies adjusting for gestational age and the unadjusted studies. Additionally, 18 (46 %) papers mentioned that the observed effect might differ from the true effect because gestational age was not considered as an adjustment variable in several observational studies. Twenty papers (51 %) reported the observational studies that adjusted for gestational age in the statistical models.
Assessment of epidemiological credibility
Twenty-eight of 78 associations (36 %) did not present a significant summary effect at P < 0.05. Of the remaining 50 associations, only four presented convincing evidence by having more than 1000 cases, not large heterogeneity, 95 % prediction interval excluding the null value, a significant summary effect at P < 1 × 10⁻⁶, and absence of small-study effects and excess significance bias (Table 2). These associations pertained to all-cause mortality for low versus normal BW, bone mineral concentration in hip and mortality from cardiovascular diseases per 1 kg increase in BW, and childhood stunting for small- versus adequate-for-gestational-age infants with BW ≥ 2500 g. Notably, apart from the meta-analyses on stunting, which included gestational age in the definition of the examined phenotype (small-for-gestational-age), none of the other three meta-analyses with convincing evidence restricted their analyses to studies with adjustment for gestational age. Eleven additional associations had highly suggestive evidence (more than 1000 cases, a significant summary effect at P < 1 × 10⁻⁶ and largest study with a significant effect). These associations examined perinatal mortality in developing countries, wheezing disorders, being overweight or obese in adulthood, coronary heart disease for the comparison of < 2500 g versus ≥2500 g, intelligence in adolescence for the comparison of low BW versus normal BW, all types of leukaemia, being overweight or obese in adulthood for the comparison of > 4000 g versus ≤ 4000 g, muscle strength and coronary heart disease for the comparison of increase per 1 kg in BW, and maternal cardiovascular mortality and paternal cardiovascular mortality for the comparison of increase per 1 SD in BW. Fourteen associations presented suggestive evidence and 13 associations had weak evidence (Table 2).
Table 2.
Summary of evidence grading for meta-analyses associating different contrasts of birth weight and risk of future disease
| Level of evidence | Criteria | Low birth weight vs. normal birth weight | High birth weight vs. normal birth weight | Per unit/SD increase | SGA vs. AGA | |||
|---|---|---|---|---|---|---|---|---|
| Increased risk in LBW group | Decreased risk in LBW group | Increased risk in HBW group | Decreased risk in HBW group | Increased risk per unit/SD increase | Decreased risk per unit/SD increase | Increased risk in SGA group | ||
| Convincing | >1000 cases, P < 1 × 10⁻⁶, I2 < 50 %, 95 % PI excluding the null value, no small-study effects and excess significance bias | All-cause mortality | None | None | None | BMC in hip | Mortality from cardiovascular diseases | Childhood stunting (in BW ≥ 2500 g group) |
| Highly suggestive | >1000 cases, P < 1 × 10⁻⁶, largest study with a statistically significant effect | Perinatal mortality in developing countries, wheezing disorders in childhood, coronary heart disease | Overweight or obese in adulthood, intelligence in adolescence | All types of leukaemia, overweight or obese in adulthood | None | None | Muscle strength, coronary heart disease, maternal cardiovascular mortality, paternal cardiovascular mortality | None |
| Suggestive | >1000 cases, P < 1 × 10⁻³ | Asthma in adulthood, RSV-related acute lower respiratory infections in childhood, chronic kidney disease | None | Acute lymphoblastic leukaemia, type 1 diabetes mellitus | None | BMC in lumbar spine, acute lymphoblastic leukaemia, all types of leukaemia, FEV1, mortality from cancer | Waist-to-hip ratio, all-cause mortality, type 2 diabetes mellitus | Acute lymphoblastic leukaemia |
| Weak | The remaining associations with P < 0.05 | Diastolic blood pressure, testicular cancer, type 2 diabetes mellitus, metabolic syndrome, pneumonia in childhood, school-age asthma, systolic blood pressure | Atopic dermatitis | Acute myeloid leukaemia, astrocytoma, medulloblastoma, neuroblastoma, type 2 diabetes mellitus | Coronary heart disease | Breast cancer at any age, lung cancer, melanoma, non-Hodgkin lymphoma | Cortisol levels, total cholesterol in men | Childhood stunting (in BW < 2500 g group) |
AGA adequate-for-gestational age, BMC bone mineral concentration, BW birth weight, FEV 1 forced expiratory volume in the first second, HBW high birth weight, LBW low birth weight, SD standard deviation, SGA small-for-gestational age, RSV respiratory syncytial virus
Discussion
Our work constitutes the first comprehensive mapping and appraisal of the association between BW and the risk of subsequent health outcomes, as provided by published systematic reviews and meta-analyses of observational studies. Overall, 78 associations have been examined, including a diverse range of outcomes: cardiovascular, cancer, metabolic, respiratory and mortality outcomes, and disease traits and biomarkers. Despite common belief that the intrauterine environment as assessed by BW is associated with many diseases and disease traits in adult life [1, 6–10], our comprehensive assessment shows that convincing evidence only exists between the associations of low BW and increased risk for all-cause mortality, per 1 kg increase in BW and higher bone mineral concentration in hip and lower risk for mortality from cardiovascular diseases. Furthermore, the association between small-for-gestational-age and childhood stunting in low- and middle-income countries was supported by convincing evidence. There was no convincing evidence supporting associations between high BW and later outcomes; however, the associations with overweight or obesity in later life and all types of leukaemia were highly suggestive.
The associations between BW and cardiovascular disease were amongst the first to be observed in the medical literature [1–5] and our data suggests that the current evidence is highly suggestive. Both meta-analyses looking at low (<2500 g) versus high (≥4000 g) BW and those examining per 1 SD increase in BW showed highly significant summary effects and small between-study heterogeneity. However, both associations presented evidence for small-study effects and the dose–response association additionally had hints for excess significance bias. The latter may have resulted in inflated effect estimates for an association with cardiovascular disease that needs cautious interpretation [35, 44]. Despite the fact that studies have adjusted for a range of confounders, including socioeconomic status, not all studies were adjusted for gestational age, which is an important confounder and this, as well as other unrecognized confounders, could explain the observed association. In addition, the mechanisms underlying this association remain unclear despite many hypotheses having been suggested, including the one supporting that intrauterine under-nutrition leads to fetal adaptation, which is subsequently related to adverse cardiovascular risk in later life [10]. However, others have provided evidence that at least some of the association between the BW of individuals and their later risk of cardiovascular disease may be genetic and therefore not modifiable via interventions that target the intrauterine environment [45]. The causal pathway linking BW to cardiovascular risk needs further elucidation to allow evidence-based public health interventions.
The observed increased risk of cardiovascular disease associated with lower BW is likely to be a main contributor to the inverse association of BW with all-cause mortality; an association supported by convincing evidence in our assessment [42]. The higher incidence of perinatal mortality in the low BW group is also likely contributing to the all-cause mortality association with low BW, but only to a small extent. Babies born with a BW below 2500 g had increased perinatal mortality, an association supported by a very large summary effect estimate and a very small P value [46]. However, the meta-analysis on perinatal mortality was focused exclusively on developing countries. Therefore, the effect estimate might be exaggerated due to lack of neonatal intensive care units or difficult access to specialized healthcare facilities in these countries [47]. These data could not be generalised to other settings where high-quality healthcare is available.
The association between low BW and low bone mineral concentration in later life is less well studied compared to other outcomes and current data stem from six studies contributing to the meta-analysis [48]. Despite the fact that the association with bone mineral concentration in hip showed convincing evidence, cautious interpretation is required as data on osteoporotic fractures has not been reviewed and meta-analyses on other anatomical sites (e.g. lumbar spine) showed evidence for excess significance bias and no convincing associations.
Comparisons between BW and later overweight and obesity do not support a detrimental health effect of low BW. BW less than 2500 g was found to be protective for being overweight or obese, whereas BW greater than 4000 g was linked with an increased risk for being overweight or obese in adult life [43]. These associations were supported by highly suggestive evidence, but they also displayed very large between-study heterogeneity. Heterogeneity could be due to biased results in some of the included studies, but it could also reflect genuine differences across studies [35]. BW distributions are remarkably different across developed and developing countries [49], and the associations between BW and later adiposity may differ in these populations, contributing to the heterogeneity of the observed results. High BW is potentially causally associated with maternal BMI and glucose levels [50, 51]; however, the extent to which it could be modified through lifestyle or pharmacological interventions merits further investigation, particularly through long-term follow-up of interventions during pregnancy, which will strengthen and enhance the available evidence, particularly between high BW and subsequent risk of childhood and adulthood obesity [52–54].
Although 29 associations focused on outcomes related to different types of cancer, high BW was found to be a risk factor only for developing leukaemia [13]. The associated summary effect estimate might be inflated by the presence of small-study effects and excess significance bias. However, the statistical heterogeneity was not large, the 95 % prediction interval excluded the null value and the association was highly significant. Similarly, despite diabetes being central in the “fetal origin hypothesis” [7], its association with high and low BW has weak evidence in the literature and is only suggestive of a direct association with high BW in line with the obesity-associated evidence.
Despite intensive research on BW reflected by the large number of meta-analyses identified, there were only three papers that performed meta-analyses of studies assessing low BW in relation to gestational age [40, 55, 56], whereas no single meta-analysis on large-for-gestational-age neonates was identified. As BW and gestational age are highly correlated, analyses which consider size-for-gestational-age rather than BW adjusted for gestational age have been proposed as a more appropriate alternative [57, 58]. Among the examined phenotypes in relation to small-for-gestational-age, the association between small-for-gestational-age without low BW and childhood stunting in low- and middle-income countries showed convincing evidence. However, those results require cautious interpretation as the analyses were stratified by BW and the association between small-for-gestational age with low BW and childhood stunting showed a much weaker effect estimate and was only supported by weak evidence. Additionally, those analyses focused on low- and middle-income countries, limiting the generalisability of those results but at the same time also highlighting the need for interventions during the pregnancy period in these populations [40]. The remaining meta-analyses included a mixture of studies that adjusted or not their analyses for gestational age and, hence, the current literature is inconclusive on the effects of BW relative to gestational age.
In the present study, we applied the umbrella review approach summarising data from already published systematic reviews and meta-analyses. This approach takes full advantage of the existing meta-analyses to perform a standardised methodological process for the assessment of the epidemiological credibility of the findings. However, our study has some caveats. First, the Egger test and excess statistical significance test offer hints of bias, and not proof thereof, while the Egger test is difficult to interpret when the between-study heterogeneity is large. Further, our excess significance estimates were based on the largest study of each meta-analysis and they might be conservative, because often these studies were not necessarily very large or might have had inherent biases themselves. Furthermore, we did not appraise the quality of the primary studies, because this was beyond the scope of this umbrella review. This should be the aim of the original systematic reviews and meta-analyses, which should examine the methodological characteristics of the component studies.
Conclusions
Our study maps the current status of evidence on 78 associations of BW with various health outcomes, traits and biomarkers. Of them, only three examined the effects of BW in relation to gestational age through size-at-birth defined phenotypes. Our results show that the range of outcomes associated with BW is narrow and smaller than described under the fetal origin of disease hypothesis. Currently, there is weak evidence that BW constitutes an effective public policy intervention for long-term health and disease.
Acknowledgements
Not applicable.
Funding
The authors declare that they did not receive any financial support for the present study.
Availability of data and materials
The datasets analysed and generated during the current study are available from the corresponding author on reasonable request.
Authors’ contributions
IT and EE designed the study. LB and CK performed the literature search, the selection of eligible articles and the data extraction. LB analyzed the data. LB, MDS, EE and IT were involved in data interpretation. LB and IT wrote the first draft of the manuscript and LB, MDS, EE and IT were involved in the revision of the manuscript. All authors approved the final version of the submitted manuscript.
Competing interests
The authors declare that they have no competing interests.
Consent for publication
Not applicable.
Ethics approval and consent to participate
Not applicable.
Abbreviations
- BW
Birth weight
- IQR
Inter-quartile range
Additional files
Overlapping associations examined in older papers and/or under different levels of comparison. BMC: bone mineral concentration, BMD: bone mineral density, BMI: body mass index, MD: mean difference, NBW: normal birth weight, OR: odds ratio, RR: risk ratio [82–90]. (DOC 229 kb)
Comparison of random-effects summary effect size and largest study effect size, expected and observed number of significant associations and excess significance test in each meta-analysis. †Random-effects summary effect size estimated from standardized mean difference transformed to odds ratio. AGA: adequate-for-gestational age, BMC: bone mineral concentration, BMD: bone mineral density, CI: confidence interval, FEV: forced expiratory volume in the first second, HR: hazard ratio, OR: odds ratio, RR: risk ratio, MD: mean difference, RSV: respiratory syncytial virus, SD: standard error, SE: standard error, SGA: small-for-gestational age. (DOC 447 kb)
References
- 1.Hales C, Barker D. The thrifty phenotype hypothesis. Br Med Bull. 2001;60:5–20. doi: 10.1093/bmb/60.1.5. [DOI] [PubMed] [Google Scholar]
- 2.Barker D, Osmond C, Golding J, Kuh D, Wadsworth M. Growth in utero, blood pressure in childhood and adult life, and mortality from cardiovascular disease. BMJ. 1989;298:564–567. doi: 10.1136/bmj.298.6673.564. [DOI] [PMC free article] [PubMed] [Google Scholar]
- 3.Barker DJ, Winter PD, Osmond C, Margetts B, Simmonds SJ. Weight in infancy and death from ischaemic heart disease. Lancet. 1989;2:577–580. doi: 10.1016/S0140-6736(89)90710-1. [DOI] [PubMed] [Google Scholar]
- 4.Stein CE, Fall CH, Kumaran K, Osmond C, Cox V, Barker DJ. Fetal growth and coronary heart disease in south India. Lancet. 1996;348:1269–1273. doi: 10.1016/S0140-6736(96)04547-3. [DOI] [PubMed] [Google Scholar]
- 5.Barker DJ, Osmond C. Infant mortality, childhood nutrition, and ischaemic heart disease in England and Wales. Lancet. 1986;1(8489):1077–1081. doi: 10.1016/S0140-6736(86)91340-1. [DOI] [PubMed] [Google Scholar]
- 6.Barker DJ. Fetal origins of coronary heart disease. BMJ. 1995;311:171–174. doi: 10.1136/bmj.311.6998.171. [DOI] [PMC free article] [PubMed] [Google Scholar]
- 7.Harder T, Rodekamp E, Schellong K, Dudenhausen JW, Plagemann A. Birth weight and subsequent risk of type 2 diabetes: a meta-analysis. Am J Epidemiol. 2007;165:849–857. doi: 10.1093/aje/kwk071. [DOI] [PubMed] [Google Scholar]
- 8.Der Voort AMM S-v, Arends LR, De Jongste JC, Annesi-Maesano I, Arshad SH, Barros H, et al. Preterm birth, infant weight gain, and childhood asthma risk: a meta-analysis of 147,000 European children. J Allergy Clin Immunol. 2014;133:1317–1329. doi: 10.1016/j.jaci.2013.12.1082. [DOI] [PMC free article] [PubMed] [Google Scholar]
- 9.Wang S-F, Shu L, Sheng J, Mu M, Wang S, Tao X-Y, et al. Birth weight and risk of coronary heart disease in adults: a meta-analysis of prospective cohort studies. J Dev Orig Health Dis. 2014;5:408–419. doi: 10.1017/S2040174414000440. [DOI] [PubMed] [Google Scholar]
- 10.Godfrey KM, Barker DJ. Fetal programming and adult health. Public Health Nutr. 2001;4:611–624. doi: 10.1079/PHN2001145. [DOI] [PubMed] [Google Scholar]
- 11.Mebrahtu TF, Feltbower RG, Greenwood DC, Parslow RC. Birth weight and childhood wheezing disorders: a systematic review and meta-analysis. J Epidemiol Community Heal. 2015;69:500–508. doi: 10.1136/jech-2014-204783. [DOI] [PubMed] [Google Scholar]
- 12.Yang TO, Reeves GGK, Green J, Beral V, Cairns BBJ, Abbiss H, et al. Birth weight and adult cancer incidence: large prospective study and meta-analysis. Ann Oncol. 2014;25:1836–1843. doi: 10.1093/annonc/mdu214. [DOI] [PMC free article] [PubMed] [Google Scholar]
- 13.Caughey RW, Michels KB. Birth weight and childhood leukemia: a meta-analysis and review of the current evidence. Int J Cancer. 2009;124:2658–2670. doi: 10.1002/ijc.24225. [DOI] [PubMed] [Google Scholar]
- 14.Wojcik W, Lee W, Colman I, Hardy R, Hotopf M. Foetal origins of depression? A systematic review and meta-analysis of low birth weight and later depression. Psychol Med. 2013;43:1–12. doi: 10.1017/S0033291712000682. [DOI] [PMC free article] [PubMed] [Google Scholar]
- 15.World Health Organization . Global Nutrition Targets 2025: Low birth weight policy brief. Geneva: WHO; 2014. [Google Scholar]
- 16.Wilcox A. On the importance--and the unimportance--of birthweight. Int J Epidemiol. 2001;30:1233–1241. doi: 10.1093/ije/30.6.1233. [DOI] [PubMed] [Google Scholar]
- 17.Ioannidis JPA. Integration of evidence from multiple meta-analyses: a primer on umbrella reviews, treatment networks and multiple treatments meta-analyses. CMAJ. 2009;181:488–493. doi: 10.1503/cmaj.081086. [DOI] [PMC free article] [PubMed] [Google Scholar]
- 18.Theodoratou E, Tzoulaki I, Zgaga L, Ioannidis JPA. Vitamin D and multiple health outcomes: umbrella review of systematic reviews and meta-analyses of observational studies and randomised trials. BMJ. 2014;348:g2035. doi: 10.1136/bmj.g2035. [DOI] [PMC free article] [PubMed] [Google Scholar]
- 19.Belbasis L, Bellou V, Evangelou E, Ioannidis JPA, Tzoulaki I. Environmental risk factors and multiple sclerosis: an umbrella review of systematic reviews and meta-analyses. Lancet Neurol. 2015;14:263–273. doi: 10.1016/S1474-4422(14)70267-4. [DOI] [PubMed] [Google Scholar]
- 20.Bellou V, Belbasis L, Tzoulaki I, Evangelou E, Ioannidis JPA. Environmental risk factors and Parkinson’s disease: An umbrella review of meta-analyses. Parkinsonism Relat Disord. 2016;23:1–9. doi: 10.1016/j.parkreldis.2015.12.008. [DOI] [PubMed] [Google Scholar]
- 21.Belbasis L, Bellou V, Evangelou E. Environmental risk factors and amyotrophic lateral sclerosis: an umbrella review and critical assessment of current evidence from systematic reviews and meta-analyses of observational studies. Neuroepidemiology. 2016;46:96–105. doi: 10.1159/000443146. [DOI] [PubMed] [Google Scholar]
- 22.Gale CR, Sayer AA, Cooper C, Dennison EM, Starr JM, Whalley LJ, et al. Factors associated with symptoms of anxiety and depression in five cohorts of community-based older people: the HALCyon (Healthy Ageing across the Life Course) Programme. Psychol Med. 2011;41:2057–2073. doi: 10.1017/S0033291711000195. [DOI] [PMC free article] [PubMed] [Google Scholar]
- 23.Cardwell CR, Stene LC, Joner G, Davis EA, Cinek O, Rosenbauer J, et al. Birthweight and the risk of childhood-onset type 1 diabetes: a meta-analysis of observational studies using individual patient data. Diabetologia. 2010;53:641–651. doi: 10.1007/s00125-009-1648-5. [DOI] [PubMed] [Google Scholar]
- 24.Andersen LG, Angquist L, Gamborg M, Byberg L, Bengtsson C, Canoy D, et al. Birth weight in relation to leisure time physical activity in adolescence and adulthood: meta-analysis of results from 13 Nordic cohorts. PLoS One. 2009;4:e8192. doi: 10.1371/journal.pone.0008192. [DOI] [PMC free article] [PubMed] [Google Scholar]
- 25.Gamborg M, Byberg L, Rasmussen F, Andersen PK, Baker JL, Bengtsson C, et al. Birth weight and systolic blood pressure in adolescence and adulthood: meta-regression analysis of sex- and age-specific results from 20 Nordic studies. Am J Epidemiol. 2007;166:634–645. doi: 10.1093/aje/kwm042. [DOI] [PubMed] [Google Scholar]
- 26.Mirabello L, Pfeiffer R, Murphy G, Daw NC, Patiño-Garcia A, Troisi RJ, et al. Height at diagnosis and birth-weight as risk factors for osteosarcoma. Cancer Causes Control. 2011;22:899–908. doi: 10.1007/s10552-011-9763-2. [DOI] [PMC free article] [PubMed] [Google Scholar]
- 27.Katz J, Lee ACC, Kozuki N, Lawn JE, Cousens S, Blencowe H, et al. Mortality risk in preterm and small-for-gestational-age infants in low-income and middle-income countries: a pooled country analysis. Lancet. 2013;382:417–425. doi: 10.1016/S0140-6736(13)60993-9. [DOI] [PMC free article] [PubMed] [Google Scholar]
- 28.Lau J, Ioannidis JP, Schmid CH. Quantitative synthesis in systematic reviews. Ann Intern Med. 1997;127:820–826. doi: 10.7326/0003-4819-127-9-199711010-00008. [DOI] [PubMed] [Google Scholar]
- 29.DerSimonian R, Laird N. Meta-analysis in clinical trials. Control Clin Trials. 1986;7:177–188. doi: 10.1016/0197-2456(86)90046-2. [DOI] [PubMed] [Google Scholar]
- 30.Higgins JPT, Thompson SG, Spiegelhalter DJ. A re-evaluation of random-effects meta-analysis. J R Stat Soc Ser A Stat Soc. 2009;172:137–159. doi: 10.1111/j.1467-985X.2008.00552.x. [DOI] [PMC free article] [PubMed] [Google Scholar]
- 31.Higgins JPT. Heterogeneity in meta-analysis should be expected and appropriately quantified. Int J Epidemiol. 2008;37:1158–1160. doi: 10.1093/ije/dyn204. [DOI] [PubMed] [Google Scholar]
- 32.Chinn S. A simple method for converting an odds ratio to effect size for use in meta-analysis. Stat Med. 2000;19:3127–3131. doi: 10.1002/1097-0258(20001130)19:22<3127::AID-SIM784>3.0.CO;2-M. [DOI] [PubMed] [Google Scholar]
- 33.Cochran WG. The combination of estimates from different experiments. Biometrics. 1954;10:101. doi: 10.2307/3001666. [DOI] [Google Scholar]
- 34.Higgins JPT, Thompson SG. Quantifying heterogeneity in a meta-analysis. Stat Med. 2002;21:1539–1558. doi: 10.1002/sim.1186. [DOI] [PubMed] [Google Scholar]
- 35.Sterne JAC, Sutton AJ, Ioannidis JPA, Terrin N, Jones DR, Lau J, et al. Recommendations for examining and interpreting funnel plot asymmetry in meta-analyses of randomised controlled trials. BMJ. 2011;343:d4002. doi: 10.1136/bmj.d4002. [DOI] [PubMed] [Google Scholar]
- 36.Egger M, Davey Smith G, Schneider M, Minder C. Bias in meta-analysis detected by a simple, graphical test. BMJ. 1997;315:629–634. doi: 10.1136/bmj.315.7109.629. [DOI] [PMC free article] [PubMed] [Google Scholar]
- 37.Ioannidis JPA, Trikalinos TA. An exploratory test for an excess of significant findings. Clin Trials. 2007;4:245–253. doi: 10.1177/1740774507079441. [DOI] [PubMed] [Google Scholar]
- 38.Ioannidis JPA. Clarifications on the application and interpretation of the test for excess significance and its extensions. J Math Psychol. 2013;57:184–187. doi: 10.1016/j.jmp.2013.03.002. [DOI] [Google Scholar]
- 39.Lubin JH, Gail MH. On power and sample size for studying features of the relative odds of disease. Am J Epidemiol. 1990;131:552–566. doi: 10.1093/oxfordjournals.aje.a115530. [DOI] [PubMed] [Google Scholar]
- 40.Christian P, Lee SE, Donahue Angel M, Adair LS, Arifeen SE, Ashorn P, et al. Risk of childhood undernutrition related to small-for-gestational age and preterm birth in low- and middle-income countries. Int J Epidemiol. 2013;42:1340–1355. doi: 10.1093/ije/dyt109. [DOI] [PMC free article] [PubMed] [Google Scholar]
- 41.Mu M, Ye S, Bai M-J, Liu G-L, Tong Y, Wang S-F, et al. Birth weight and subsequent risk of asthma: a systematic review and meta-analysis. Hear Lung Circ. 2014;23:511–519. doi: 10.1016/j.hlc.2013.11.018. [DOI] [PubMed] [Google Scholar]
- 42.Risnes KR, Vatten LJ, Baker JL, Jameson K, Sovio U, Kajantie E, et al. Birthweight and mortality in adulthood: a systematic review and meta-analysis. Int J Epidemiol. 2011;40:647–661. doi: 10.1093/ije/dyq267. [DOI] [PubMed] [Google Scholar]
- 43.Schellong K, Schulz S, Harder T, Plagemann A. Birth weight and long-term overweight risk: systematic review and a meta-analysis including 643,902 persons from 66 studies and 26 countries globally. PLoS One. 2012;7:e47776. doi: 10.1371/journal.pone.0047776. [DOI] [PMC free article] [PubMed] [Google Scholar]
- 44.Lau J, Ioannidis JPA, Terrin N, Schmid CH, Olkin I. The case of the misleading funnel plot. BMJ Br Med J. 2006;333:597–600. doi: 10.1136/bmj.333.7568.597. [DOI] [PMC free article] [PubMed] [Google Scholar]
- 45.Lawlor DA, Davey Smith G, Ebrahim S. Birth weight of offspring and insulin resistance in late adulthood: cross sectional survey. BMJ. 2002;325:359. doi: 10.1136/bmj.325.7360.359. [DOI] [PMC free article] [PubMed] [Google Scholar]
- 46.Berhan Y, Berhan A. A meta-analysis of selected maternal and fetal factors for perinatal mortality. Ethiop J Health Sci. 2014;24:55–68. doi: 10.4314/ejhs.v24i0.6S. [DOI] [PMC free article] [PubMed] [Google Scholar]
- 47.Knippenberg R, Lawn JE, Darmstadt GL, Begkoyian G, Fogstad H, Walelign N, et al. Systematic scaling up of neonatal care in countries. Lancet. 2005;365:1087–1098. doi: 10.1016/S0140-6736(05)74233-1. [DOI] [PubMed] [Google Scholar]
- 48.Baird J, Kurshid MA, Kim M, Harvey N, Dennison E, Cooper C. Does birthweight predict bone mass in adulthood? A systematic review and meta-analysis. Osteoporos Int. 2011;22:1323–1334. doi: 10.1007/s00198-010-1344-9. [DOI] [PubMed] [Google Scholar]
- 49.Wardlaw T, Blanc A, Zupan J, Ahman E. United Nations Children’s Fund and World Health Organization, Low Birthweight: Country, Regional and Global Estimates. New York: UNICEF; 2004. [Google Scholar]
- 50.Tyrrell J, Richmond RC, Palmer TM, Feenstra B, Rangarajan J, Metrustry S, et al. Genetic evidence for causal relationships between maternal obesity-related traits and birth weight. JAMA. 2016;315:1129. doi: 10.1001/jama.2016.1975. [DOI] [PMC free article] [PubMed] [Google Scholar]
- 51.HAPO Study Cooperative Research Group. Metzger BE, Lowe LP, Dyer AR, Trimble ER, Chaovarindr U, et al. Hyperglycemia and adverse pregnancy outcomes. N Engl J Med. 2008;358:1991–2002. doi: 10.1056/NEJMoa0707943. [DOI] [PubMed] [Google Scholar]
- 52.Chiswick C, Reynolds RM, Denison F, Drake AJ, Forbes S, Newby DE, et al. Effect of metformin on maternal and fetal outcomes in obese pregnant women (EMPOWaR): a randomised, double-blind, placebo-controlled trial. Lancet Diab Endocrinol. 2015;3:778–786. doi: 10.1016/S2213-8587(15)00219-3. [DOI] [PMC free article] [PubMed] [Google Scholar]
- 53.Poston L, Bell R, Croker H, Flynn AC, Godfrey KM, Goff L, et al. Effect of a behavioural intervention in obese pregnant women (the UPBEAT study): a multicentre, randomised controlled trial. Lancet Diab Endocrinol. 2015;3:767–777. doi: 10.1016/S2213-8587(15)00227-2. [DOI] [PubMed] [Google Scholar]
- 54.Dodd JM, Turnbull D, McPhee AJ, Deussen AR, Grivell RM, Yelland LN, et al. Antenatal lifestyle advice for women who are overweight or obese: LIMIT randomised trial. BMJ. 2014;348:g1285. doi: 10.1136/bmj.g1285. [DOI] [PMC free article] [PubMed] [Google Scholar]
- 55.Loret de Mola C, de Franca GV A, Quevedo LDA, Horta BL. Low birth weight, preterm birth and small for gestational age association with adult depression: systematic review and meta-analysis. Br J Psychiatry. 2014;205:340–347. doi: 10.1192/bjp.bp.113.139014. [DOI] [PubMed] [Google Scholar]
- 56.Milne E, Greenop KR, Metayer C, Schüz J, Petridou E, Pombo-de-Oliveira MS, et al. Fetal growth and childhood acute lymphoblastic leukemia: findings from the childhood leukemia international consortium. Int J Cancer. 2013;133:2968–2979. doi: 10.1002/ijc.28004. [DOI] [PMC free article] [PubMed] [Google Scholar]
- 57.Delbaere I, Vansteelandt S, De Bacquer D, Verstraelen H, Gerris J, De Sutter P, et al. Should we adjust for gestational age when analysing birth weights? The use of z-scores revisited. Hum Reprod. 2007;22:2080–2083. doi: 10.1093/humrep/dem151. [DOI] [PubMed] [Google Scholar]
- 58.Cook MB, Akre O, Forman D, Madigan MP, Richiardi L, McGlynn KA. A systematic review and meta-analysis of perinatal variables in relation to the risk of testicular cancer--experiences of the son. Int J Epidemiol. 2010;39:1605–1618. doi: 10.1093/ije/dyq120. [DOI] [PMC free article] [PubMed] [Google Scholar]
- 59.Araújo de França GV, Restrepo-Méndez MC, Loret de Mola C, Victora CG. Size at birth and abdominal adiposity in adults: a systematic review and meta-analysis. Obes Rev. 2014;15:77–91. doi: 10.1111/obr.12109. [DOI] [PubMed] [Google Scholar]
- 60.Chen S, Yang L, Pu F, Lin H, Wang B, Liu J, et al. High birth weight increases the risk for bone tumor: A systematic review and meta-analysis. Int J Environ Res Public Health. 2015;12:11178–11195. doi: 10.3390/ijerph120911178. [DOI] [PMC free article] [PubMed] [Google Scholar]
- 61.Davey Smith G, Hypponen E, Power C, Lawlor DA. Offspring birth weight and parental mortality: prospective observational study and meta-analysis. Am J Epidemiol. 2007;166:160–169. doi: 10.1093/aje/kwm054. [DOI] [PubMed] [Google Scholar]
- 62.Dodds R, Denison HJ, Ntani G, Cooper R, Cooper C, Sayer AA, et al. Birth weight and muscle strength: a systematic review and meta-analysis. J Nutr Health Aging. 2012;16:609–615. doi: 10.1007/s12603-012-0053-9. [DOI] [PMC free article] [PubMed] [Google Scholar]
- 63.Harder T, Plagemann A, Harder A. Birth weight and subsequent risk of childhood primary brain tumors: a meta-analysis. Am J Epidemiol. 2008;168:366–373. doi: 10.1093/aje/kwn144. [DOI] [PubMed] [Google Scholar]
- 64.Harder T, Roepke K, Diller N, Stechling Y, Dudenhausen JW, Plagemann A. Birth weight, early weight gain, and subsequent risk of type 1 diabetes: systematic review and meta-analysis. Am J Epidemiol. 2009;169:1428–1436. doi: 10.1093/aje/kwp065. [DOI] [PubMed] [Google Scholar]
- 65.Harder T, Plagemann A, Harder A. Birth weight and risk of neuroblastoma: a meta-analysis. Int J Epidemiol. 2010;39:746–756. doi: 10.1093/ije/dyq040. [DOI] [PubMed] [Google Scholar]
- 66.Jackson S, Mathews KH, Pulanic D, Falconer R, Rudan I, Campbell H, et al. Risk factors for severe acute lower respiratory infections in children: a systematic review and meta-analysis. Croat Med J. 2013;54:110–121. doi: 10.3325/cmj.2013.54.110. [DOI] [PMC free article] [PubMed] [Google Scholar]
- 67.Kormos CE, Wilkinson AJ, Davey CJ, Cunningham AJ. Low birth weight and intelligence in adolescence and early adulthood: a meta-analysis. J Public Health (Oxf) 2014;36:213–224. doi: 10.1093/pubmed/fdt071. [DOI] [PubMed] [Google Scholar]
- 68.Lawlor DA, Ebrahim S, Davey SG. Association of birth weight with adult lung function: findings from the British Women’s Heart and Health Study and a meta-analysis. Thorax. 2005;60:851–858. doi: 10.1136/thx.2005.042408. [DOI] [PMC free article] [PubMed] [Google Scholar]
- 69.Lawlor DA, Owen CG, Davies AA, Whincup PH, Ebrahim S, Cook DG, et al. Sex differences in the association between birth weight and total cholesterol. A meta-analysis. Ann Epidemiol. 2006;16:19–25. doi: 10.1016/j.annepidem.2005.04.006. [DOI] [PubMed] [Google Scholar]
- 70.Michos A, Xue F, Michels KB. Birth weight and the risk of testicular cancer: a meta-analysis. Int J Cancer. 2007;121:1123–1131. doi: 10.1002/ijc.22771. [DOI] [PubMed] [Google Scholar]
- 71.Mu M, Wang S-F, Sheng J, Zhao Y, Li H-Z, Hu C-L, et al. Birth weight and subsequent blood pressure: a meta-analysis. Arch Cardiovasc Dis. 2012;105:99–113. doi: 10.1016/j.acvd.2011.10.006. [DOI] [PubMed] [Google Scholar]
- 72.Øglund GP, Hildebrand M, Ekelund U. Are birth weight, early growth and motor development determinants of physical activity in children and youth? A systematic review and meta-analysis. Pediatr Exerc Sci. 2015;27(4):441–453. doi: 10.1123/pes.2015-0041. [DOI] [PubMed] [Google Scholar]
- 73.Papadopoulou C, Antonopoulos CN, Sergentanis TN, Panagopoulou P, Belechri M, Petridou ET. Is birth weight associated with childhood lymphoma? A meta-analysis. Int J Cancer. 2012;130:179–89. [DOI] [PubMed]
- 74.Panduru M, Salavastru CM, Panduru NM, Tiplica GS. Birth weight and atopic dermatitis: systematic review and meta-analysis. Acta Dermatovenerol Croat. 2014;22:91–96. [PubMed] [Google Scholar]
- 75.Silveira VMFD, Horta BL. Birth weight and metabolic syndrome in adults: meta-analysis. Rev Saude Publica. 2008;42:10–18. doi: 10.1590/S0034-89102008000100002. [DOI] [PubMed] [Google Scholar]
- 76.Shi T, Balsells E, Wastnedge E, Singleton R, Rasmussen ZA, Zar HJ, et al. Risk factors for respiratory syncytial virus associated with acute lower respiratory infection in children under five years: systematic review and meta-analysis. J Glob Health. 2015;5:020416. doi: 10.7189/jogh.05.020416. [DOI] [PMC free article] [PubMed] [Google Scholar]
- 77.van Montfoort N, Finken MJJ, le Cessie S, Dekker FW, Wit JM. Could cortisol explain the association between birth weight and cardiovascular disease in later life? A meta-analysis Eur J Endocrinol. 2005;153:811–7. [DOI] [PubMed]
- 78.Whincup P, Kaye S, Owen CG, Al E. Birth weight and risk of type 2 diabetes. JAMA. 2008;300:2886. doi: 10.1001/jama.2008.886. [DOI] [PubMed] [Google Scholar]
- 79.White SL, Perkovic V, Cass A, Chang CL, Poulter NR, Spector T, et al. Is low birth weight an antecedent of CKD in later life? A systematic review of observational studies. Am J Kidney Dis. 2009;54:248–261. doi: 10.1053/j.ajkd.2008.12.042. [DOI] [PubMed] [Google Scholar]
- 80.Xu X, Dailey AB, Peoples-Sheps M, Talbott EO, Li N, Roth J. Birth weight as a risk factor for breast cancer: a meta-analysis of 18 epidemiological studies. J Womens Health (Larchmt) 2009;18:1169–1178. doi: 10.1089/jwh.2008.1034. [DOI] [PubMed] [Google Scholar]
- 81.Zhang Y, Li H, Liu S-J, Fu G-J, Zhao Y, Xie Y-J, et al. The associations of high birth weight with blood pressure and hypertension in later life: a systematic review and meta-analysis. Hypertens Res. 2013;36(8):725–735. doi: 10.1038/hr.2013.33. [DOI] [PubMed] [Google Scholar]
- 82.Hjalgrim LL, Westergaard T, Rostgaard K, Schmiegelow K, Melbye M, Hjalgrim H, et al. Birth weight as a risk factor for childhood leukemia: a meta-analysis of 18 epidemiologic studies. Am J Epidemiol. 2003;158:724–735. doi: 10.1093/aje/kwg210. [DOI] [PubMed] [Google Scholar]
- 83.Xu X-F, Li Y-J, Sheng Y-J, Liu J-L, Tang L-F, Chen Z-M. Effect of low birth weight on childhood asthma: a meta-analysis. BMC Pediatr. 2014;14:275. doi: 10.1186/1471-2431-14-275. [DOI] [PMC free article] [PubMed] [Google Scholar]
- 84.Flaherman V, Rutherford GW. A meta-analysis of the effect of high weight on asthma. Arch Dis Child. 2006;91:334–339. doi: 10.1136/adc.2005.080390. [DOI] [PMC free article] [PubMed] [Google Scholar]
- 85.Martínez-Mesa J, Restrepo-Méndez MC, González DA, Wehrmeister FC, Horta BL, Domingues MR, et al. Life-course evidence of birth weight effects on bone mass: systematic review and meta-analysis. Osteoporos Int. 2012;24:7–18. doi: 10.1007/s00198-012-2114-7. [DOI] [PubMed] [Google Scholar]
- 86.Zhao Y, Wang SF, Mu M, Sheng J. Birth weight and overweight/obesity in adults: a meta-analysis. Eur J Pediatr. 2012;171:1737–1746. doi: 10.1007/s00431-012-1701-0. [DOI] [PubMed] [Google Scholar]
- 87.Huxley R, Owen CG, Whincup PH, Cook DG, Rich-Edwards J, Smith GD, et al. Is birth weight a risk factor for ischemic heart disease in later life? Am J Clin Nutr. 2007;85:1244–1250. doi: 10.1093/ajcn/85.5.1244. [DOI] [PubMed] [Google Scholar]
- 88.Yu ZB, Han SP, Zhu GZ, Zhu C, Wang XJ, Cao XG, et al. Birth weight and subsequent risk of obesity: a systematic review and meta-analysis. Obes Rev. 2011;12:525–542. doi: 10.1111/j.1467-789X.2011.00867.x. [DOI] [PubMed] [Google Scholar]
- 89.Huxley R, Owen CG, Whincup PH, Cook DG, Colman S, Collins R. Birth weight and subsequent cholesterol levels: exploration of the “fetal origins” hypothesis. JAMA. 2004;292:2755–2764. doi: 10.1001/jama.292.22.2755. [DOI] [PubMed] [Google Scholar]
- 90.Owen CG, Whincup PH, Odoki K, Gilg JA, Cook DG. Birth weight and blood cholesterol level: a study in adolescents and systematic review. Pediatrics. 2003;111:1081–1089. doi: 10.1542/peds.111.5.1081. [DOI] [PubMed] [Google Scholar]
Associated Data
This section collects any data citations, data availability statements, or supplementary materials included in this article.
Data Availability Statement
The datasets analysed and generated during the current study are available from the corresponding author on reasonable request.